
SILVER: Elliott Wave and Technical Analysis | Charts – March 19, 2021
Summary: The first wave count for the mid term is bullish with a final target at 43.44. The final invalidation point for this wave count is now at 49.752.
A new alternate wave count is bearish for the short, mid and long term. Confidence may be had with a new low below 24.283. A target is at 7.45.
The second wave count is overall bullish at the monthly chart level.
The second wave count has two weekly charts. The first is bearish for the mid term, expecting a pullback to about 18.605 before the bull market resumes. The second is an alternate wave count that expects the bull market has resumed for Silver; the next target for an interruption to the trend may be at 33.73, with a long-term target at 50.98.
ELLIOTT WAVE COUNTS
FIRST ELLIOTT WAVE COUNT
MONTHLY CHART
Click chart to enlarge.
This first wave count still has a better look in terms of Elliott wave structures.
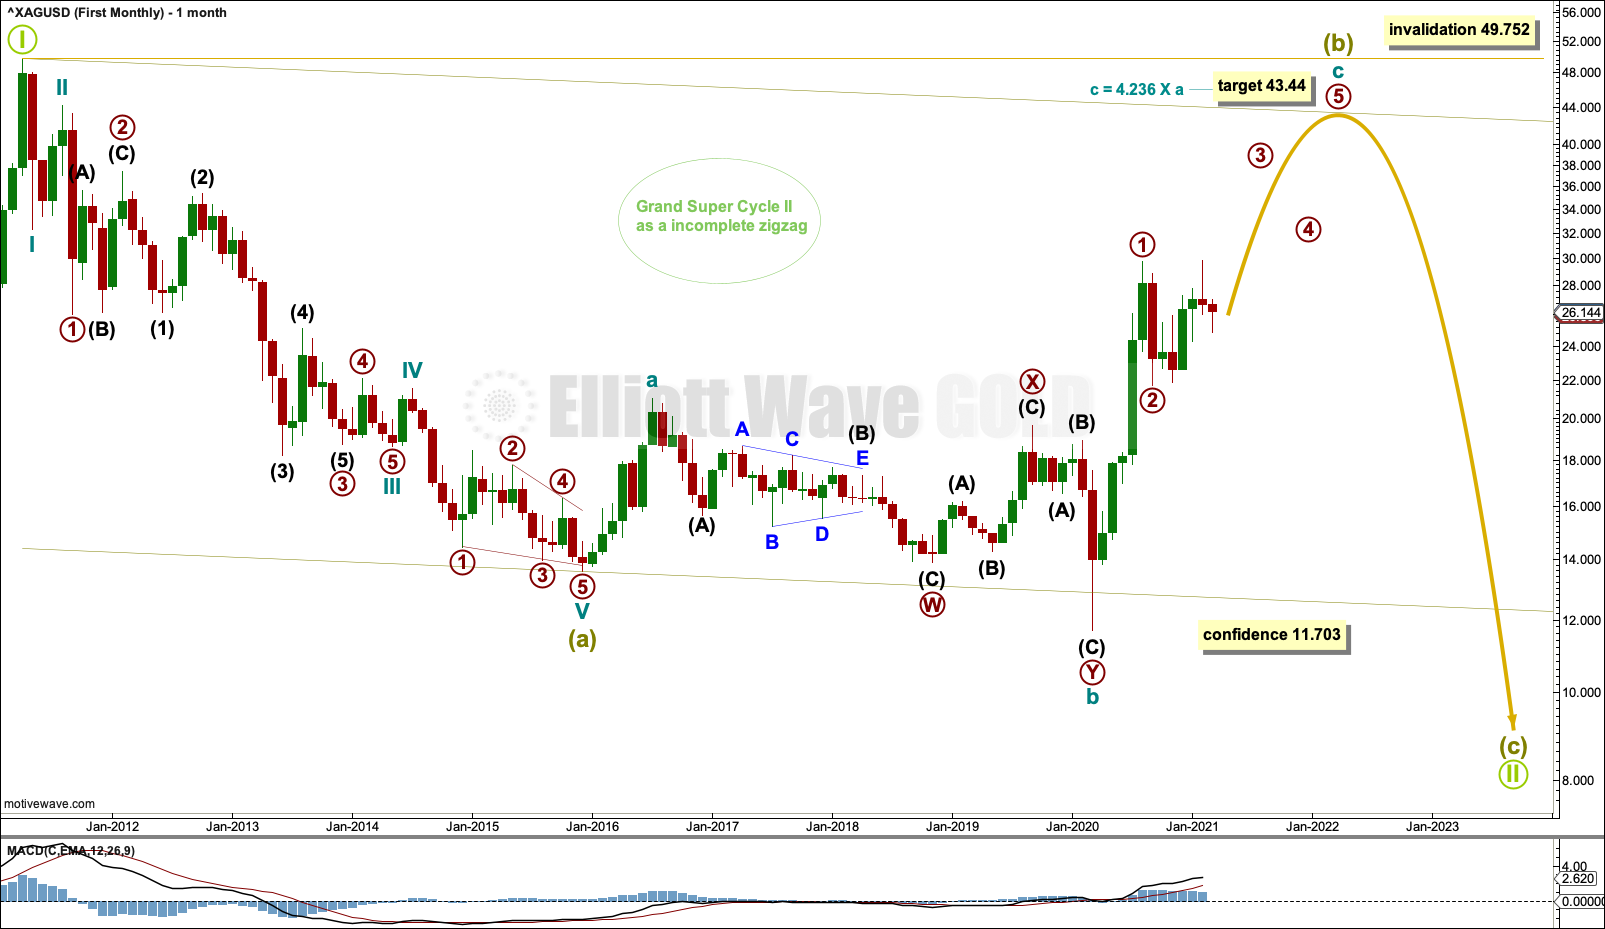
It is possible that the zigzag for Grand Super Cycle wave II may be incomplete. Super Cycle wave (b) may be continuing higher as an expanded flat correction, and within it cycle wave c may be continuing higher as an impulse.
Cycle wave b within the expanded flat of Super Cycle wave (b) is a 1.25 length of cycle wave a. This is within the most common range for B waves within flats of up to 1.38 times their counterpart A wave.
Cycle wave b within Super Cycle wave (b) subdivides as a double zigzag. This is a very common Elliott wave corrective structure, particularly in a B wave position. This part of the wave count has an excellent fit; all subdivisions are correct and the structures are common. This resolves the problem that the second wave count has of the triangle trend lines not being strictly adhered to.
A target is calculated for Super Cycle wave (b).
Super Cycle wave (b) may not move beyond the start of Super Cycle wave (a) above 49.752.
WEEKLY CHART
Click chart to enlarge.
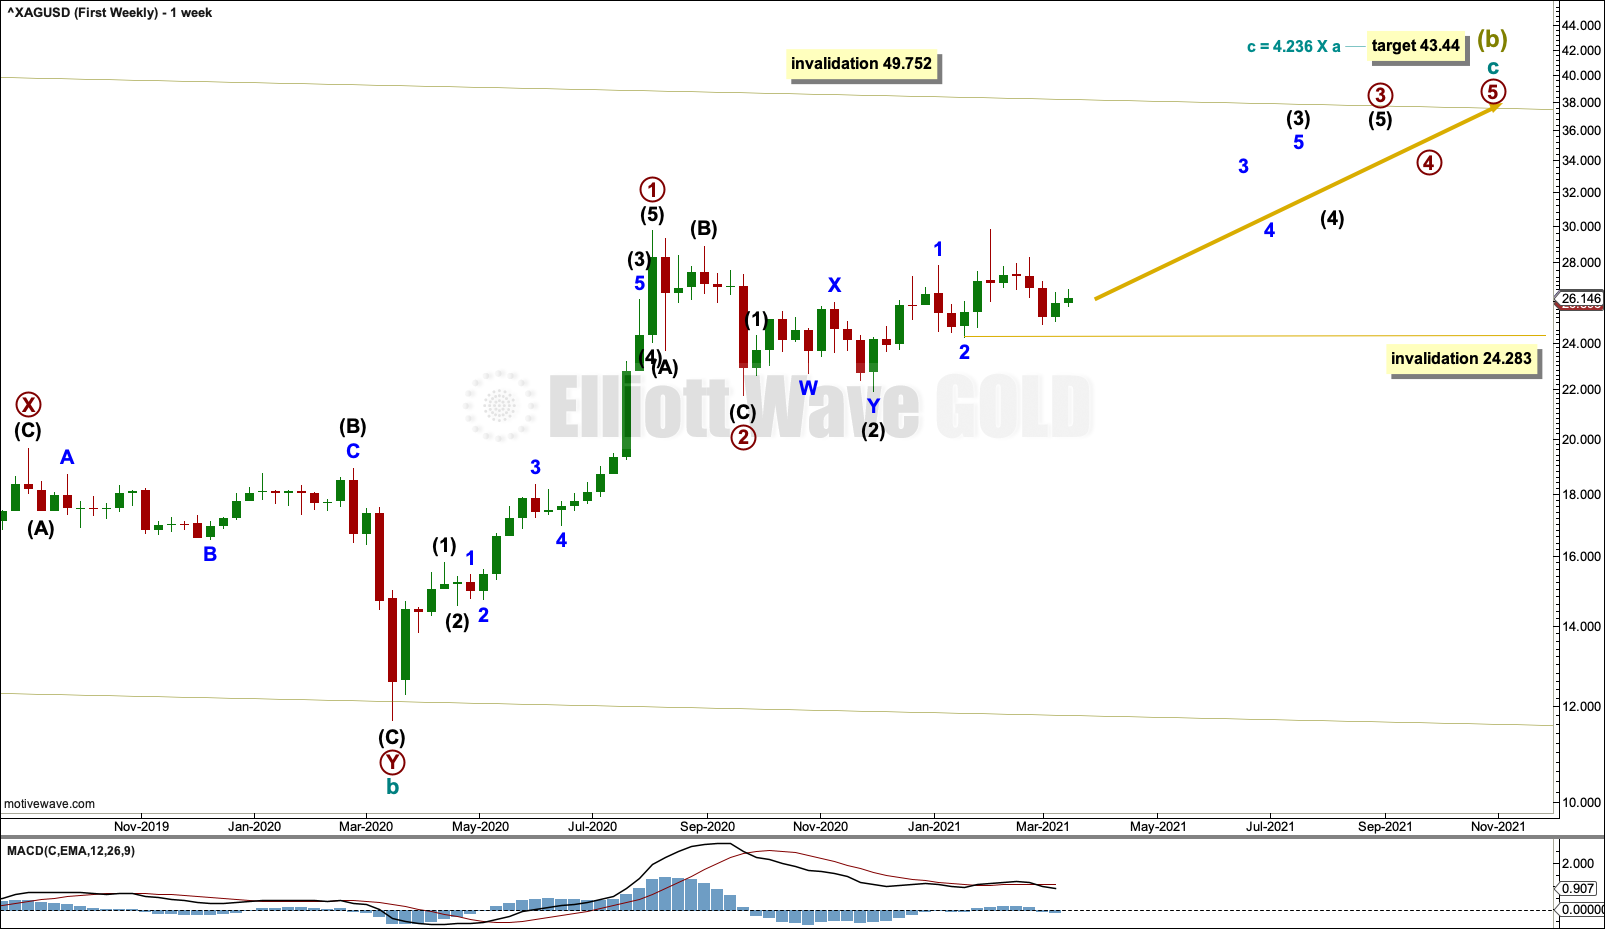
Cycle wave c must subdivide as a five wave structure, most likely an impulse.
Primary waves 1 and 2 may be complete. Primary wave 3 may be underway. Primary wave 3 may only subdivide as an impulse. Within primary wave 3: Intermediate waves (1) and (2) may be complete, and intermediate wave (3) may only subdivide as an impulse.
Within minor wave 3, no second wave correction may move beyond its start below 24.283.
DAILY CHART
Click chart to enlarge.
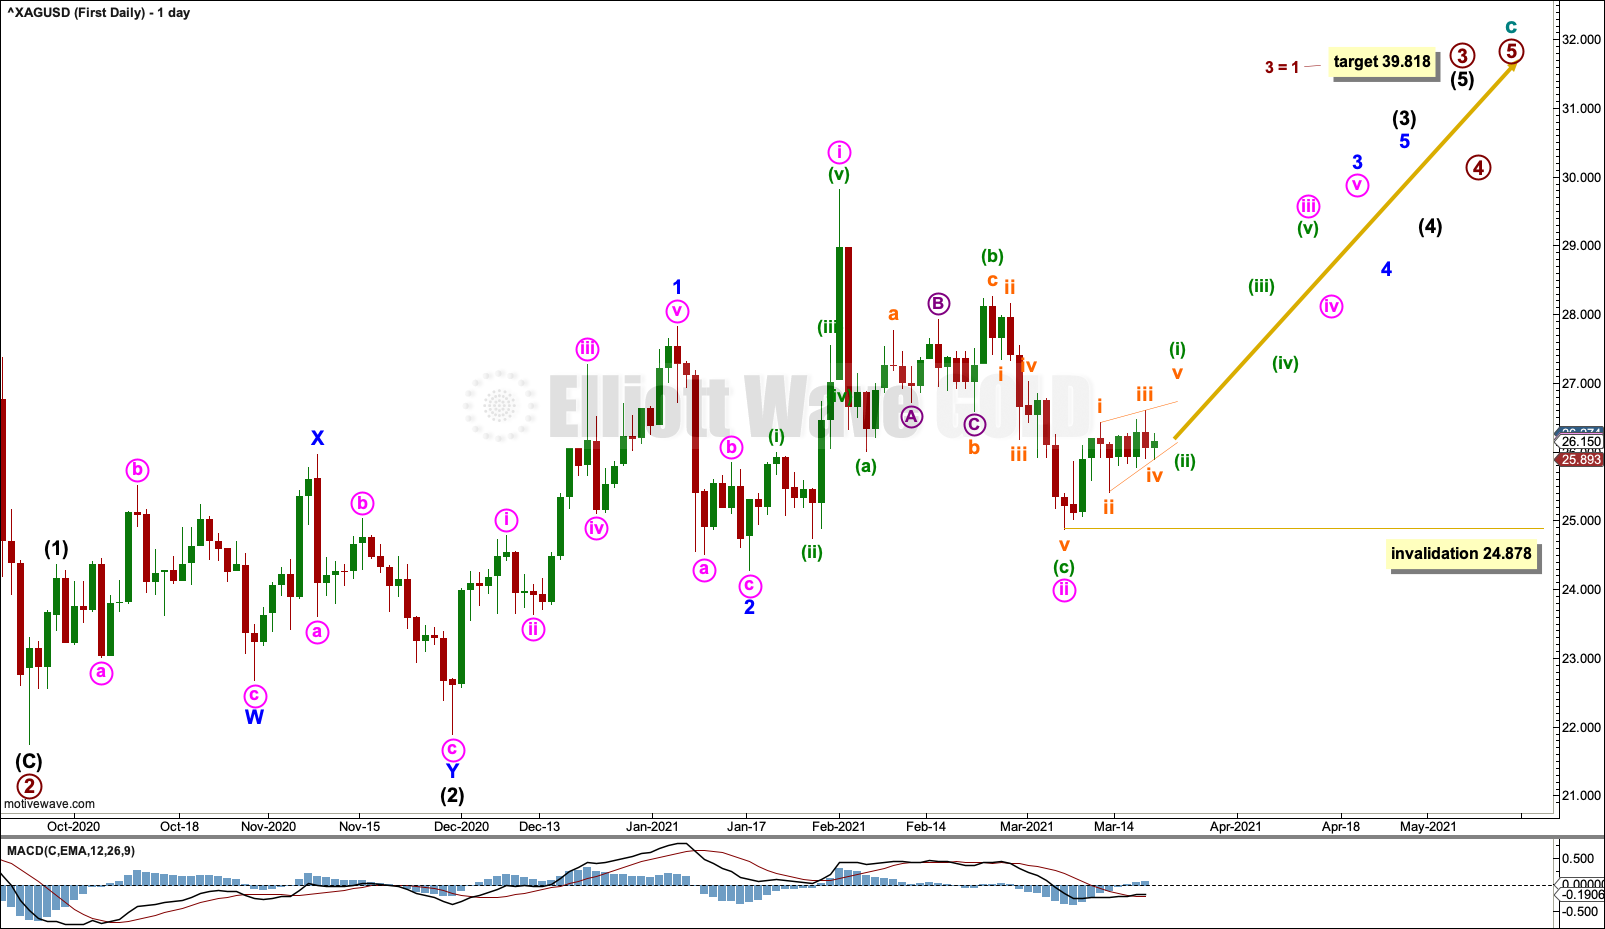
The daily chart focusses on primary wave 3 within cycle wave c.
A target is calculated for primary wave 3.
Within primary wave 3: Intermediate waves (1) and (2) may be complete, and intermediate wave (3) may have begun and may only subdivide as an impulse. Within intermediate wave (3): Minor waves 1 and 2 may be complete, and minor wave 3 may have begun and may only subdivide as an impulse.
Within minor wave 3: Minute waves i and ii may be complete, and minute wave iii may only subdivide as an impulse. Minuette wave (i) within minute wave iii may be an incomplete leading contracting diagonal. When minuette wave (i) is complete, then a small pullback for minuette wave (ii) may not move beyond the start of minuette wave (i) below 24.878.
Upwards movement (labelled primary wave 2) from the low of September 24, 2020, is choppy and overlapping. This does not look like a typical third wave. For this reason an alternate is considered below.
ALTERNATE WEEKLY CHART
Click chart to enlarge.
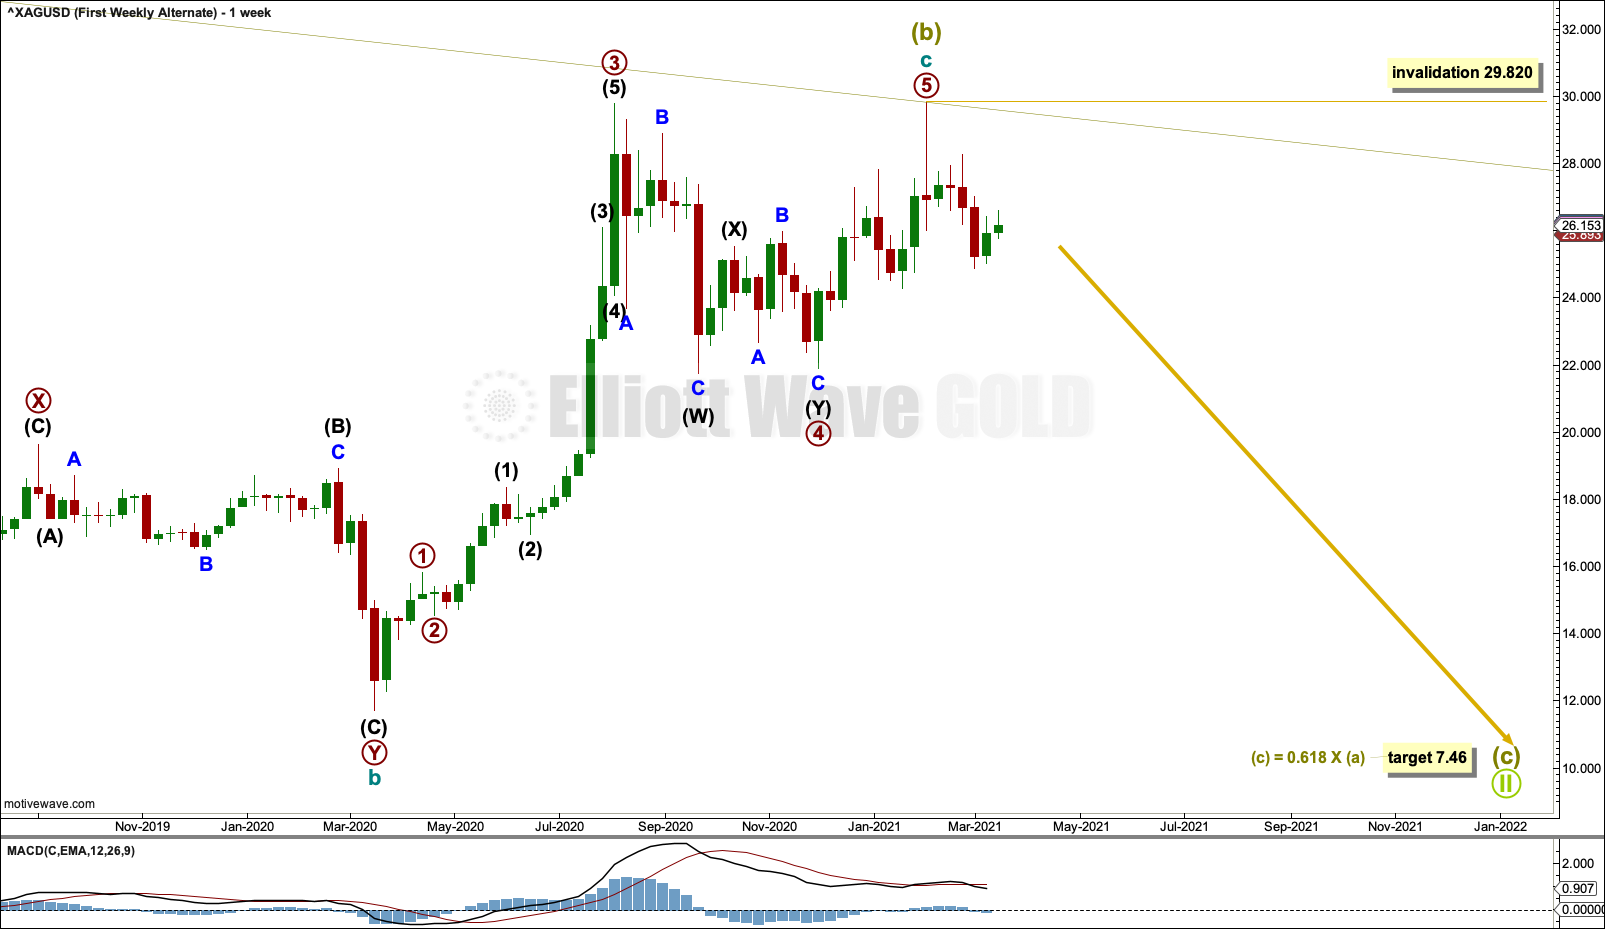
It is possible that Super Cycle wave (b) was complete at the last high and cycle wave c within it is a complete five wave impulse.
The disproportion between primary waves 2 and 4 within cycle wave c gives this part of the wave count the wrong look, but it should still be considered because Silver does not always exhibit good proportion.
If Super Cycle wave (c) has begun, then it should move below the end of Super Cycle wave (a) at 13.569 to avoid a truncation. A target is calculated.
ALTERNATE DAILY CHART
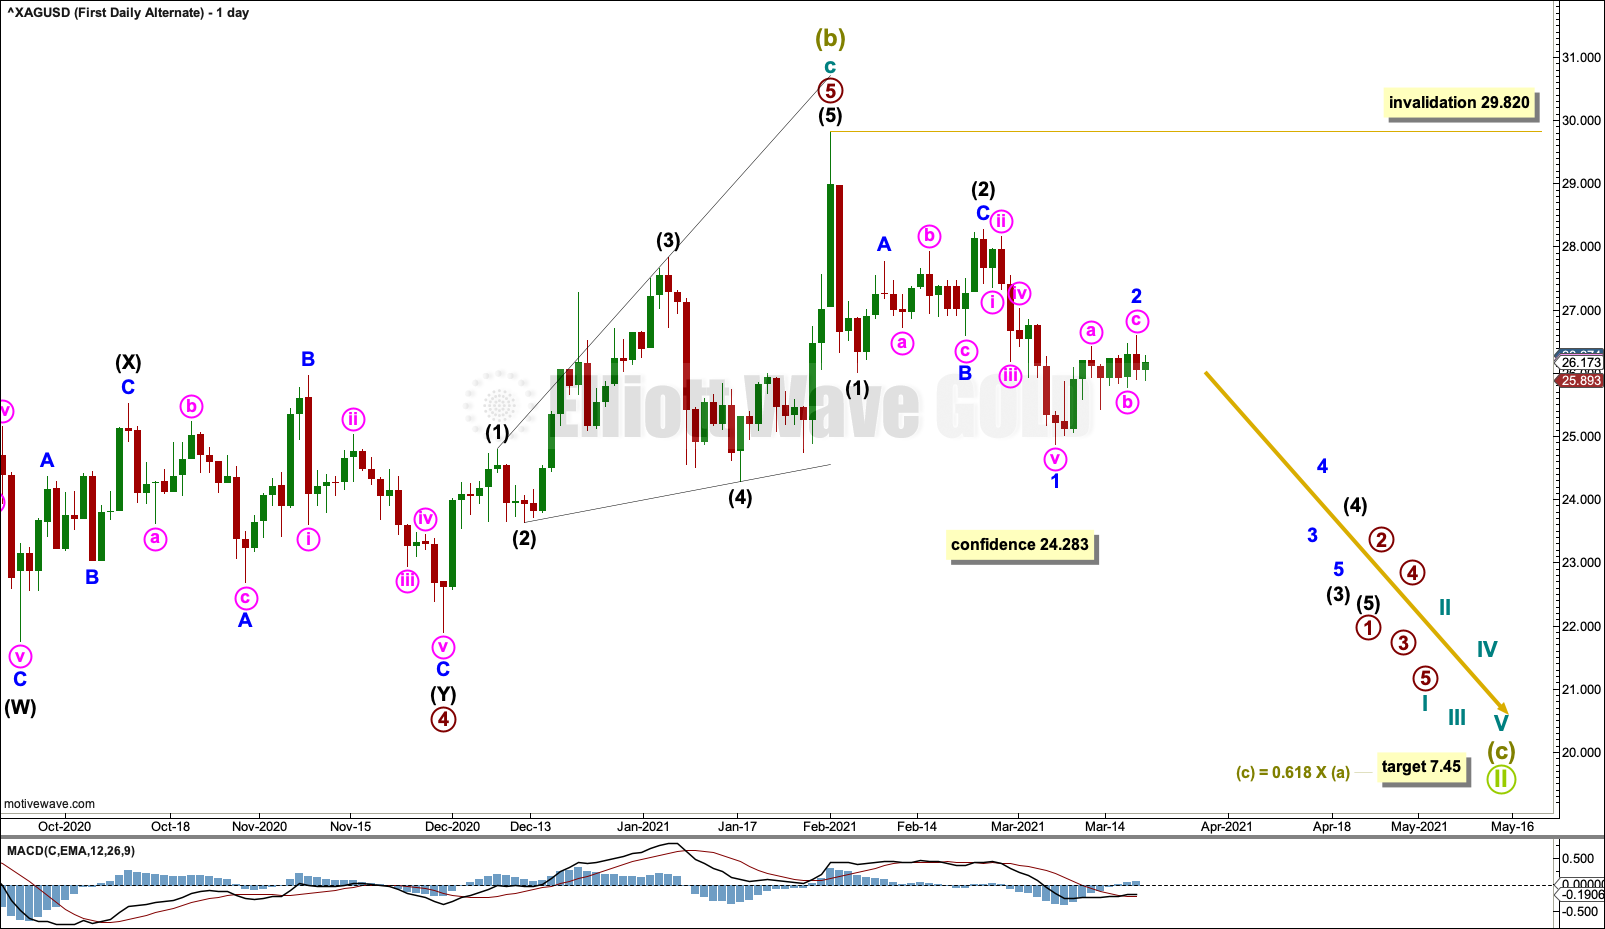
Click chart to enlarge.
Within cycle wave c: Primary wave 4 may have completed as a double combination, and primary wave 5 may have completed as an ending expanding diagonal. This explains the overlapping nature of this portion of the structure.
Neither primary wave 2 nor cycle wave II within Super Cycle wave (c) may move beyond their start above 29.820.
SECOND ELLIOTT WAVE COUNT
MONTHLY CHART
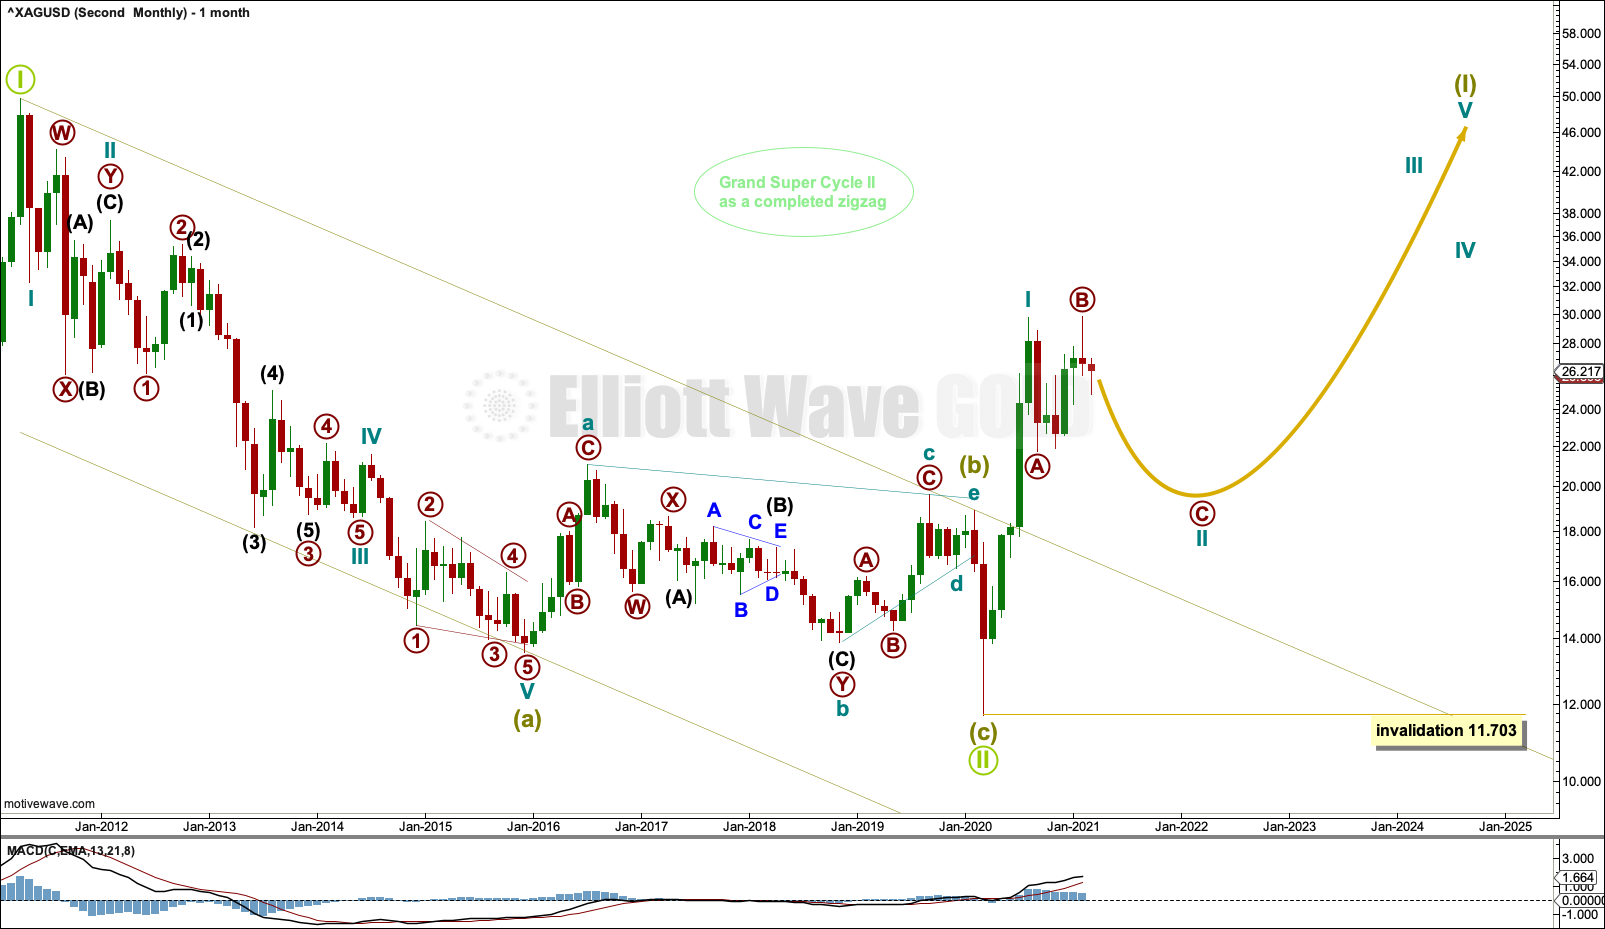
Click chart to enlarge.
The bear market for Silver may be complete.
This Elliott wave structure for this bear market is labelled as a single zigzag for Grand Super Cycle wave II. Single zigzags are the most common Elliott wave corrective structure.
Within the zigzag: Super Cycle wave (a) subdivides as a five wave impulse, Super Cycle wave (b) subdivides as a complete regular contracting triangle, and Super Cycle wave (c) subdivides as a complete five wave impulse that is relatively brief and shallow.
Elliott wave triangles normally adhere strictly to their trend lines. The triangle for Super Cycle wave (b) does not; the lower b-d trend line is overshot, which reduces the probability of this wave count and is one reason for publication of the first wave count.
When charts are drawn on a semi-log scale, price has now breached the upper edge of the trend channel. Copy this channel over to weekly and daily charts. The upper edge of this channel may now provide support.
Grand Super Cycle wave III must subdivide as a five wave impulse at Super Cycle degree.
WEEKLY CHART
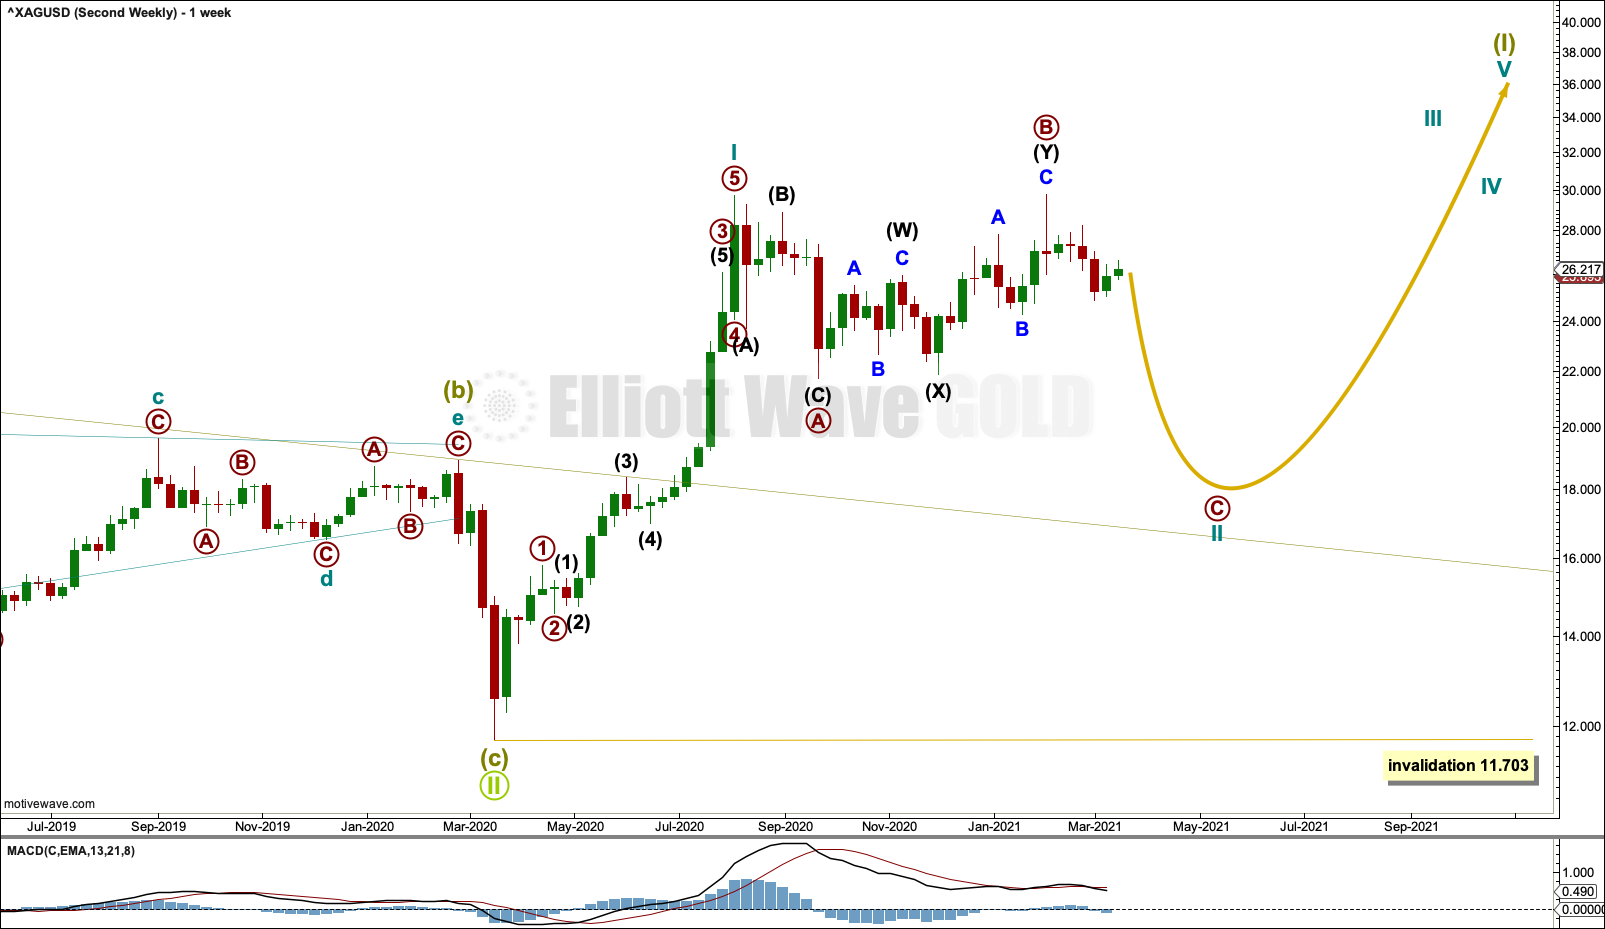
Click chart to enlarge.
Grand Super Cycle wave II may be a complete zigzag. A new bull market may have begun for Silver.
The channel about Grand Super Cycle wave II is copied over from the monthly chart and extended outwards.
Super Cycle wave (I) may subdivide as an impulse or a leading diagonal. An impulse is much more common, so that is what shall be expected unless overlapping suggests a diagonal should be considered.
Cycle wave II may continue as a multi-month pullback. Cycle wave II may be subdividing as a regular flat. A likely point for cycle wave II to end may still be the 0.618 Fibonacci ratio of cycle wave I. If this target is wrong, then it may not be low enough. The first major correction within a new trend is often very deep.
Cycle wave II may not move beyond the start of cycle wave I below 11.703.
DAILY CHART
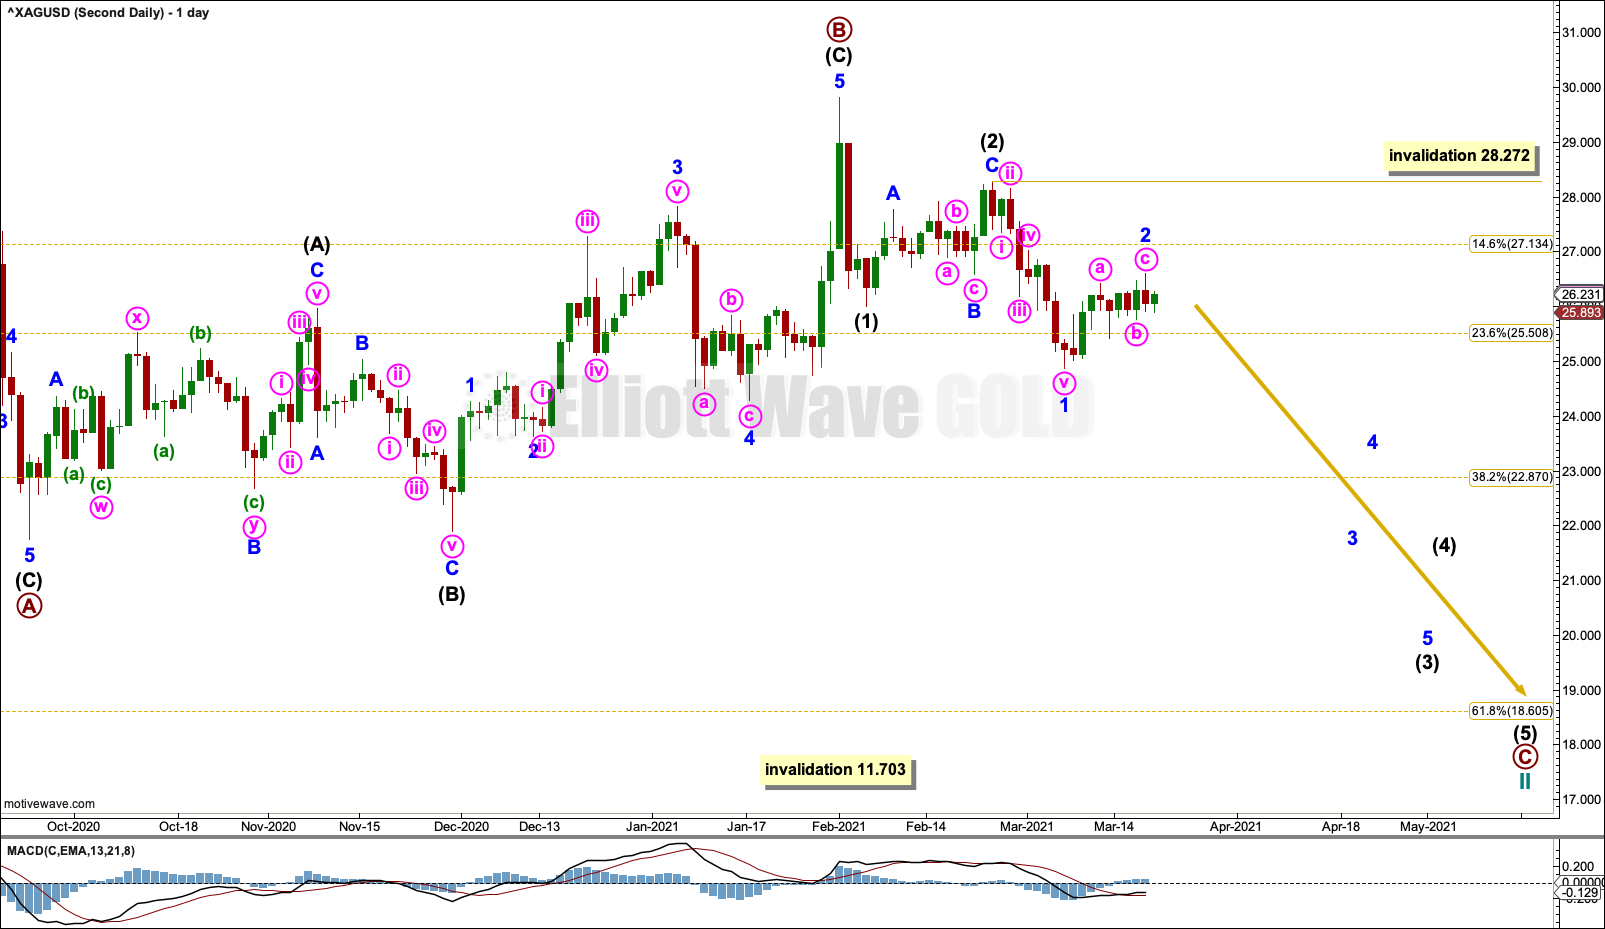
Click chart to enlarge.
Primary wave B is a 1.01 length of primary wave A. This is within the common range for B waves within flats of 1 to 1.38.
Primary wave C may now move lower for this wave count to at least make a slight new low below the end of primary wave A at 21.749 to avoid a truncation and a very rare running flat.
Minor wave 2 within intermediate wave (3) may not move beyond the start of minor wave 1 above 28.272.
ALTERNATE DAILY CHART
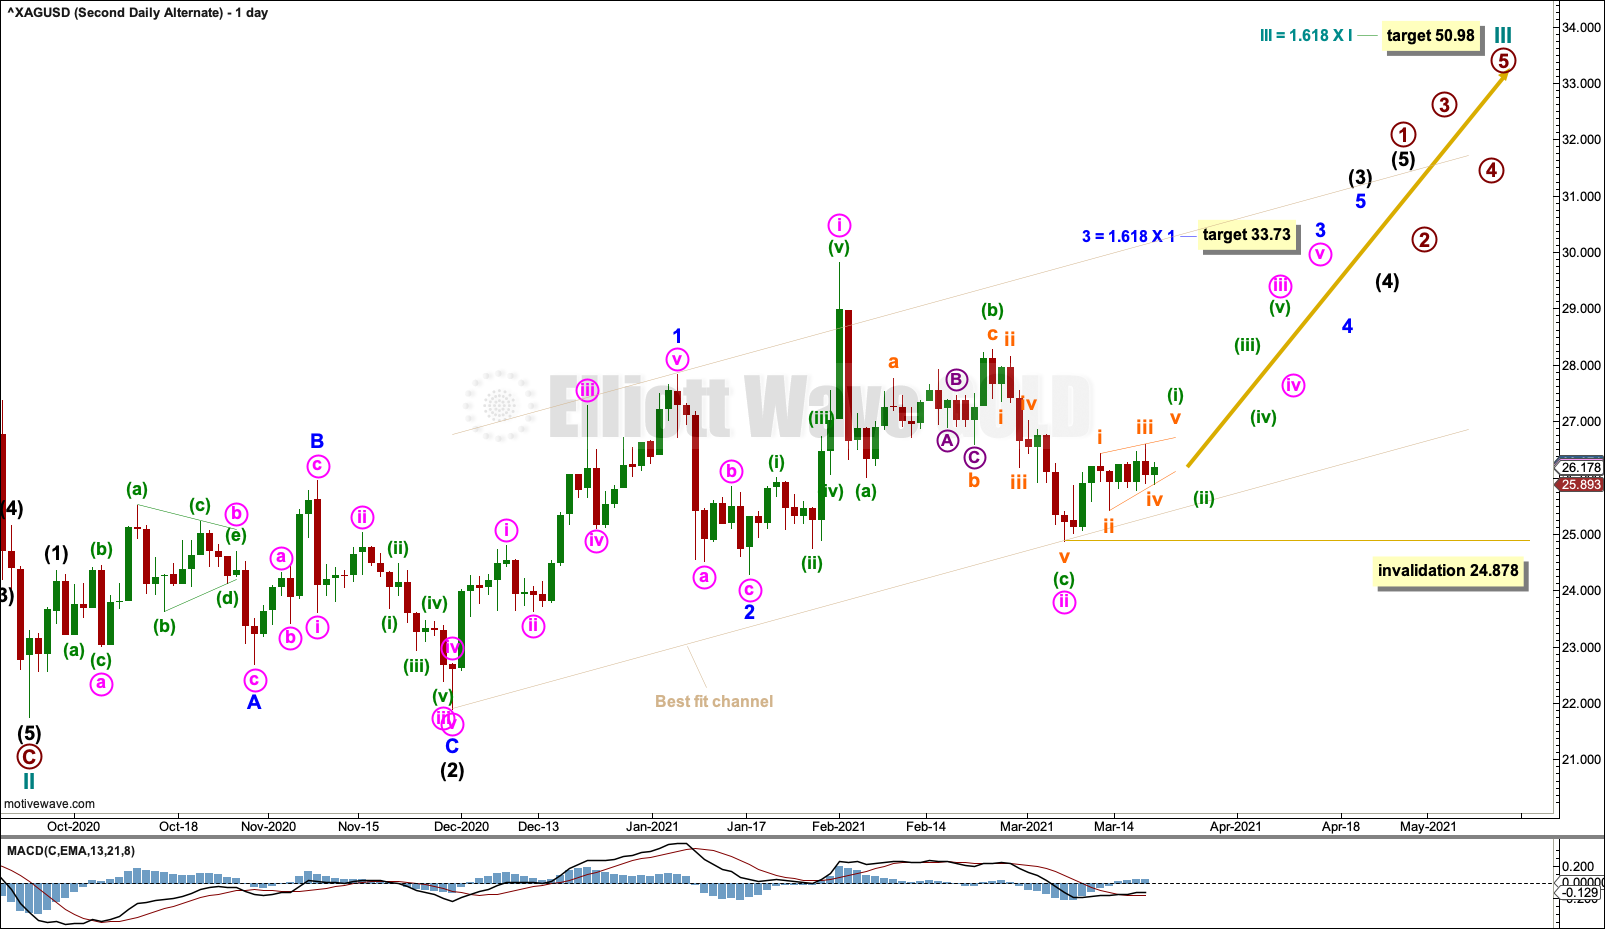
Click chart to enlarge.
If cycle wave II is over, then it would have lasted only 7 weeks to the 20 weeks of cycle wave I, and be only 0.44 the depth of cycle wave I. While this is possible, it is less common than a longer lasting and deeper second wave correction as the first large correction within a new trend. Some confidence in this alternate wave count may now be had with a new high above 29.772.
Cycle wave III may only subdivide as an impulse. Within the impulse: Intermediate wave (1) may be complete, and intermediate wave (2) may be complete as a very deep expanded flat. The structure of intermediate wave (3) is incomplete, and within it a target is calculated for minor wave 3.
No second wave correction within minor wave 3 may move beyond its start below 24.878.
When primary wave 1 is complete, then primary wave 2 may not move beyond the start of primary wave 1 below 21.749.
The target for cycle wave III expects it to exhibit a common Fibonacci ratio to cycle wave I.
The best fit channel is adjusted this week to better contain the beginning of cycle wave III. The lower edge of the channel may provide support.
TECHNICAL ANALYSIS
WEEKLY CHART

Click chart to enlarge. Chart courtesy of StockCharts.com.
There is no longer a trend at this time frame.
Price is consolidating with resistance at 28 and support at 22.5. A breakout is required for confidence in a trend.
The last two upwards weeks have small range and weak volume. This is bearish.
DAILY CHART

Click chart to enlarge. Chart courtesy of StockCharts.com.
Price is still consolidating with support about 24 and resistance about 27.95.
Overall, this chart still leans bearish but not clearly so.
Published @ 03:38 p.m. ET.
—
Careful risk management protects your trading account(s).
Follow my two Golden Rules:
1. Always trade with stops.
2. Risk only 1-5% of equity on any one trade.
—
New updates to this analysis are in bold.