
US OIL: Elliott Wave and Technical Analysis | Charts – March 12, 2021
A target for upwards movement to end for the week was at 68.49. Price reached 67.97, 0.52 short of the target.
Summary: A pullback or consolidation may last several weeks. A first target is at 54.86. Thereafter, the next target is at 46.76 if price keeps falling.
A breach of the best fit channel would add substantial confidence in a trend change and the start of a multi-week pullback or consolidation.
The larger trend remains up.
A longer-term target for a third wave is at 87.90 or 121.43.
Oil may have found a major sustainable low in April 2020.
ELLIOTT WAVE COUNT
MONTHLY CHART
Click chart to enlarge.
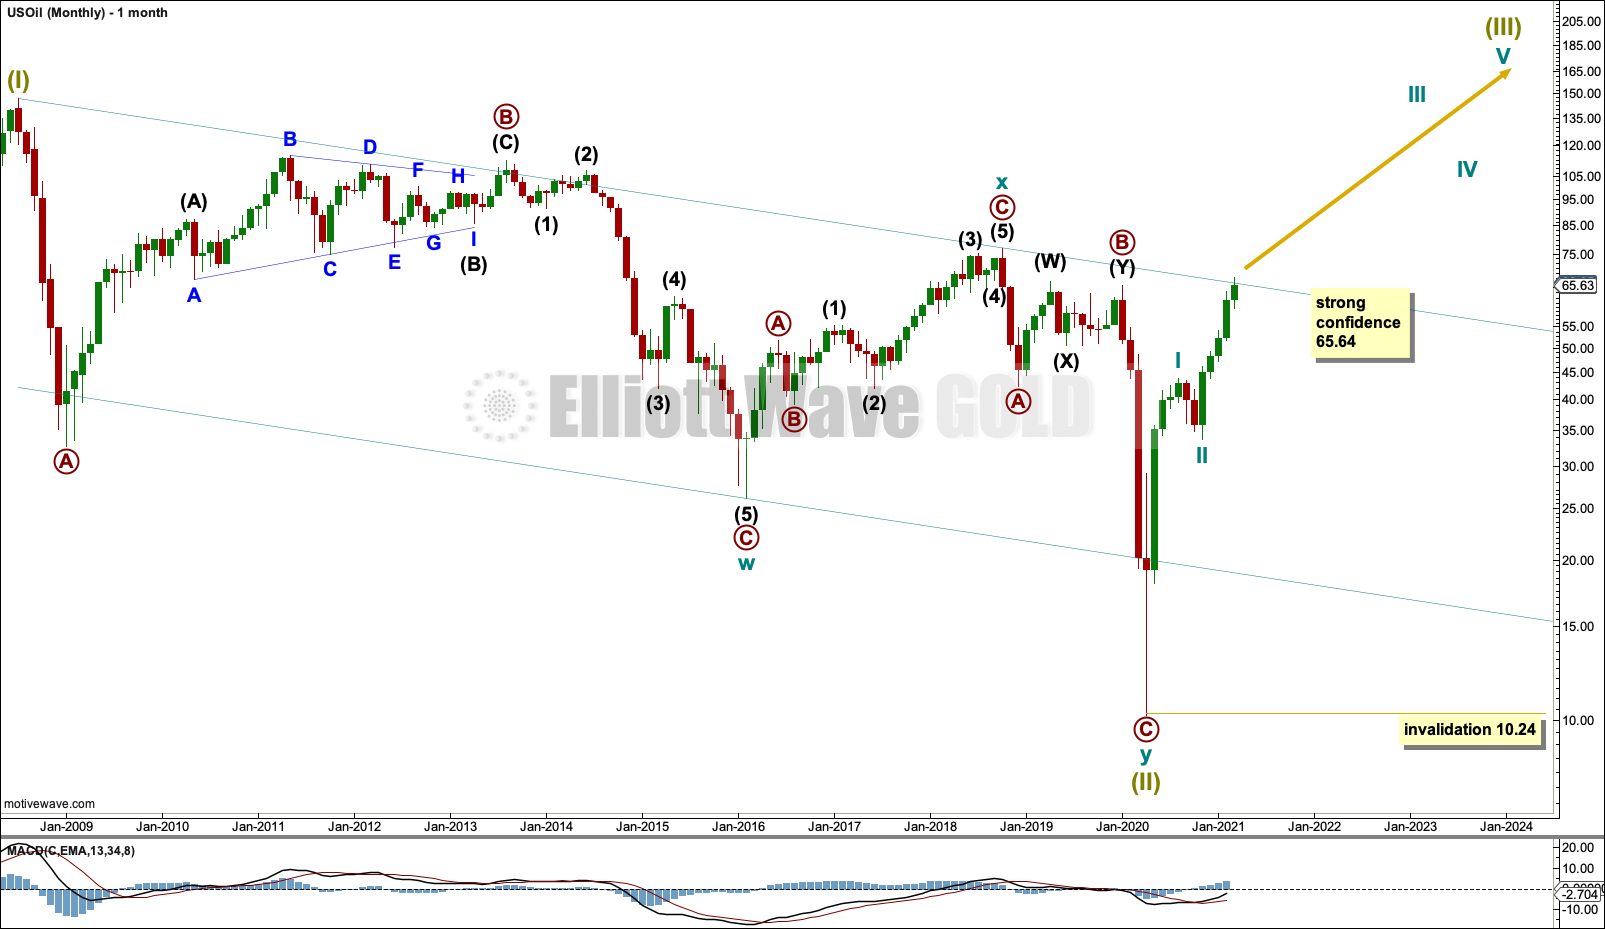
The basic Elliott wave structure is five steps forward and three steps back. This Elliott wave count expects that US Oil has completed a three steps back pattern, which began in July 2008. The Elliott wave count expects that the bear market for US Oil may now be over.
Following Super Cycle wave (II), which was a correction (three steps back), Super Cycle wave (III), which may have begun, should be five steps up when complete. Super Cycle wave (III) may last a generation and must make a new high above the end of Super Cycle wave (I) at 146.73.
A channel is drawn about Super Cycle wave (II): draw the first trend line from the start of cycle wave w to the end of cycle wave x, then place a parallel copy on the end of cycle wave w. This trend line is breached, which is a typical look for the end of a movement for a commodity.
The upper edge of the channel may provide resistance. If resistance is breached, then the upper edge may provide support for a back test. At the end of this week, price is reacting down from the upper edge of this channel.
Super Cycle wave (III) may only subdivide as a five wave impulse. New trends for Oil usually start out very slowly with short first waves and deep time consuming second wave corrections. However, while this is a common tendency, it is not always seen and may not have been seen in this instance. The first reasonably sized pullback may be over already.
WEEKLY CHART
Click chart to enlarge.
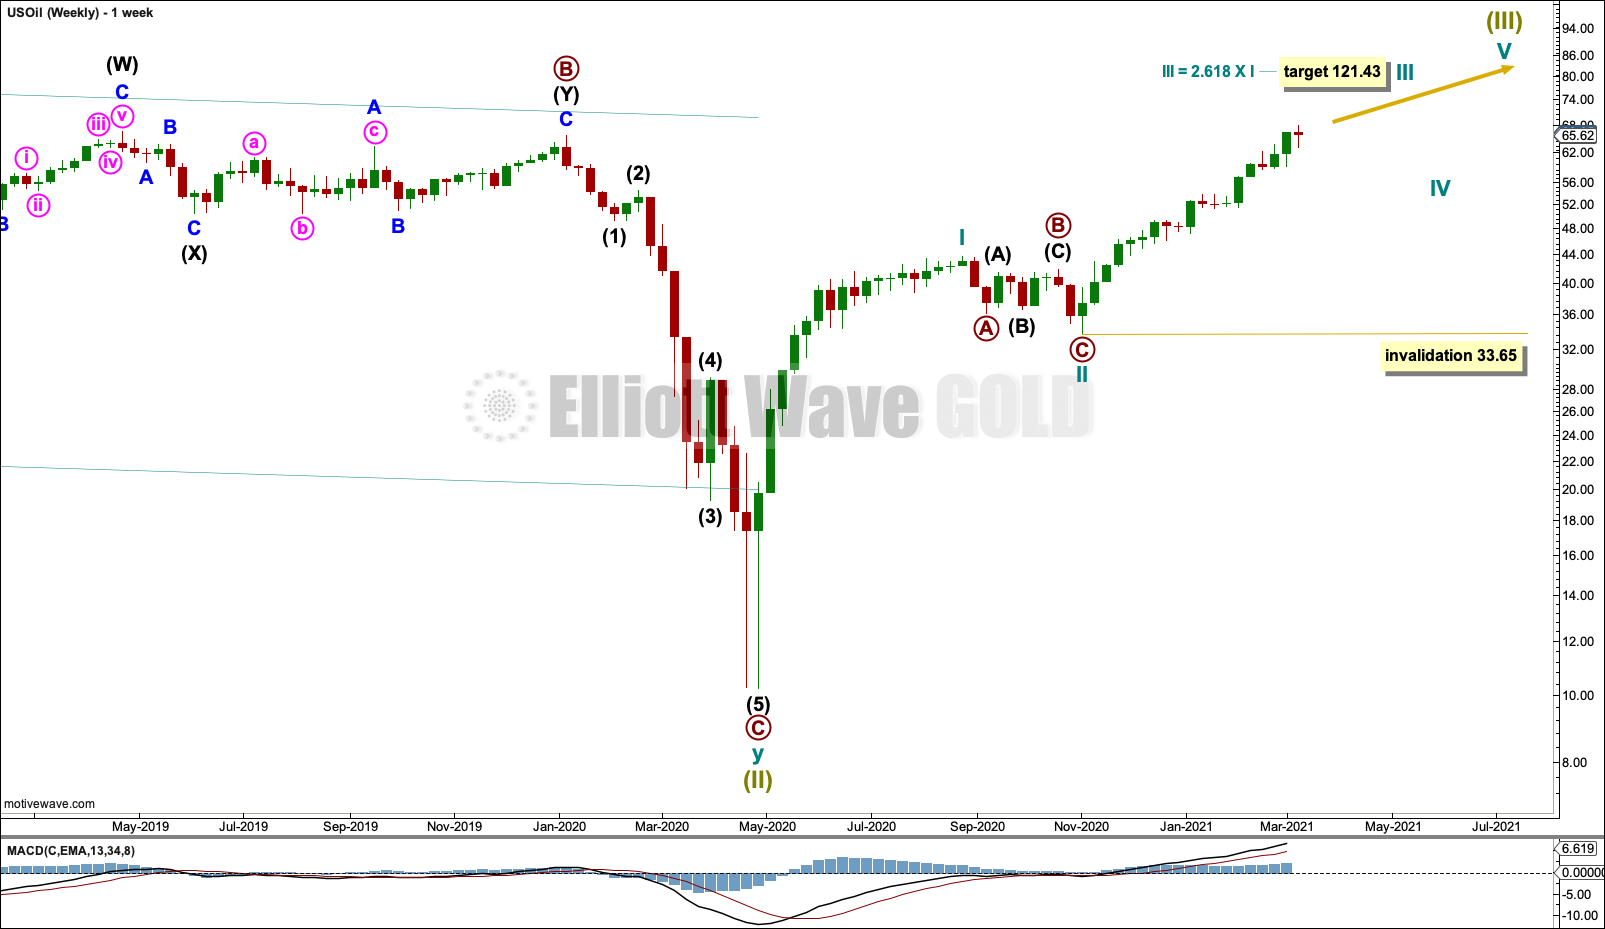
Super Cycle wave (III) must subdivide as an impulse. Cycle wave I within the impulse may be complete. Cycle wave II may also now be complete, and cycle wave III upwards may now have begun. If cycle wave II continues lower, then it may not move beyond the start of cycle wave I below 10.24.
There is only one daily chart following this main weekly chart. An alternate is presented below on a weekly chart.
DAILY CHART
Click chart to enlarge.
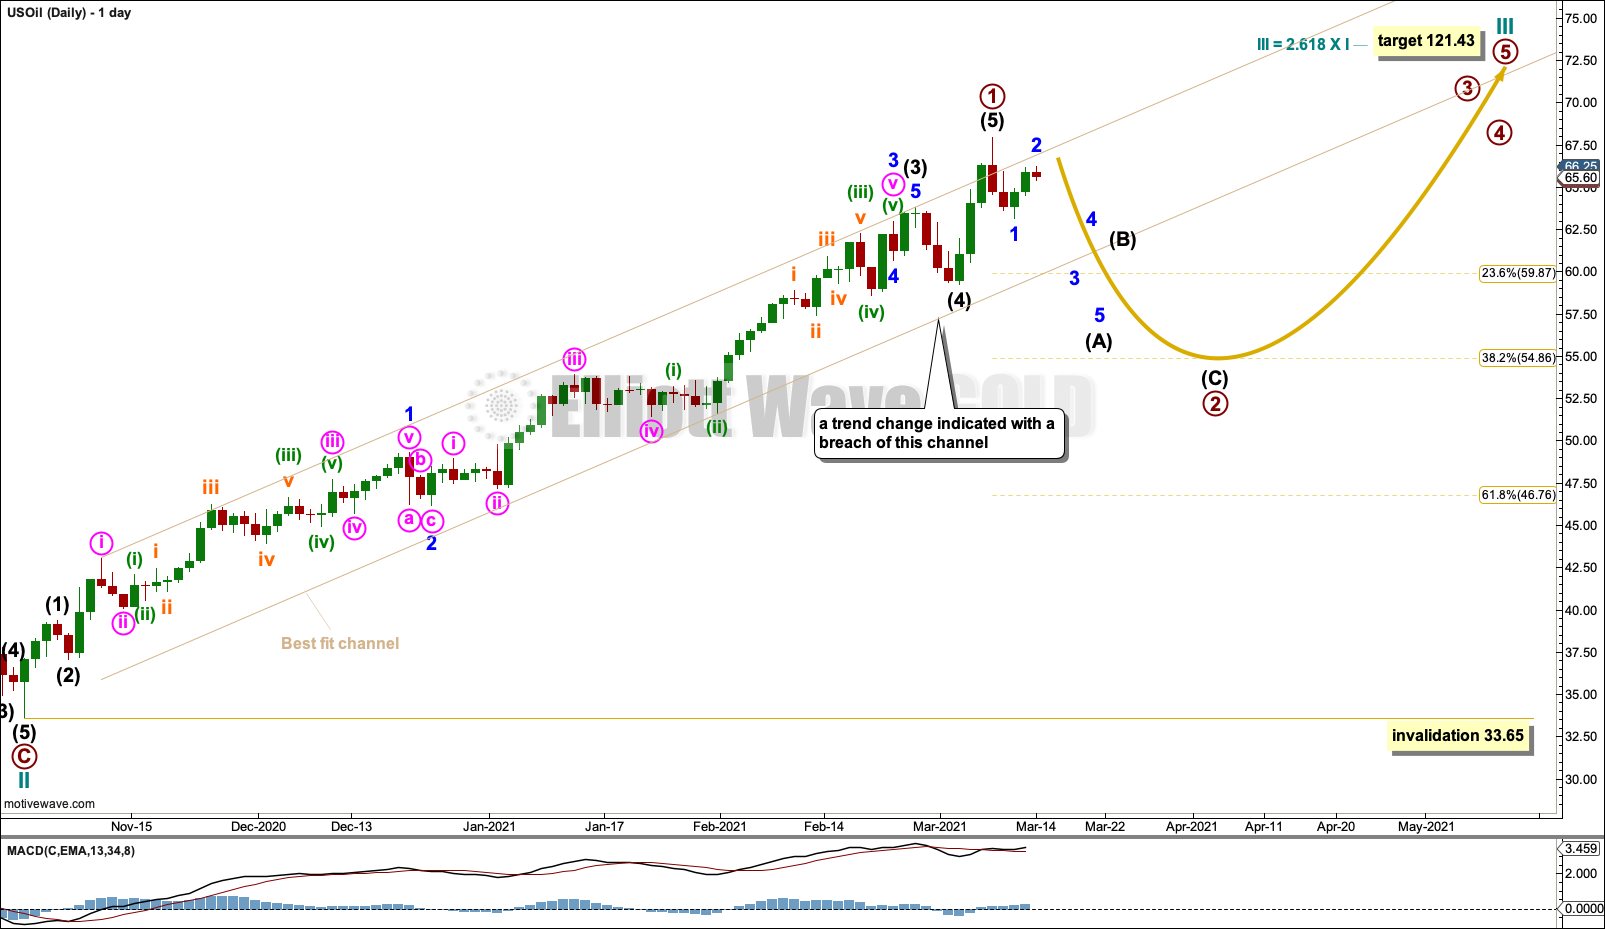
Cycle wave III may only subdivide as an impulse. Within the impulse: Primary wave 1 may again be complete, and primary wave 2 may not move beyond the start of primary wave 1 below 33.65.
The best fit channel contains almost all of primary wave 1. A breach of this channel by downwards movement would provide substantial confidence that primary wave 1 should be over and primary wave 2 should have arrived. The risk that primary wave 1 may continue higher will remain reasonable while price remains within this channel. If the channel is breached, then a short-term invalidation point may be set at the start of primary wave 2 at 67.97.
Primary wave 2 may be a multi-week pullback or consolidation.
ALTERNATE WEEKLY CHART
Click chart to enlarge.
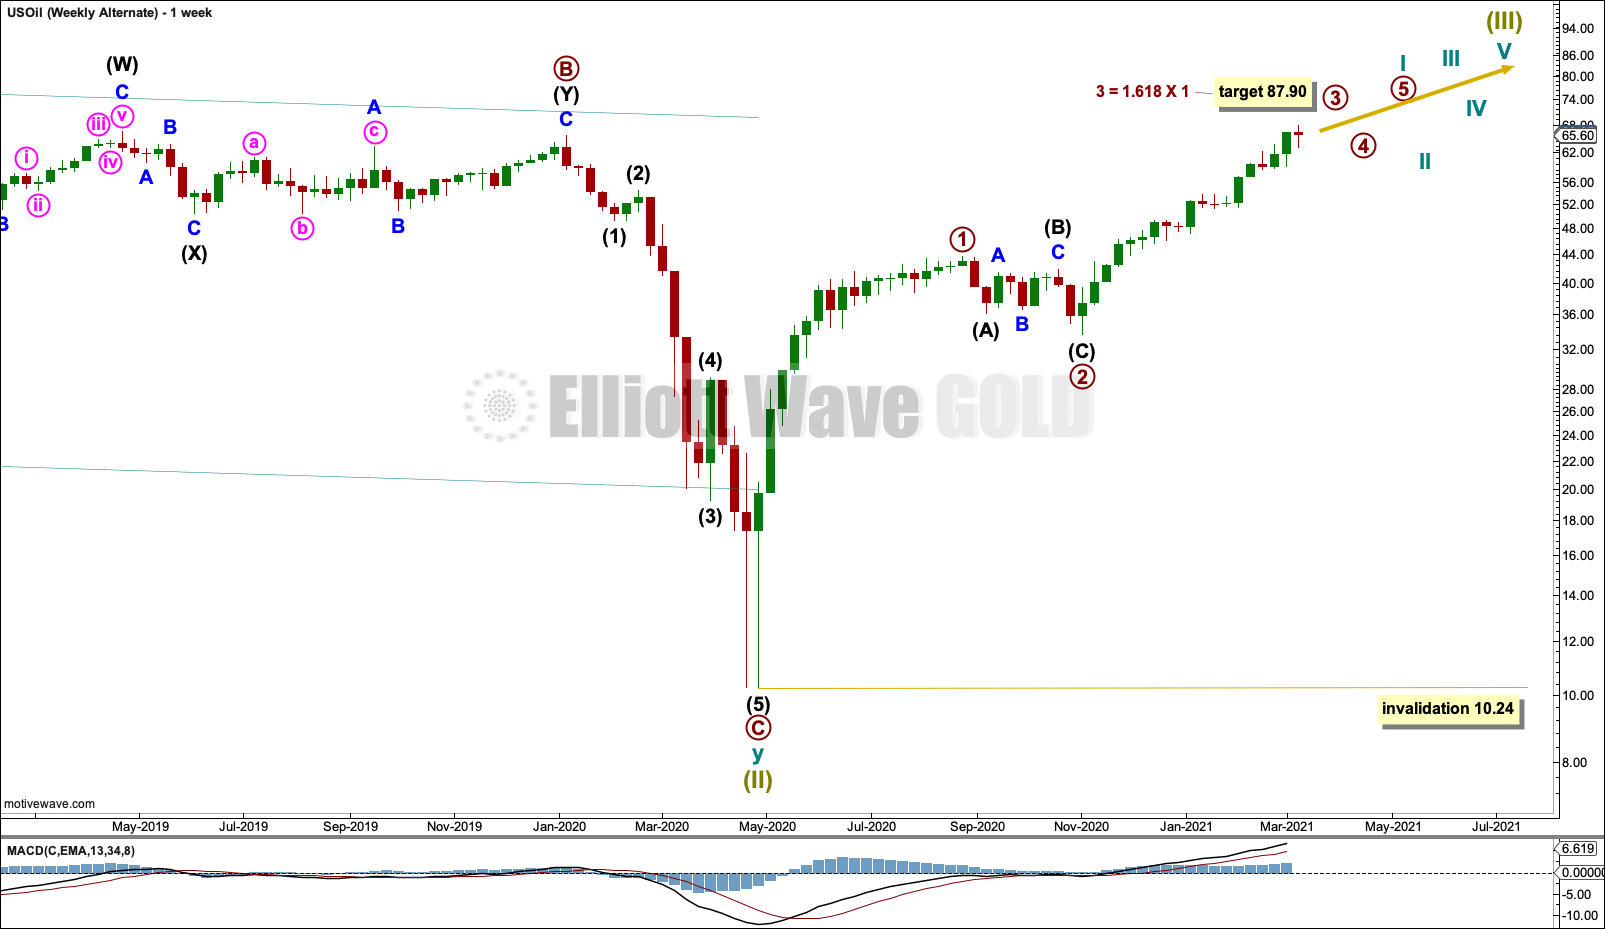
This alternate wave count moves the degree of labelling within the start of the bull market down one degree. It is possible that cycle wave I is incomplete.
The target for primary wave 3 is lower than the target on the first wave count.
A daily chart for this alternate would be the same as the daily chart for the main wave count, except the degree of labelling would be one degree lower. The channel would be the same.
TECHNICAL ANALYSIS
WEEKLY CHART
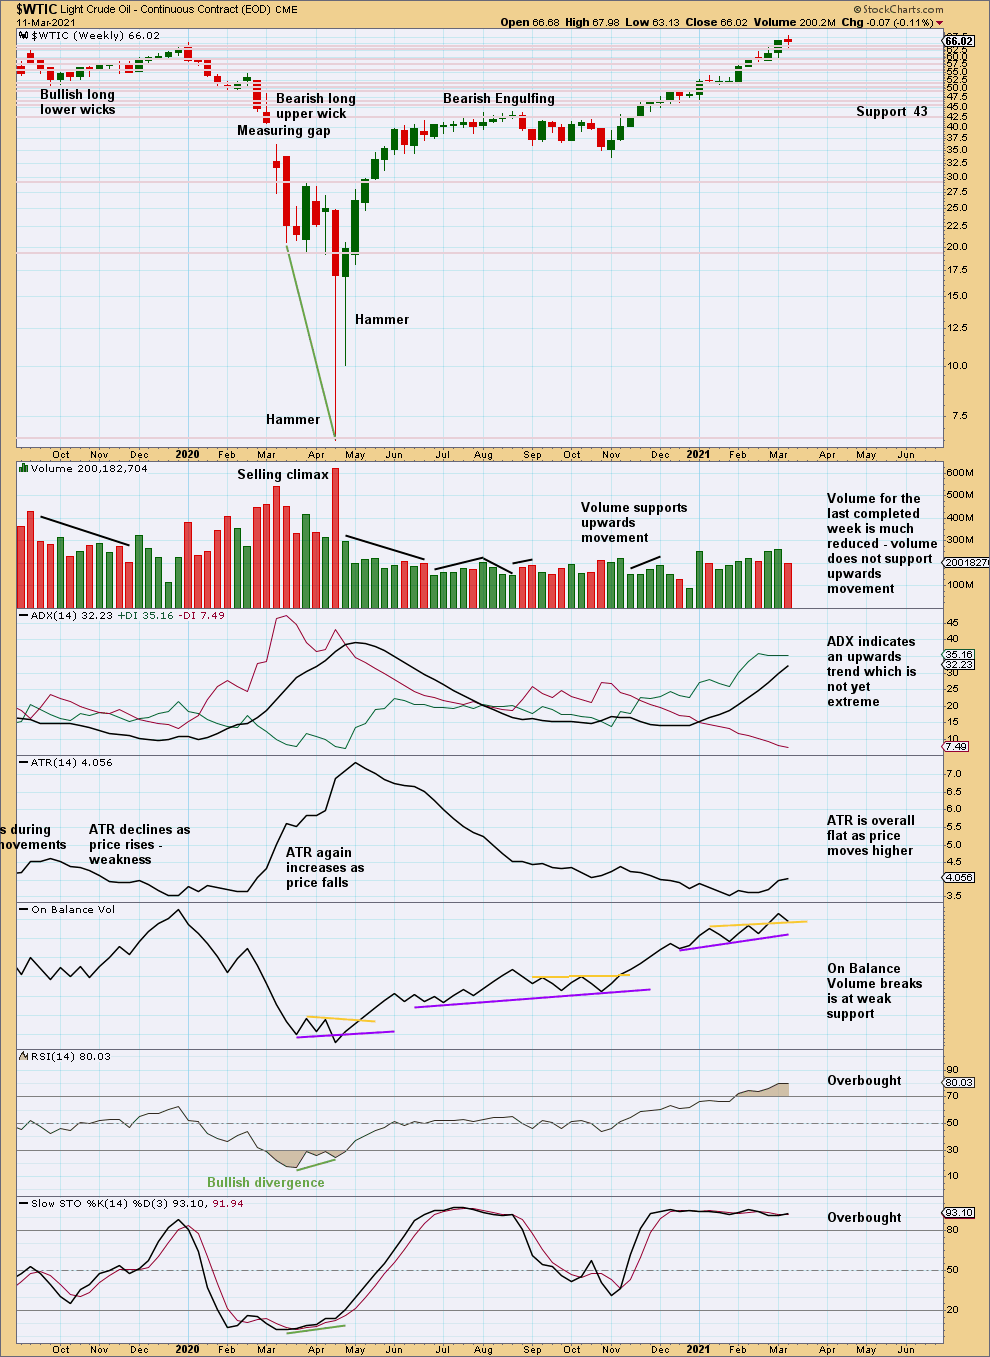
Click chart to enlarge. Chart courtesy of StockCharts.com.
Price is within a cluster of resistance and support; this may slow it down.
RSI this week remains overbought, but it may become more deeply overbought before a trend ends. ADX is still not extreme; there is room for this upwards trend to continue. This week a smaller range candlestick moves price higher but closes red with weak volume. This suggests some weakness this week in upwards movement.
DAILY CHART
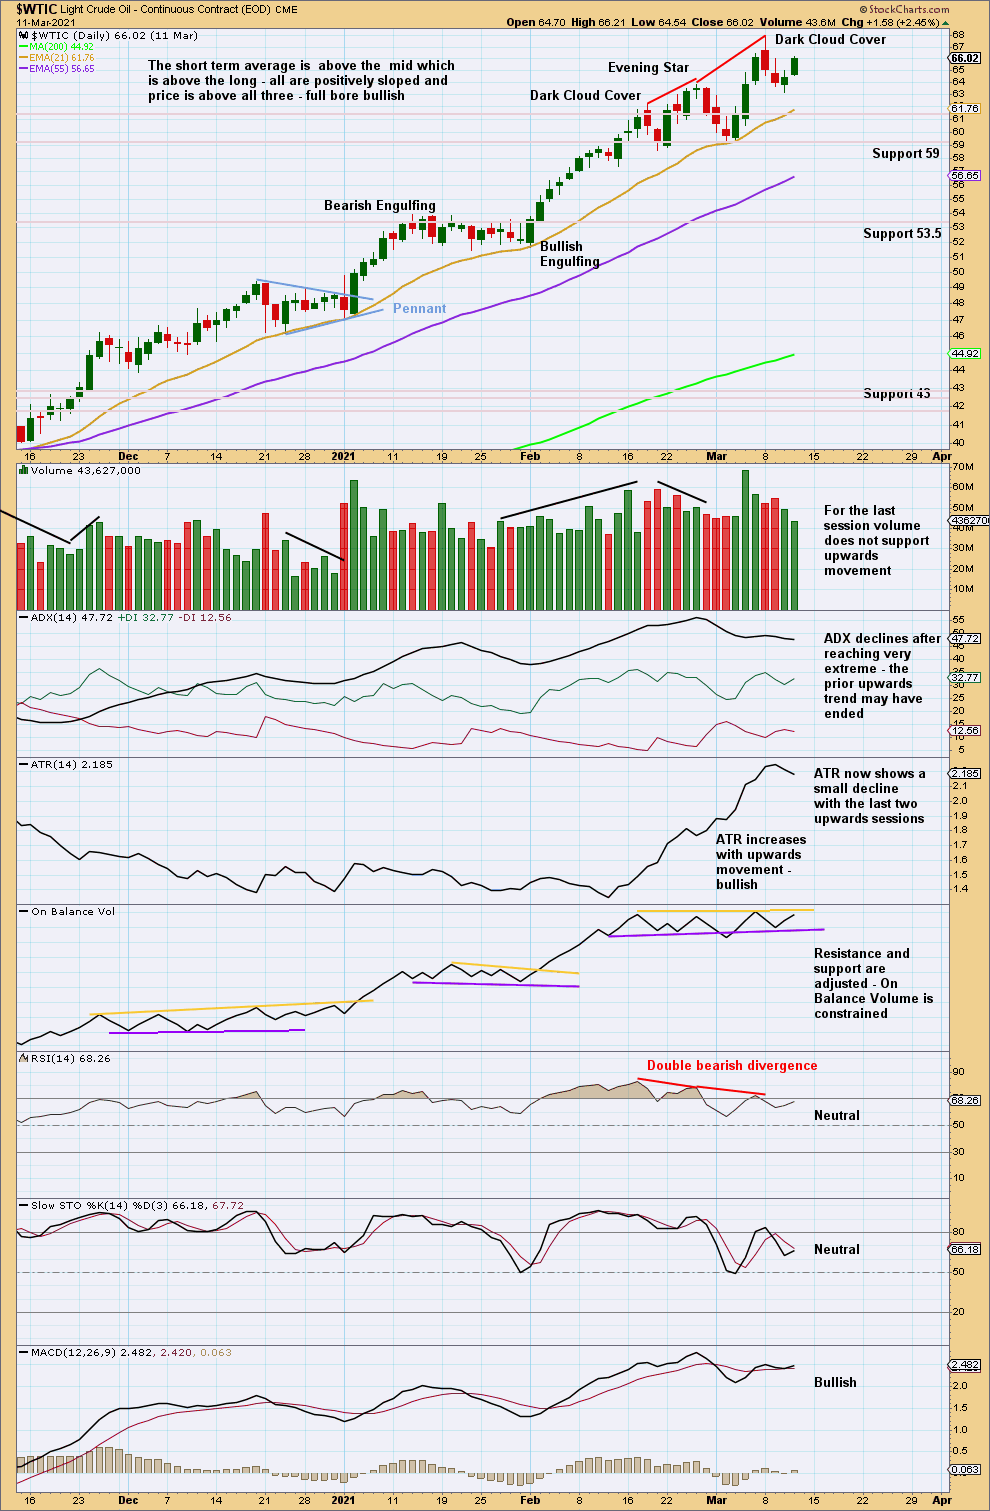
Click chart to enlarge. Chart courtesy of StockCharts.com.
At the daily chart level, this upwards trend reached very extreme and RSI reached overbought and there exhibited double bearish divergence. Now another bearish candlestick reversal pattern in Dark Cloud Cover suggests a trend change; the long upper wick on this candlestick reinforces this view. The trend is highly vulnerable to a reversal. A bearish candlestick should be given weight in these circumstances.
Published @ 05:33 p.m. ET.
—
Careful risk management protects your trading account(s).
Follow my two Golden Rules:
1. Always trade with stops.
2. Risk only 1-5% of equity on any one trade.
—
New updates to this analysis are in bold.