
US OIL: Elliott Wave and Technical Analysis | Charts – March 19, 2021
Downwards movement during the week is exactly what was expected.
Targets remain the same.
Summary: A pullback or consolidation may continue for several weeks. A first target is at 54.86. Thereafter, the next target is at 46.76 if price keeps falling.
A breach of the best fit channel adds confidence in a trend change and the start of a multi-week pullback or consolidation. This week a bearish Evening Star candlestick pattern on the weekly chart adds further confidence in the Elliott wave counts.
The larger trend remains up.
A longer-term target for a third wave is at 87.90 or 121.43.
Oil may have found a major sustainable low in April 2020.
ELLIOTT WAVE COUNT
MONTHLY CHART

Click chart to enlarge.
The basic Elliott wave structure is five steps forward and three steps back. This Elliott wave count expects that US Oil has completed a three steps back pattern, which began in July 2008. The Elliott wave count expects that the bear market for US Oil may now be over.
Following Super Cycle wave (II), which was a correction (three steps back), Super Cycle wave (III), which may have begun, should be five steps up when complete. Super Cycle wave (III) may last a generation and must make a new high above the end of Super Cycle wave (I) at 146.73.
A channel is drawn about Super Cycle wave (II): draw the first trend line from the start of cycle wave w to the end of cycle wave x, then place a parallel copy on the end of cycle wave w. This trend line is breached, which is a typical look for the end of a movement for a commodity.
The upper edge of the channel may provide resistance. Price is reacting down from the upper edge of this channel.
Super Cycle wave (III) may only subdivide as a five wave impulse. New trends for Oil usually start out very slowly with short first waves and deep time consuming second wave corrections. However, while this is a common tendency, it is not always seen and may not have been seen in this instance. The first reasonably sized pullback may be over already.
WEEKLY CHART
Click chart to enlarge.
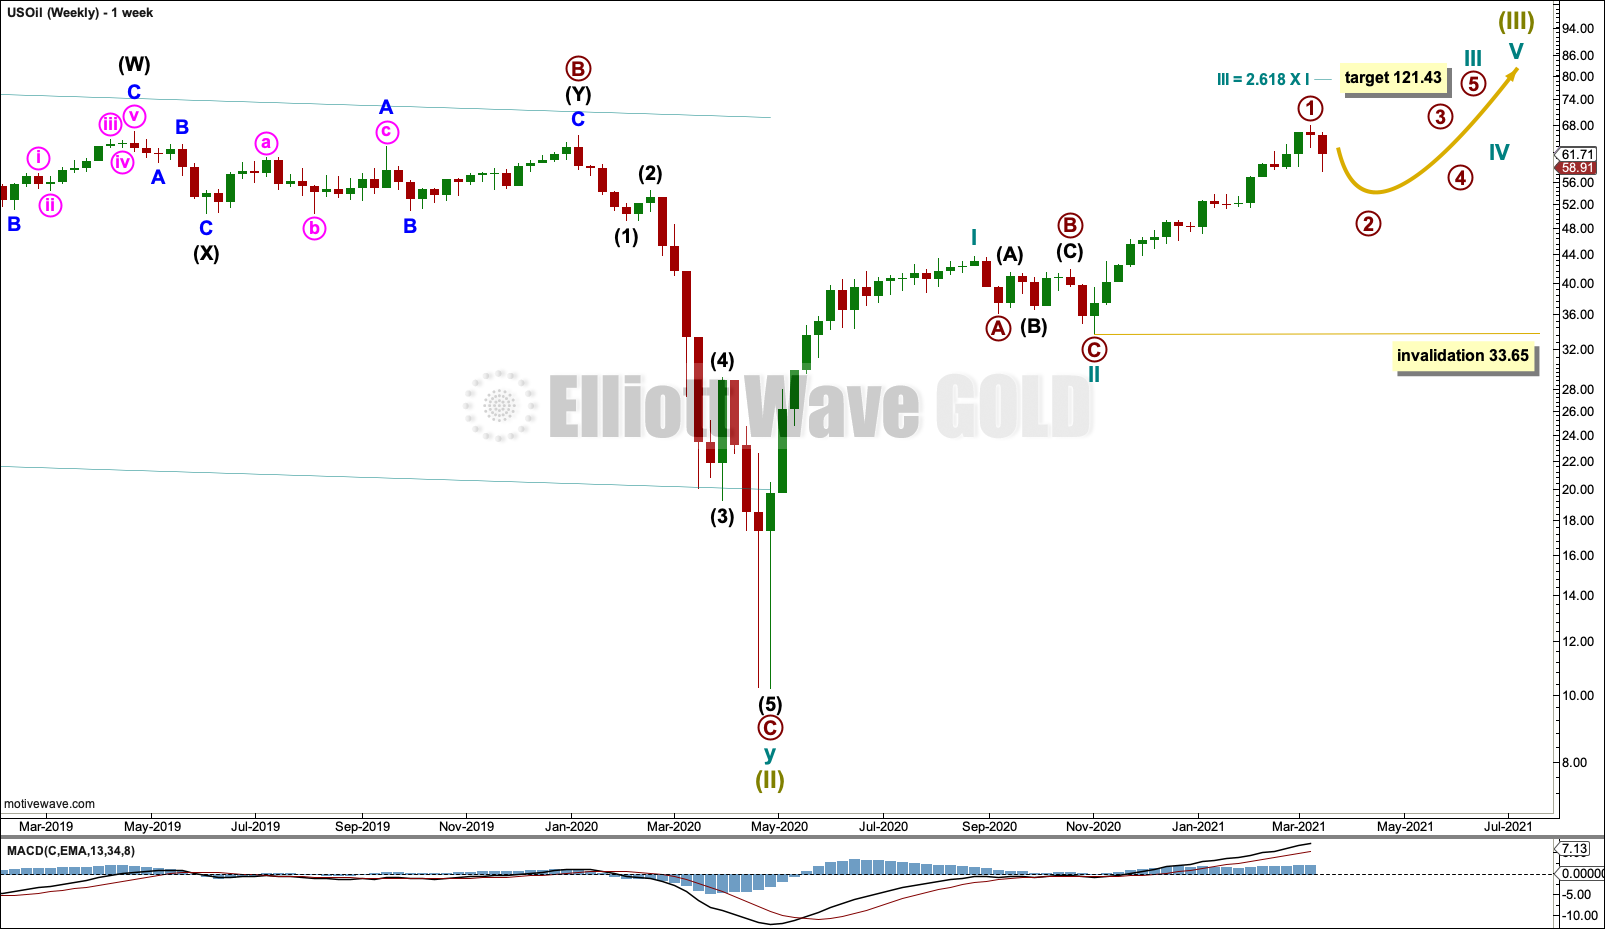
Super Cycle wave (III) must subdivide as an impulse. Cycle wave I within the impulse may be complete. Cycle wave II may also now be complete, and cycle wave III upwards may now have begun. If cycle wave II continues lower, then it may not move beyond the start of cycle wave I below 10.24.
There is only one daily chart following this main weekly chart. An alternate is presented below on a weekly chart.
DAILY CHART
Click chart to enlarge.
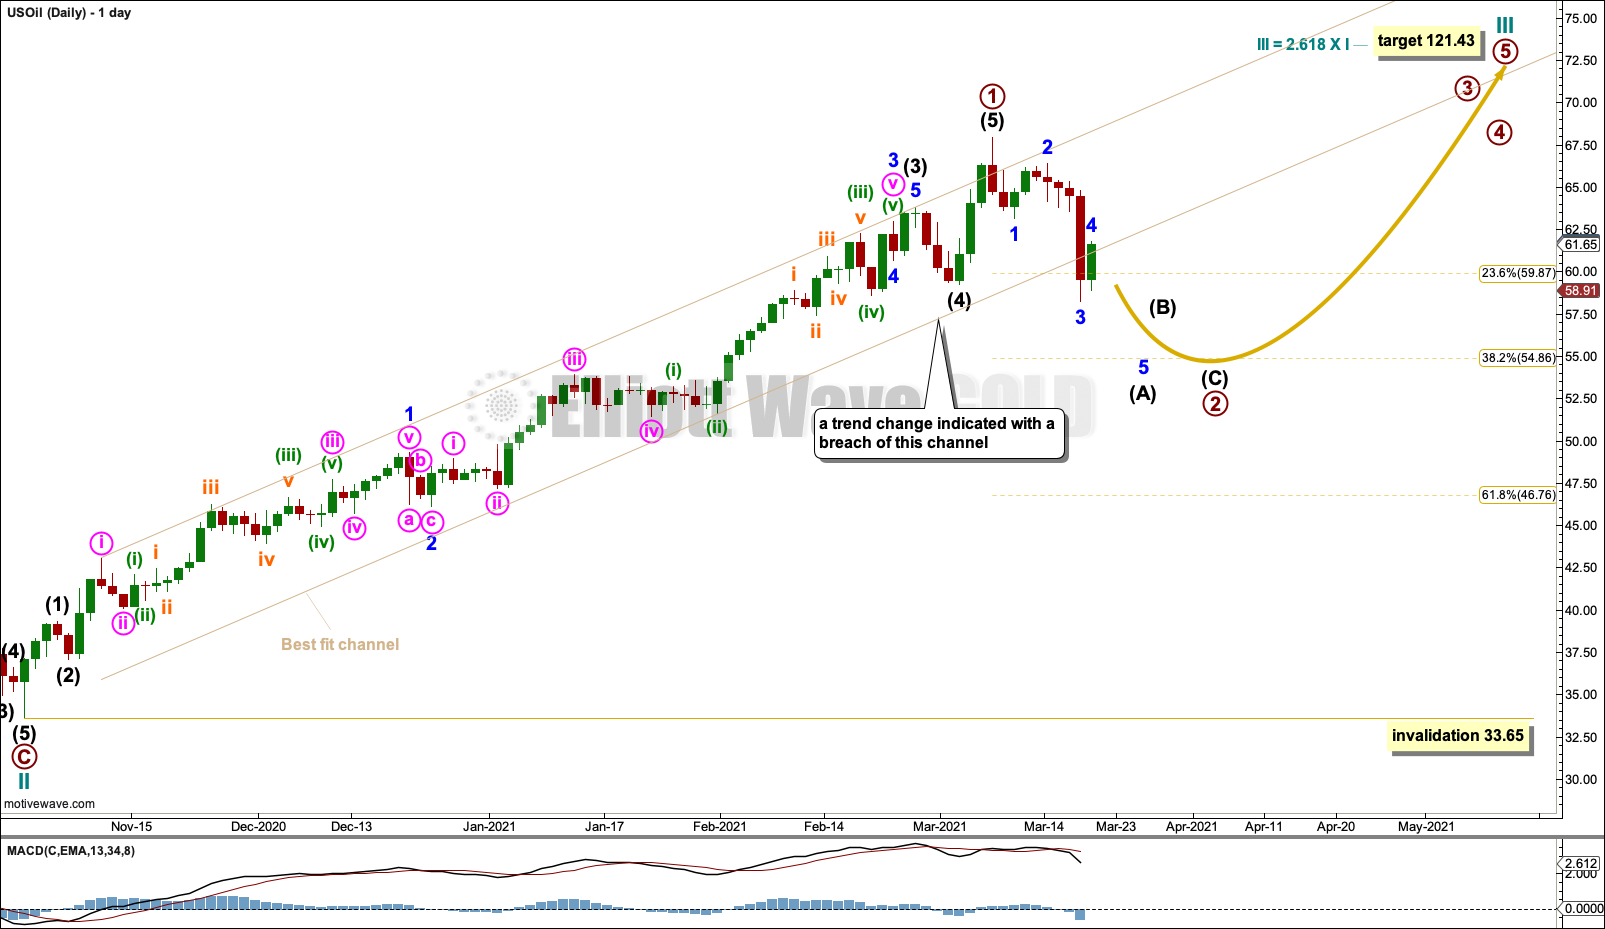
Cycle wave III may only subdivide as an impulse. Within the impulse: Primary wave 1 may be complete, and primary wave 2 may not move beyond the start of primary wave 1 below 33.65.
The best fit channel contains almost all of primary wave 1. A breach of this channel by downwards movement this week now provides confidence that primary wave 1 should be over and primary wave 2 should have arrived.
Primary wave 2 would most likely subdivide as a zigzag. Intermediate wave (A) within the zigzag may be an incomplete impulse. A bounce for minor wave 4 within intermediate wave (A) may not move into minor wave 1 price territory above 63.14. If this price point is breached in the short term, then intermediate wave (A) may be subdividing as a corrective structure.
Primary wave 2 may last weeks to months.
Labelling within primary wave 2 may change as it unfolds and alternate wave counts for the short-term structure may need to be considered. There are several different structures that primary wave 2 may unfold as.
Primary wave 2 may not move beyond the start of primary wave 1 below 33.65.
Primary wave 2 may be a multi-week pullback or consolidation.
ALTERNATE WEEKLY CHART
Click chart to enlarge.
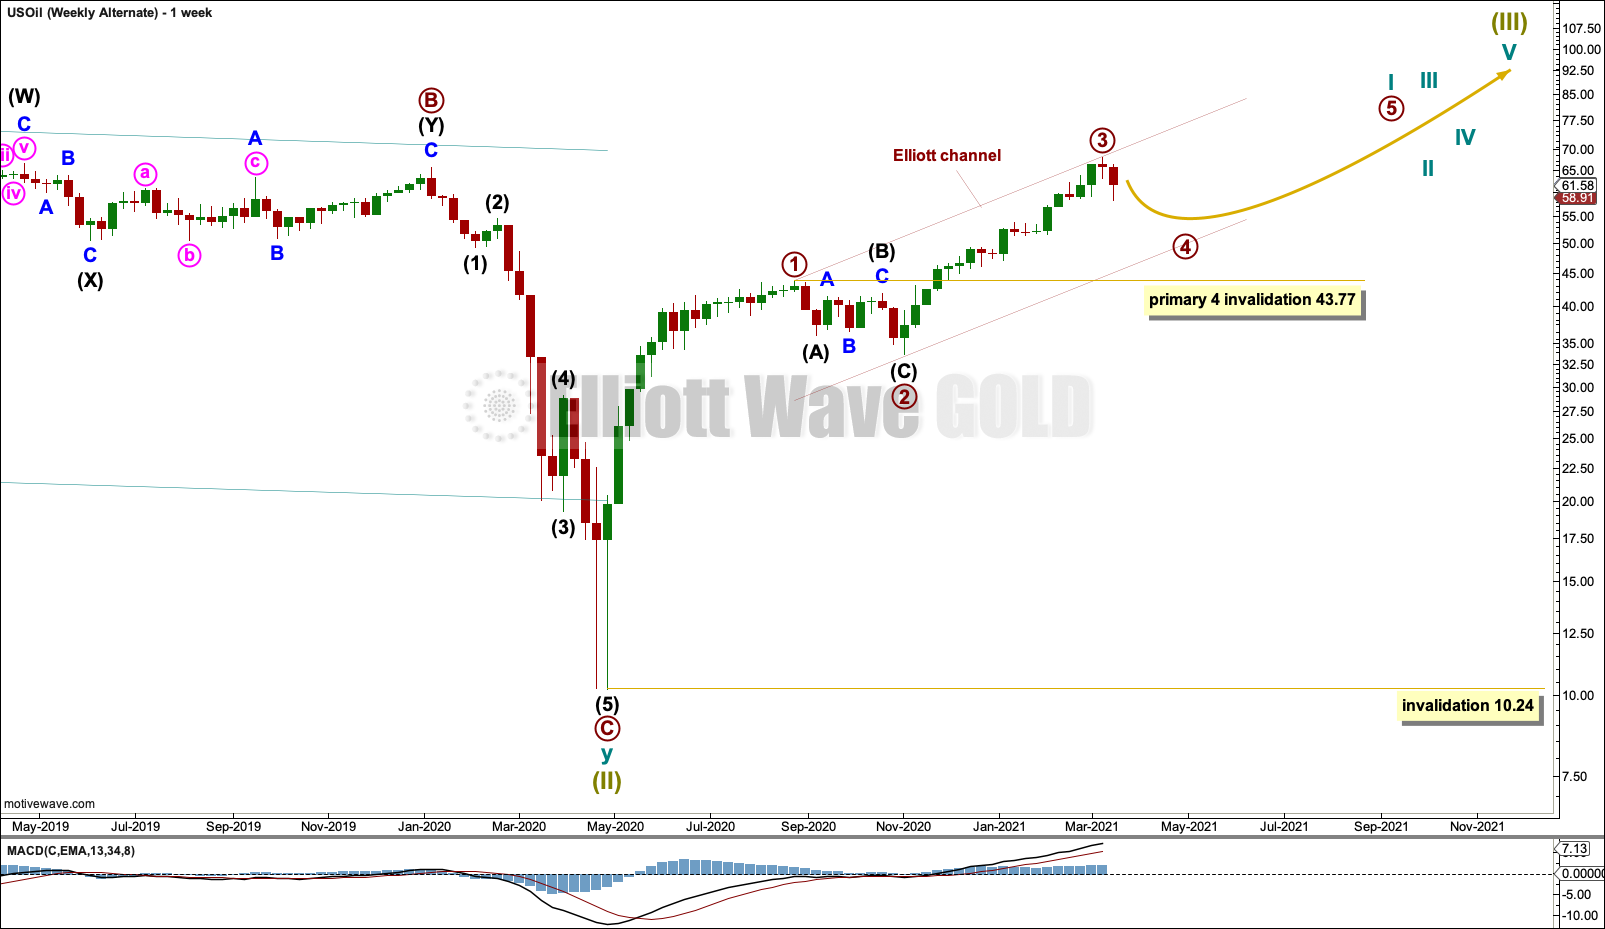
This alternate wave count moves the degree of labelling within the start of the bull market down one degree. It is possible that cycle wave I is incomplete.
Primary wave 3 may have ended at the last high. Primary wave 3 is close to equal in length with primary wave 1; it is 0.79 longer than primary wave 1.
Primary wave 4 may subdivide as any corrective structure. Primary wave 4 should last weeks to months. Primary wave 4 may not move into primary wave 1 price territory below 43.77.
A daily chart for this alternate would be the same as the daily chart for the main wave count, except the pullback would be labelled primary wave 4.
TECHNICAL ANALYSIS
WEEKLY CHART

Click chart to enlarge. Chart courtesy of StockCharts.com.
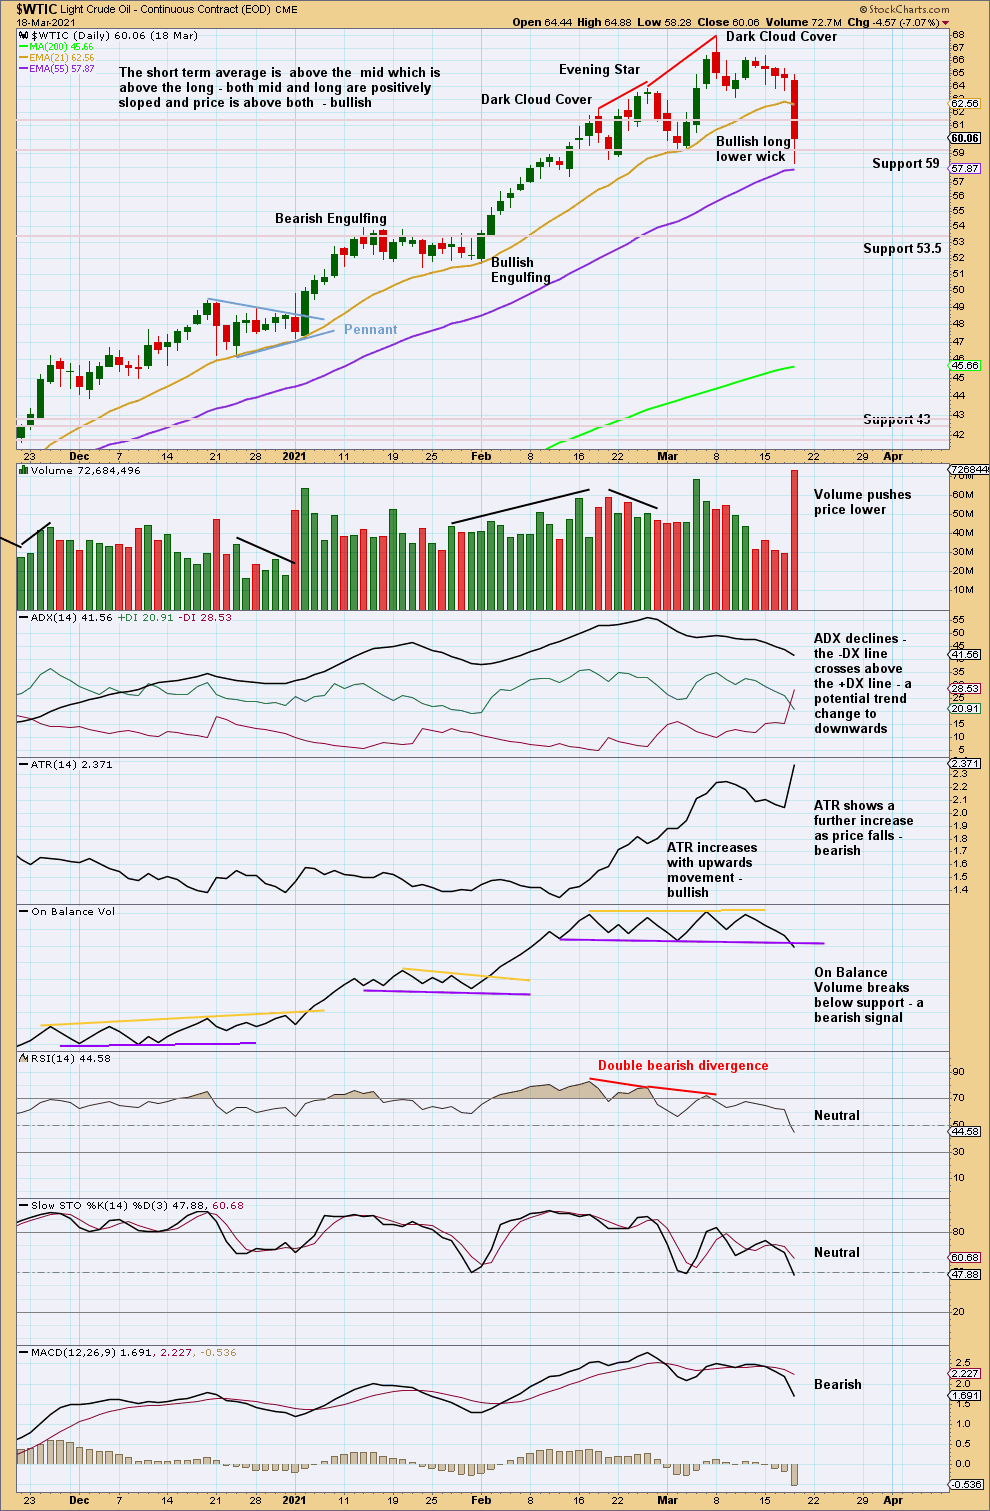
A bearish candlestick pattern on the weekly chart supports the Elliott wave counts.
ADX has now reached extreme. RSI reached extreme at the last high. Given extreme conditions a bearish candlestick pattern should be given weight. A multi-week to multi-month pullback is a reasonable expectation here.
DAILY CHART
Click chart to enlarge. Chart courtesy of StockCharts.com.
The prior extreme upwards trend may have now ended. A multi-week to multi-month pullback or consolidation may have begun. It may continue until RSI reaches extreme oversold.
For the short term, after a strong downwards session on Thursday, a bounce for Friday is now unfolding (not seen on this chart) and is a normal reaction to a strong session.
Published @ 06:30 p.m. ET.
—
Careful risk management protects your trading account(s).
Follow my two Golden Rules:
1. Always trade with stops.
2. Risk only 1-5% of equity on any one trade.
—
New updates to this analysis are in bold.