
GOLD: Elliott Wave and Technical Analysis | Grand Super Cycle Charts – April 6, 2021
Summary: The Grand Super Cycle analysis expects that it would be most likely that a Grand Super Cycle degree fourth wave continues to move lower from here to end about 657.
An alternate monthly chart considers the possibility that Grand Super Cycle wave IV was over at the low of 1,046.27 in December 2015.
GRAND SUPER CYCLE ANALYSIS
YEARLY CHART
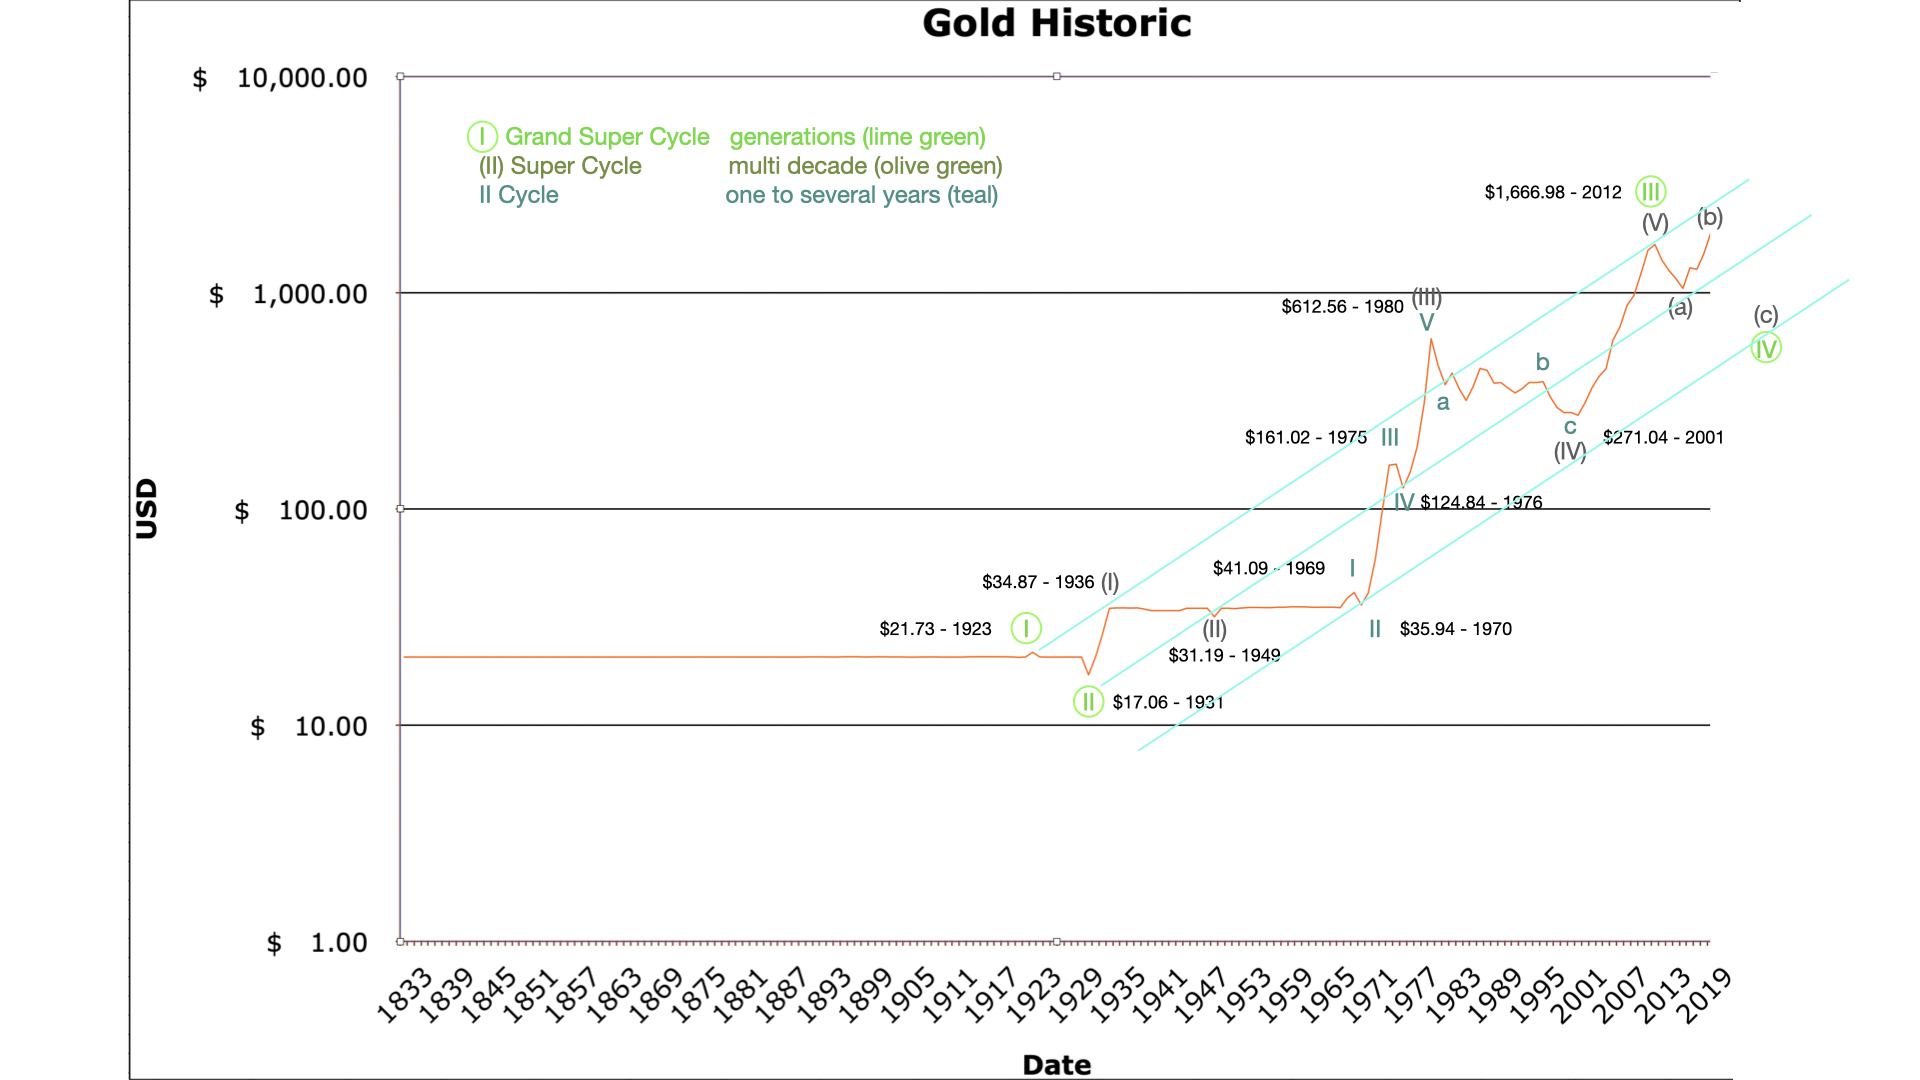
Click chart to enlarge.
Data used for the chart above is the closing price for the year. It does not include high / low. Note the chart scale is a logarithmic scale. Data on this chart is only from 1833 to 2020. Price action from the high in 2011 is analysed on the monthly charts below.
This wave count expects Gold is within a grand super cycle fourth wave correction. Super cycle wave IV may not move into grand super cycle wave I price territory below 21.73.
Grand super cycle wave III lasted from 1931 to 2012, 81 years. This is about one generation, so this duration looks about right.
Ratios within grand super cycle wave III are: super cycle wave (I) (17.81 in length) has no Fibonacci ratio to super cycle wave (III) (581.17 in length), and super cycle wave (V) (1,397.94 in length) is 123.56 short of 2.618 the length of super cycle wave (III), an 8.8% variation (I consider less than 10% an acceptable ratio).
Within grand super cycle wave III, super cycle wave (I) lasted a Fibonacci 5 years, super cycle wave (II) lasted a Fibonacci 13 years, super cycle wave (III) lasted 31 years, super cycle wave (IV) lasted a Fibonacci 21 years, and super cycle wave (V) lasted 11 years.
Ratios within super cycle wave (III) are: cycle wave III (125.05 in length) has no adequate Fibonacci ratio cycle wave I (9.70 in length), and cycle wave V (487.72 in length) is 41.99 short of 4.236 the length of cycle wave III, an 8.6% variation.
Within super cycle wave (III), cycle wave I lasted twenty years (just one short of a Fibonacci twenty-one), cycle wave II lasted a Fibonacci one year, cycle wave III lasted a Fibonacci five years, cycle wave IV lasted a Fibonacci one year, and cycle wave V lasted four years.
The cyan trend lines are a best fit only. This movement does not fit neatly into an Elliott channel, but then Gold’s impulses often do not due to their curved shape forced by a strong fifth wave.
If grand super cycle wave IV ends within the price territory of the fourth wave of one lesser degree, then it would reach down as low as 612.56 to 271.04. The target now calculated on the monthly chart below expects it to end just above this range.
A word about durations of corrective waves. Notice that corrective waves are usually quicker than the actionary waves they correct. Grand Super Cycle wave II lasted only eight years, but it corrected Grand Super Cycle wave I which may have lasted at least 50 years (from the Depression of the 1870’s to the early 1920’s).
Grand Super Cycle wave III lasted 81 years, but Grand Super Cycle wave IV does not have to be as long in duration. It may be over within a few years.
The guidelines given for durations of waves in this chart are rough guidelines only. Flexibility should be applied. Not only are corrective waves quicker than the actionary waves they correct, but when actionary waves extend in price they also extend in time pushing out these expectations, or for non extended waves compressing expectations.
FIRST MONTHLY CHART
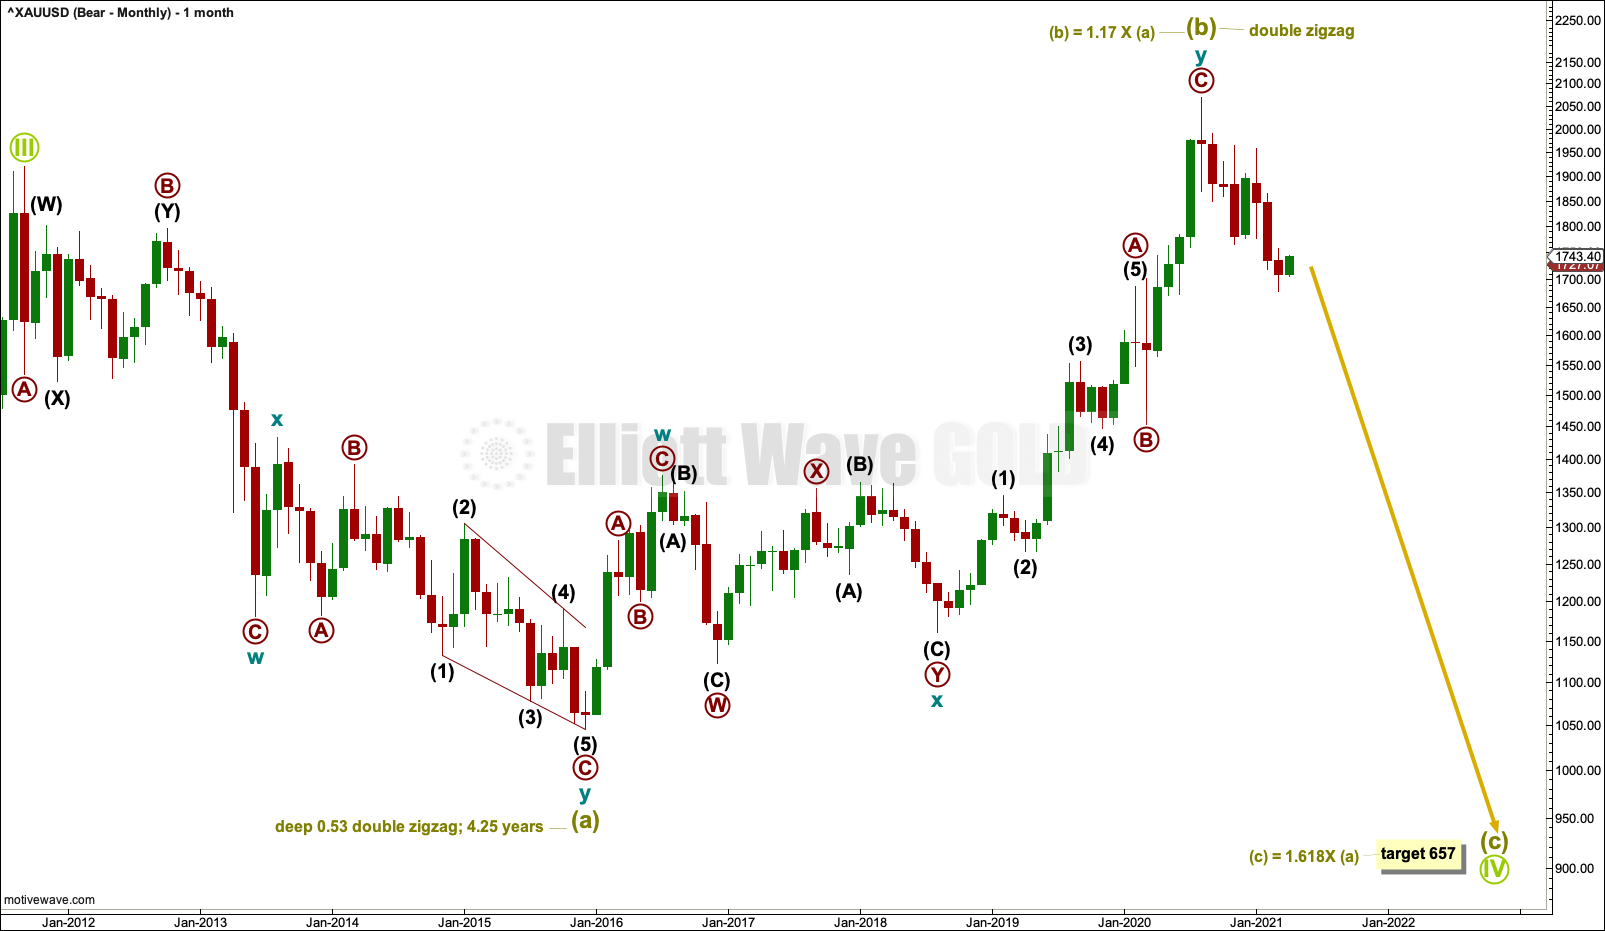
Click chart to enlarge.
It is possible to see the large downwards wave labelled Super Cycle wave (a) subdividing as a double zigzag, which is a corrective structure.
If Super Cycle wave (a) has subdivided as a double zigzag, then Grand Super Cycle wave IV may be unfolding as an expanded flat correction.
Expanded flat corrections are fairly common Elliott wave corrective structures, particularly in fourth wave positions. The common range for Super Cycle wave (b) within a flat correction would be from 1 to 1.38 times the length of Super Cycle wave (a) from 1,920.18 to 2,252.27. If Super Cycle wave (b) is over, then it is within this common range.
There is no Elliott wave rule stating a limit for Super Cycle wave (b) within a flat correction, so there is no rule to apply to determine an upper invalidation point for this wave count.
A target is now calculated for Super Cycle wave (c) that expects a common Fibonacci ratio to Super Cycle wave (a) within an expanded flat. Super Cycle wave (c) would be very likely to make at least a slight new low below the end of Super Cycle wave (a) at 1,046.27 to avoid a truncation and a very rare running flat.
SECOND ELLIOTT WAVE COUNT
MONTHLY CHART
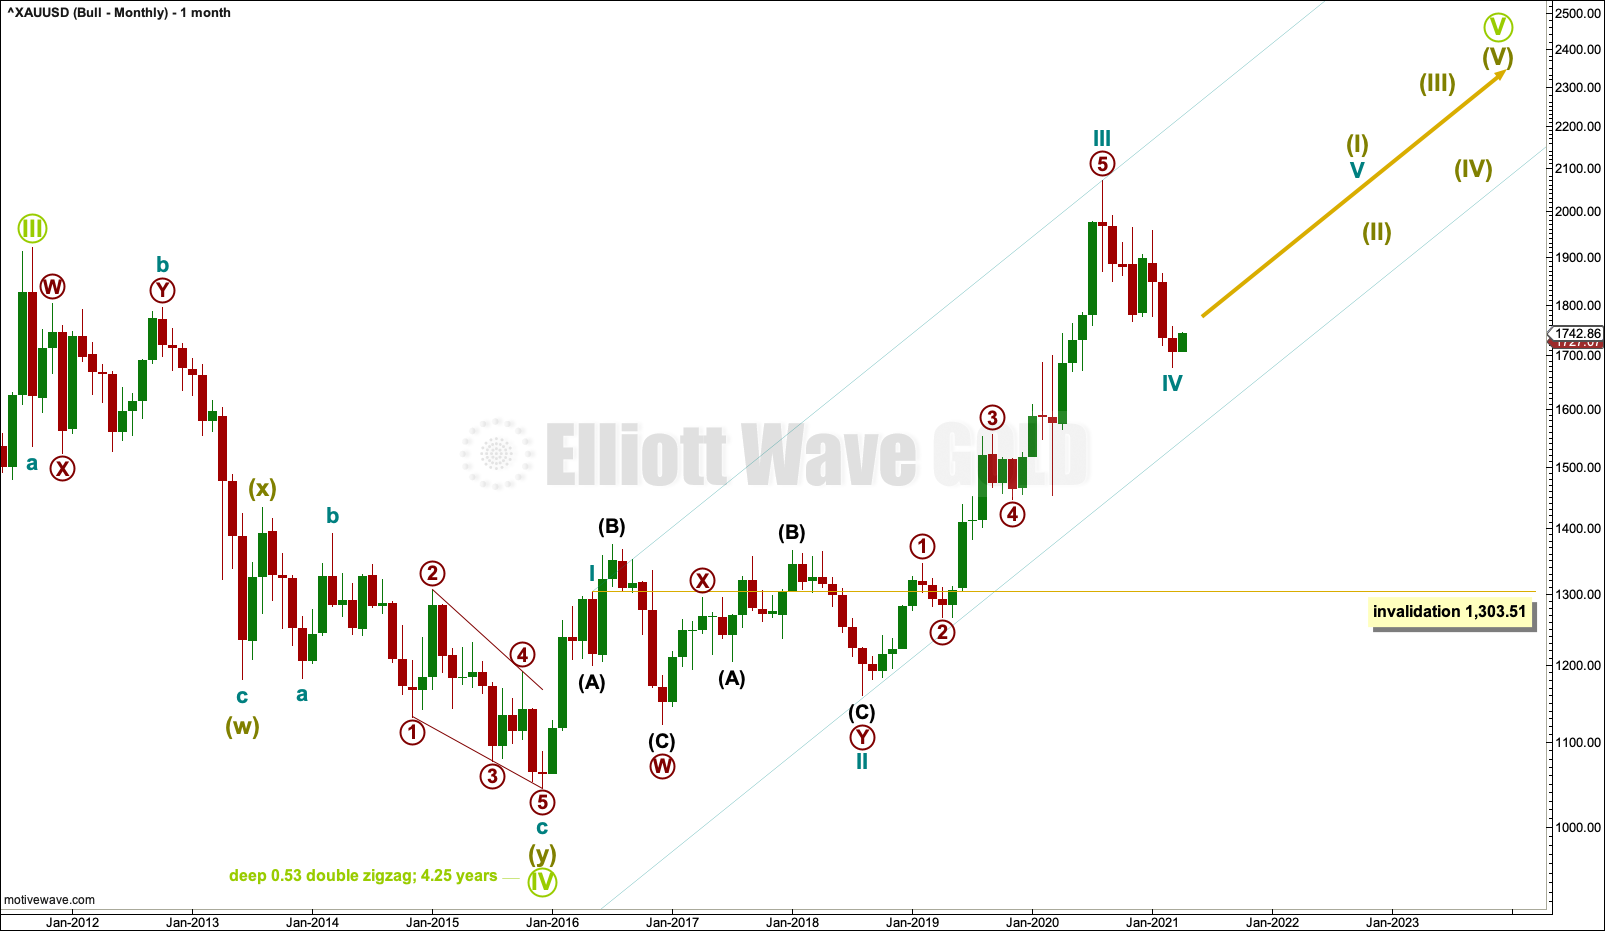
Click chart to enlarge.
This wave count sees the large downwards wave from September 2011 to December 2015 as having the same subdivisions as the prior chart above, a double zigzag, but it moves the degree of labelling within the double zigzag up one degree.
It is possible that the bear market for Gold was over at the low in December 2015 as a double zigzag. This would see Grand Super Cycle wave IV lasting only 4.25 years, where Grand Super Cycle waves may be normally expected to last at least a decade and possibly longer. The brevity of a Grand Super Cycle wave reduces the probability of this wave count.
If the bear market was over in December 2015, then a new bull market should have begun there. This is labelled Grand Super Cycle wave V.
Super Cycle wave (I) within Grand Super Cycle wave V would be incomplete and would be subdividing as a five wave impulse, the simplest Elliott wave structure. Cycle waves I through to IV within the impulse may now be complete. If it continues lower, then cycle wave IV may not move into cycle wave I price territory below 1,303.51.
TECHNICAL ANALYSIS
MONTHLY CHART
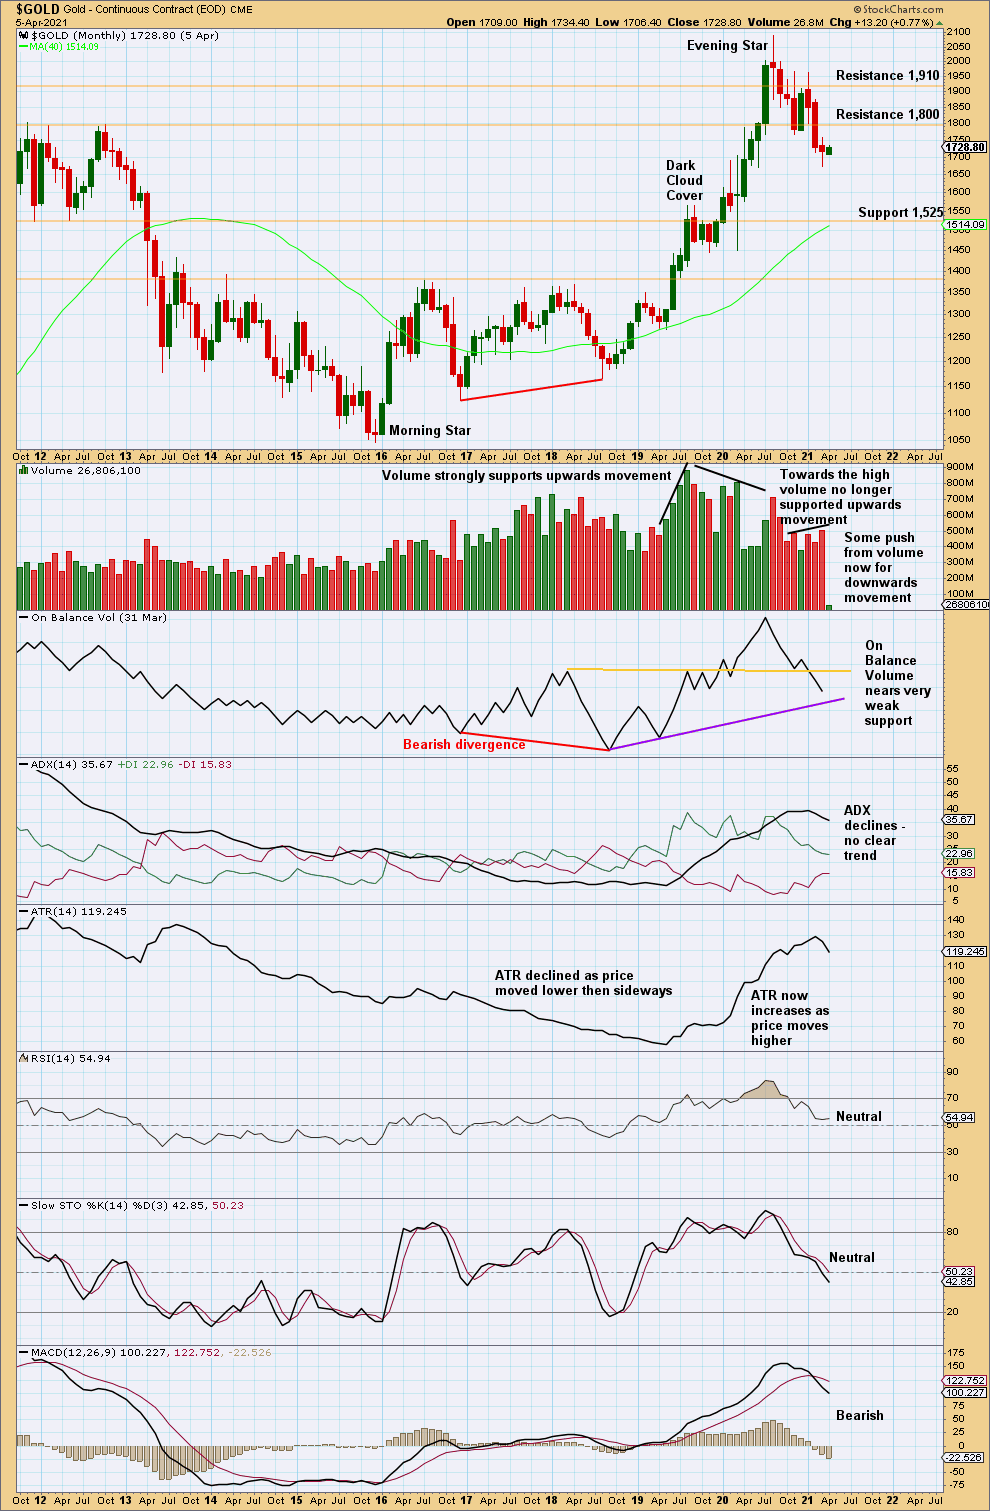
Click chart to enlarge. Chart courtesy of StockCharts.com.
There is a strong bearish candlestick pattern at the high.
For the short term, now price has some push lower from volume.
Published @ 03:09 p.m. ET.
—
Careful risk management protects your trading account(s).
Follow my two Golden Rules:
1. Always trade with stops.
2. Risk only 1-5% of equity on any one trade.
—
New updates to this analysis are in bold.