
GOLD: Elliott Wave and Technical Analysis | Charts – May 3, 2021
An upwards session with some support from volume sees the first Elliott wave count changed.
Both Elliott wave counts remain valid and price remains within a downwards sloping channel from August 2020.
Summary: For the short term, now both Elliott wave counts expect the same movement next: upwards movement to a target at 1,808 followed by a trend change. The bounce may find resistance at the upper edge of the cyan acceleration channel.
The first wave count then expects a downwards trend to new lows. The second wave count expects a deep second wave correction as a pullback within a bull market.
The first wave count is bearish for the bigger picture and classic technical analysis supports this view. This wave count expects a multi-year bear market may be in its early stages to end below 1,046.
A long-term target is at 657.
The second wave count is bullish. A new upwards wave may now have begun. The target is at 2,094.
Grand SuperCycle analysis and last monthly charts are here.
FIRST ELLIOTT WAVE COUNT
WEEKLY CHART
Click chart to enlarge.
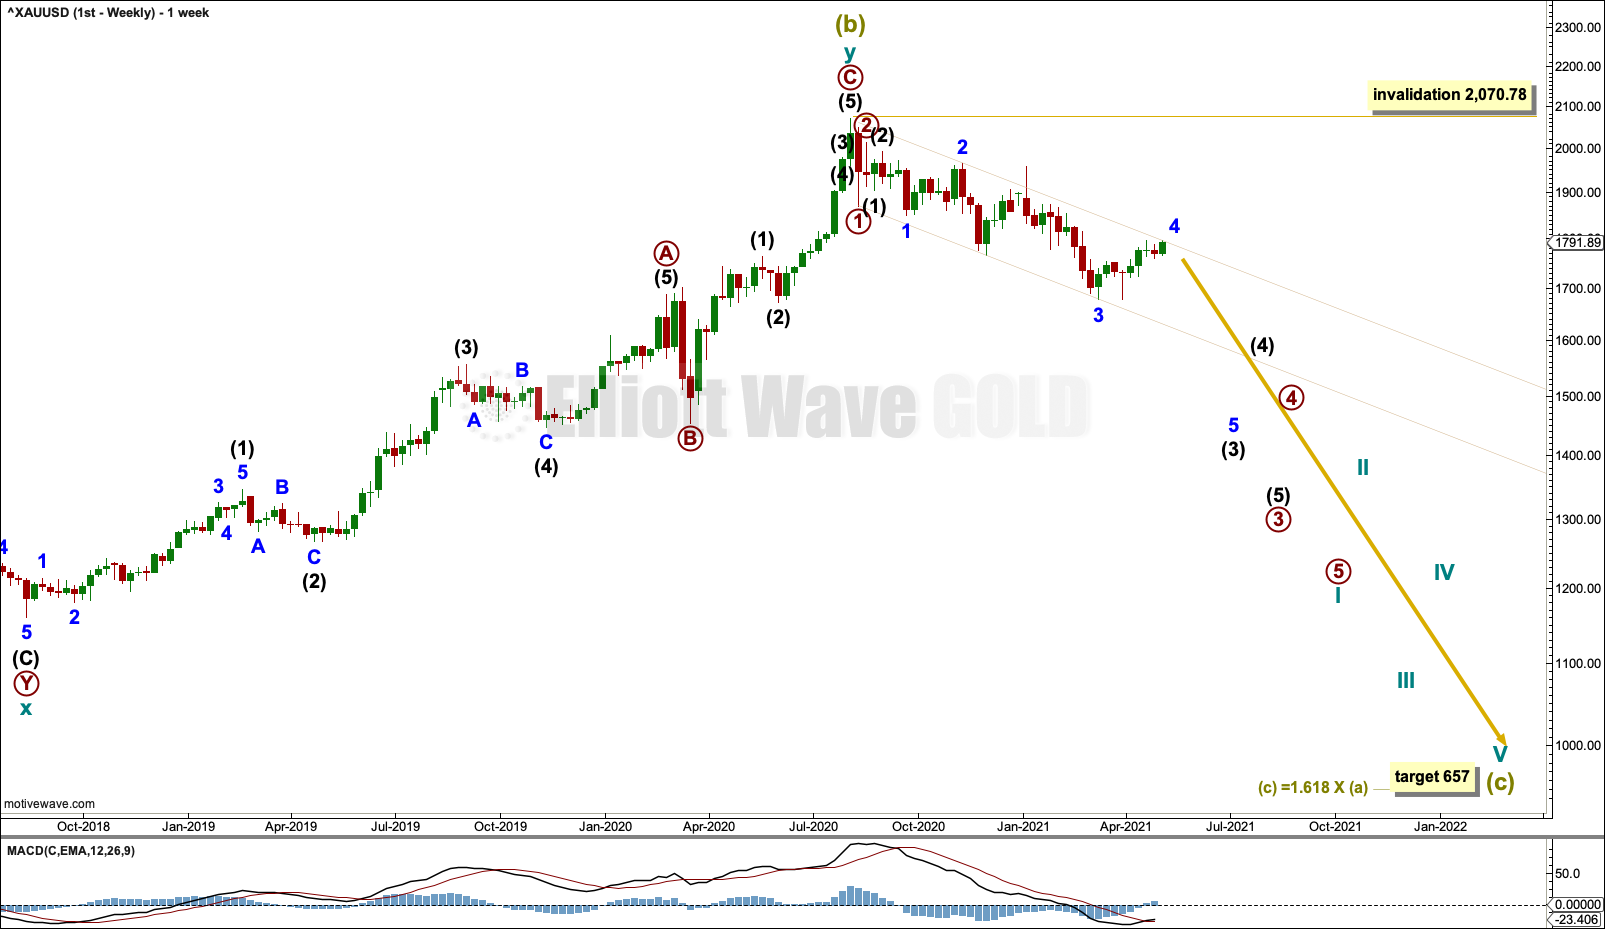
The bigger picture for this first Elliott wave count sees Gold as now within a bear market, in a three steps back pattern that is labelled Grand Super Cycle wave IV on monthly charts. Grand Super Cycle wave IV may be subdividing as an expanded flat pattern.
Super Cycle wave (b) within Grand Super Cycle wave IV may be a complete double zigzag. This wave count expects Super Cycle wave (c) to move price below the end of Super Cycle wave (a) at 1,046.27 to avoid a truncation and a very rare running flat. The target calculated expects a common Fibonacci ratio for Super Cycle wave (c).
DAILY CHART
Click chart to enlarge.
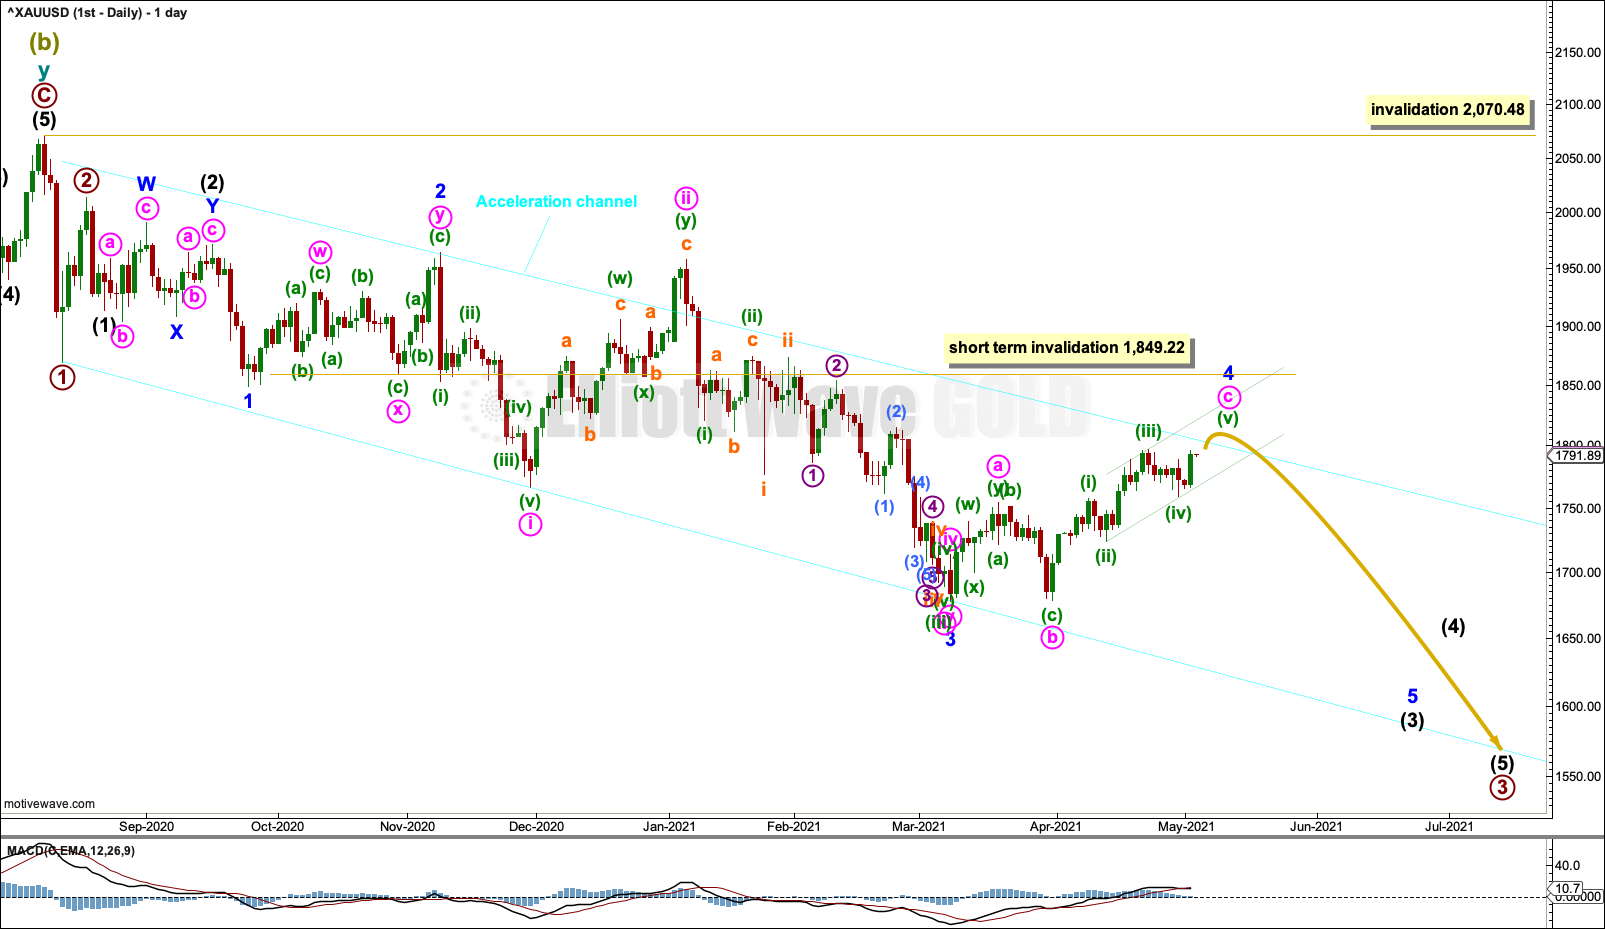
Within a new bear market, cycle wave I may be an incomplete five wave impulse.
Cycle wave II within the new downwards trend may not move beyond the start of cycle wave I above 2,070.48.
Gold typically exhibits extended and strong fifth waves; this tendency is especially prevalent for fifth waves to end third wave impulses one degree higher. One or both of minor wave 5 or intermediate wave (5) may exhibit this tendency; there may be one or more selling climaxes along the way down.
Draw an acceleration channel about downwards movement. Draw the first trend line from the end of primary wave 1 to the last low, then place a parallel copy on the end of primary wave 2. Keep redrawing the channel as price continues lower.
Minor wave 4 may be an incomplete flat. It may find resistance close to the upper edge of the cyan Acceleration channel.
Minor wave 4 may not move into minor wave 1 price territory above 1,849.22.
Redraw the channel about minute wave c of minor wave 4 using Elliott’s second technique. Draw the first trend line from the ends of minuette waves (ii) to (iv), then place a parallel copy on the end of minuette wave (iii). Minuette wave (v) may end mid way within this channel. When the channel is breached by subsequent downwards movement, then that may be an indication that the bounce may be over.
HOURLY CHART
Click chart to enlarge.
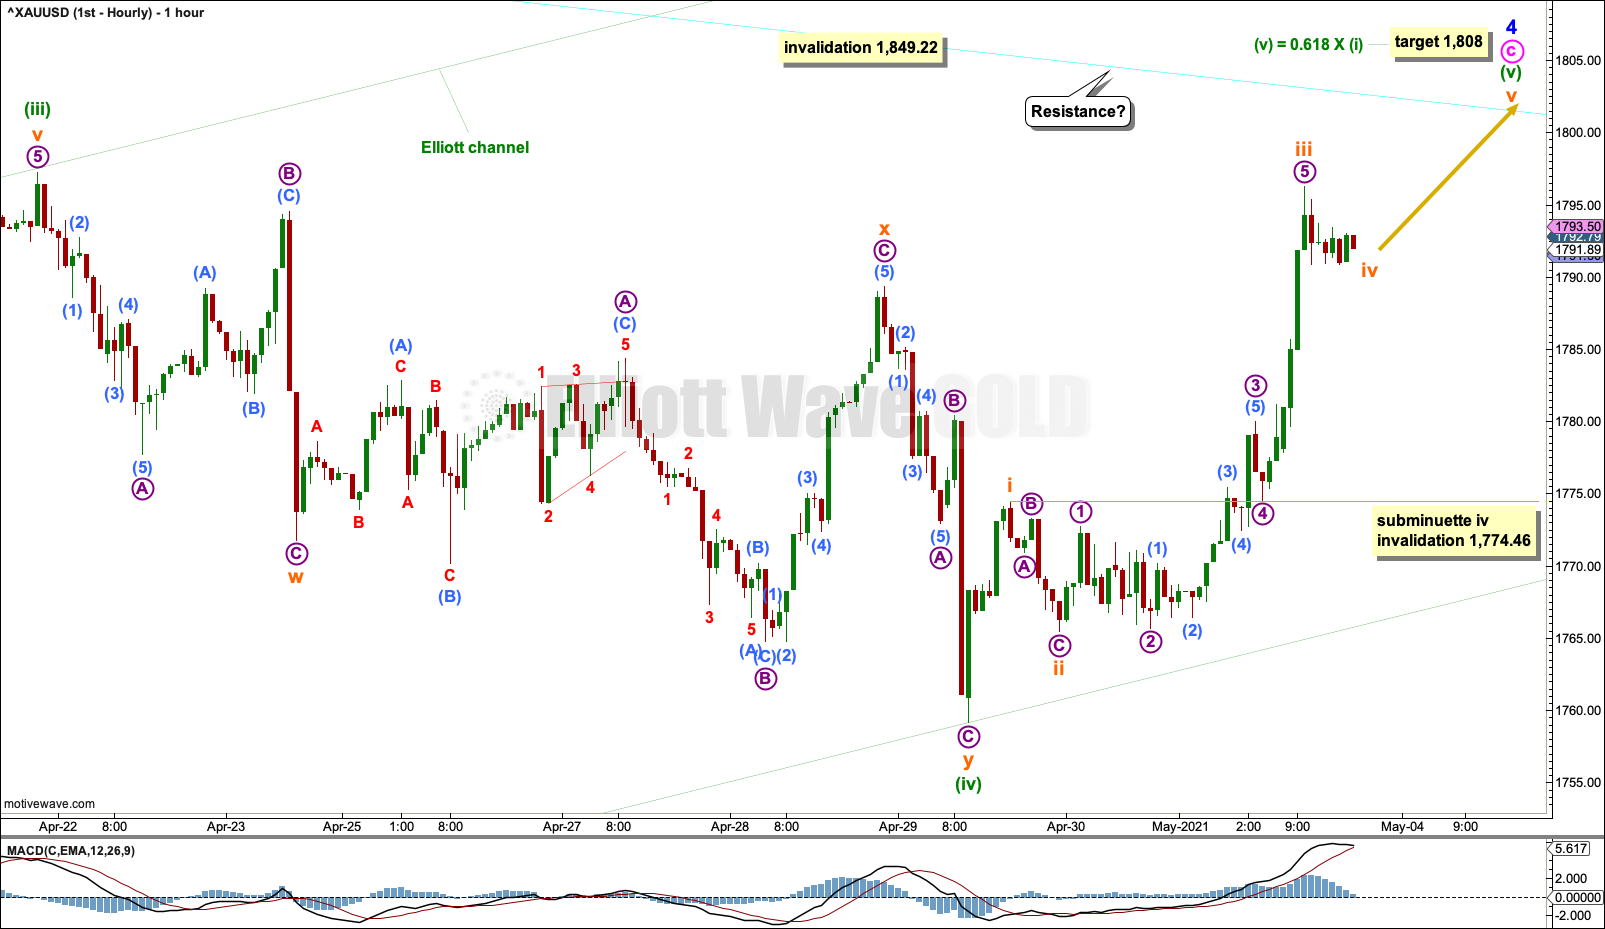
Minute wave c within minor wave 4 may be incomplete. The last downwards movement may have been minuette wave (iv) within minute wave c. This fits perfectly as a double zigzag.
A target is calculated for minute wave c to end. If this target is wrong, then it may be a little too high. Price may find resistance at the upper edge of the cyan Acceleration channel, which is copied over from the daily chart.
Subminuette wave iv within minuette wave (v) may not move into subminuette wave i price territory below 1,774.46.
Minor wave 4 may not move into minor wave 1 price territory above 1,849.22.
SECOND ELLIOTT WAVE COUNT
WEEKLY CHART
Click chart to enlarge.
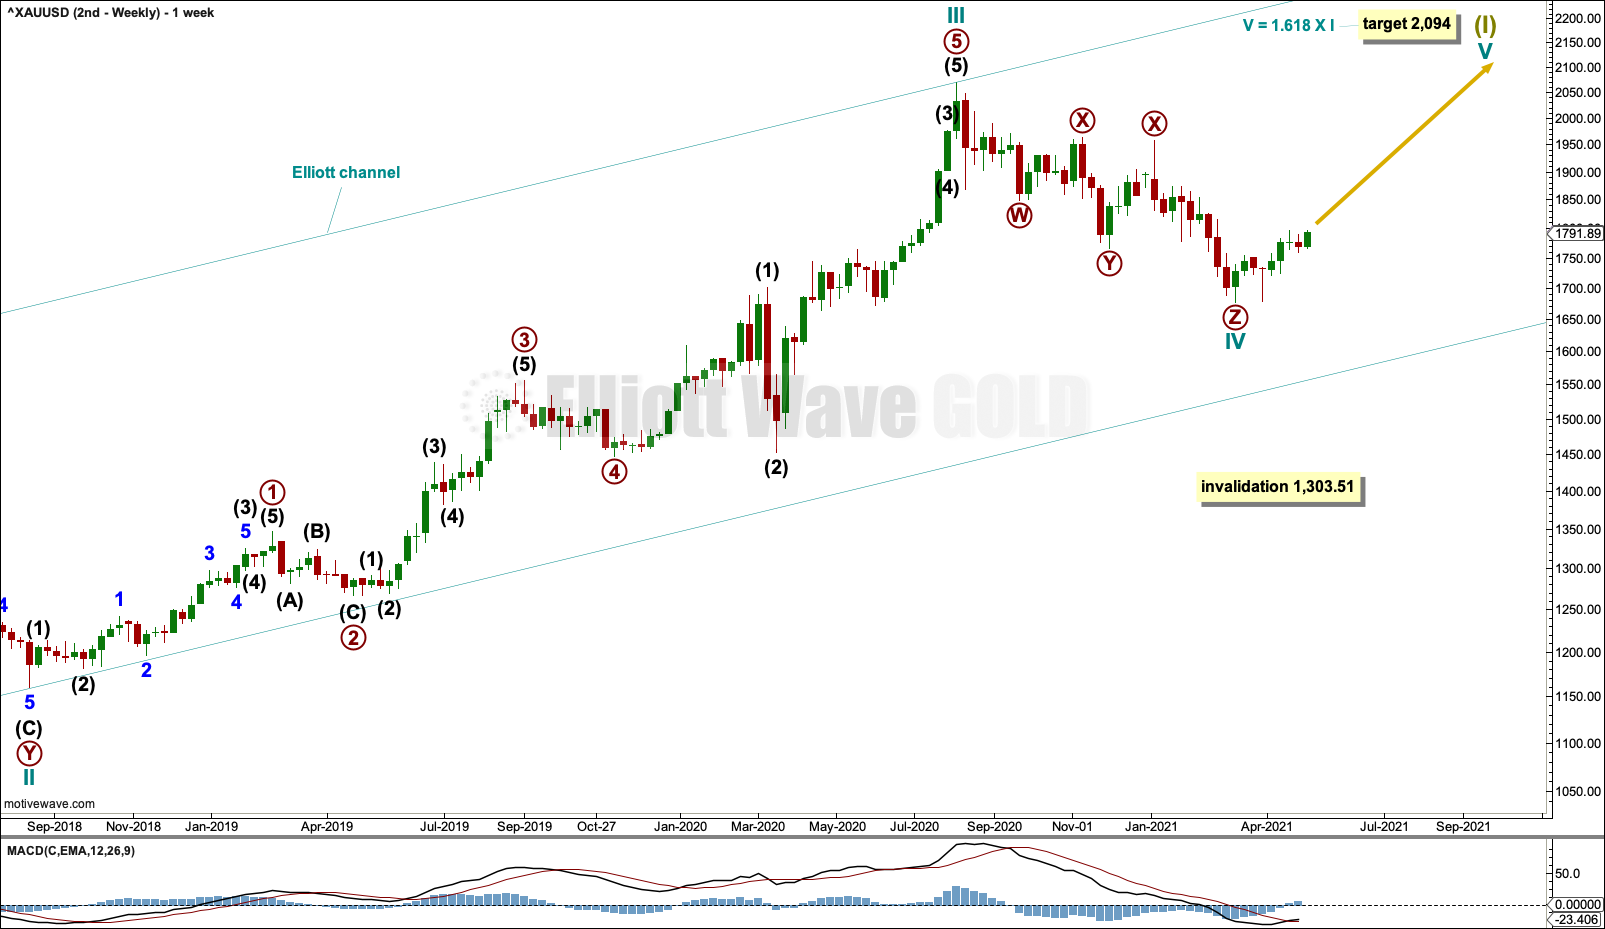
This wave count sees the the bear market complete at the last major low for Gold on 3 December 2015.
If Gold is in a new bull market, then it should begin with a five wave structure upwards on the weekly chart.
Cycle wave I fits as a five wave impulse with reasonably proportionate corrections for primary waves 2 and 4.
Cycle wave II fits as a double flat. However, within the first flat correction labelled primary wave W, this wave count needs to ignore what looks like an obvious triangle from July to September 2016 (this can be seen labelled as a triangle on the second weekly chart on prior analysis here). This movement must be labelled as a series of overlapping first and second waves. Ignoring this triangle reduces the probability of this wave count in Elliott wave terms.
Cycle wave IV may be a complete triple zigzag. The rarity of triple zigzags reduces the probability of this wave count further.
If the third zigzag of primary wave Z continues lower, then cycle wave IV may not move into cycle wave I price territory below 1,303.51.
DAILY CHART
Click chart to enlarge.
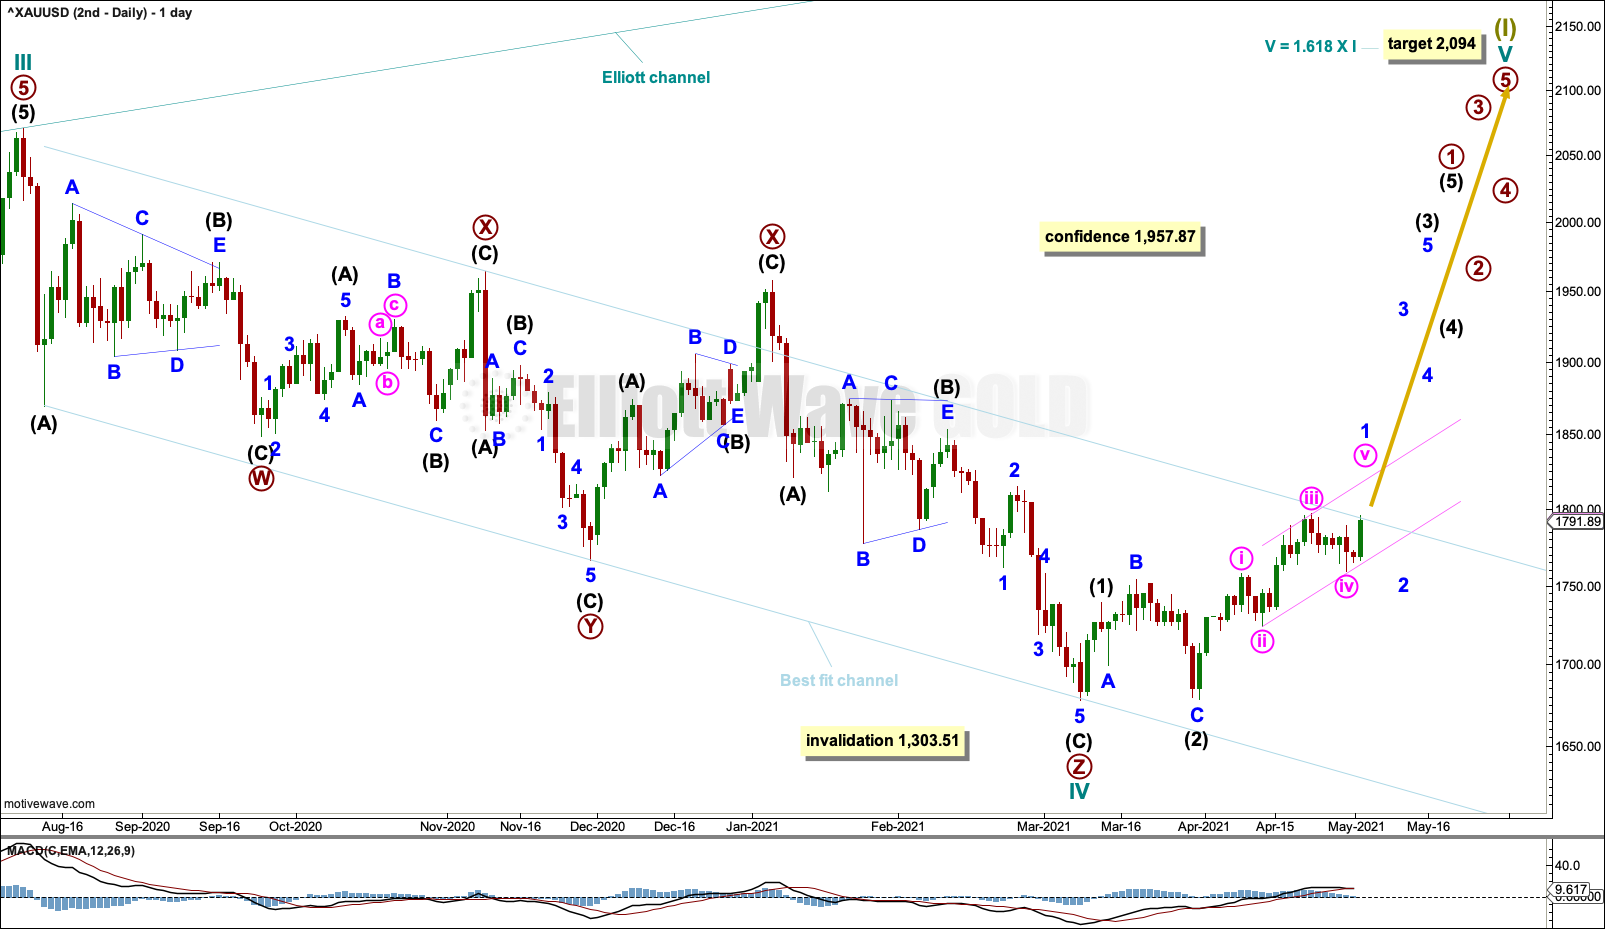
Cycle wave IV may be a complete triple zigzag.
The purpose of multiple zigzags is to deepen a correction when the first zigzag does not move price deep enough. To achieve this purpose multiple zigzags normally have a clear counter trend slope. Cycle wave IV looks normal with a clear downwards slope.
A target is recalculated for cycle wave V. If cycle wave IV continues lower, then this target must again be recalculated.
A best fit channel is drawn about cycle wave IV. If this channel is breached by upwards movement with at least one full daily candlestick above and not touching the upper edge of the channel, then that may provide confidence in this second Elliott wave count. The upper edge of this channel at this stage is not breached and, in the first instance, resistance may be expected if price continues higher to the trend line.
Minor wave 1 may be a complete impulse. Minor wave 2 may now be a complete double zigzag.
HOURLY CHART
Click chart to enlarge.
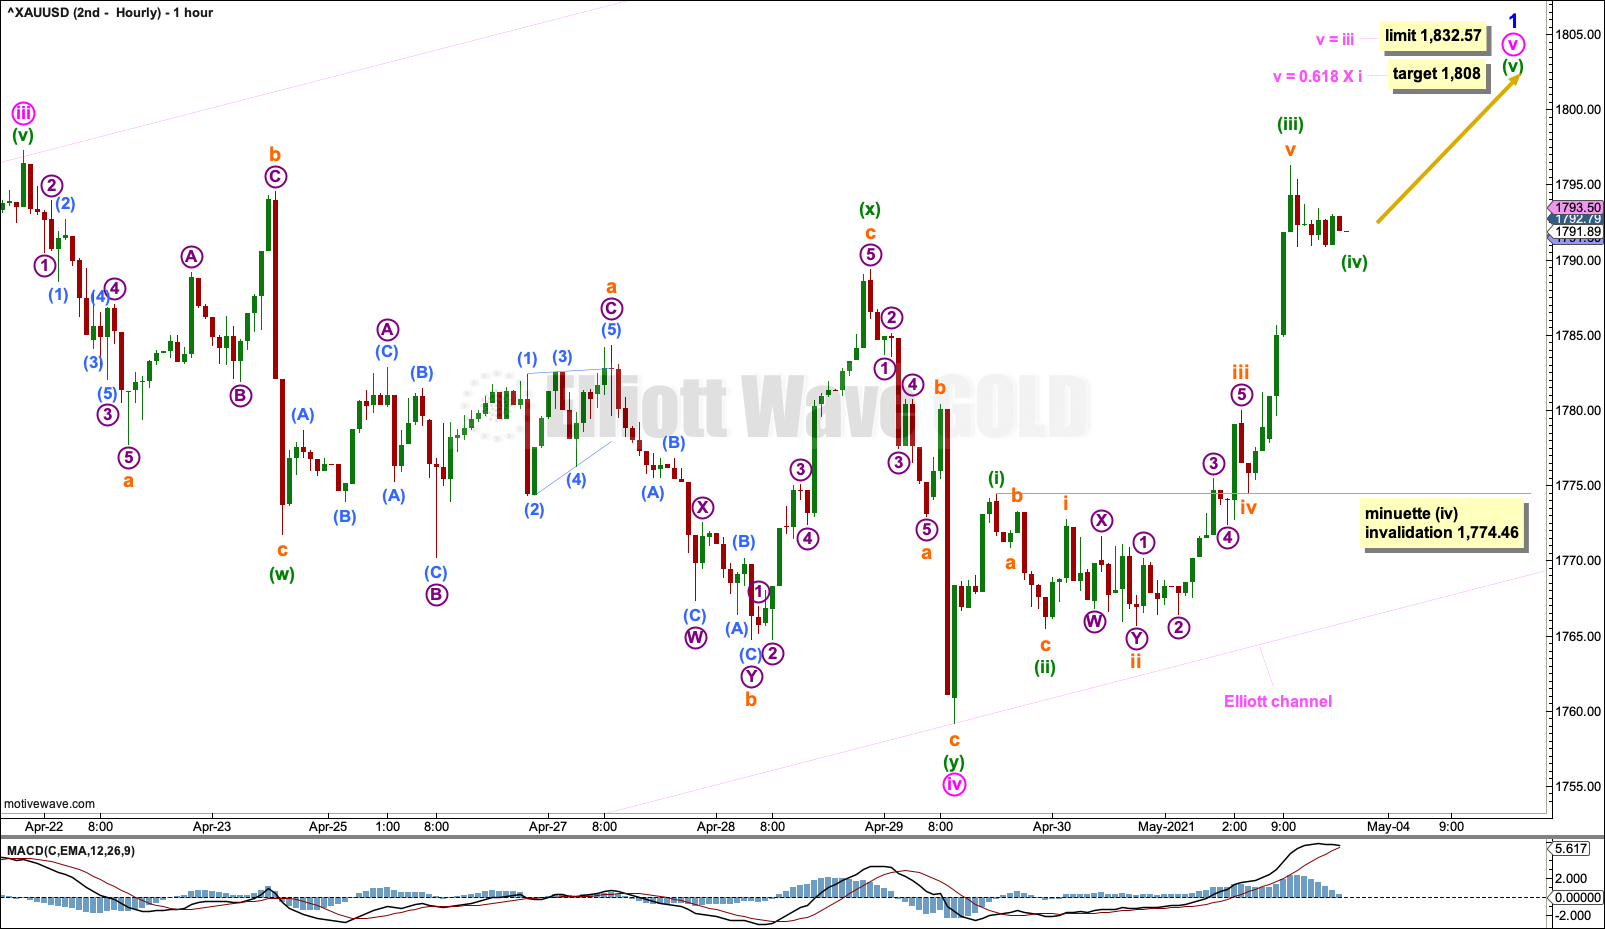
Labelling within minor wave 1 is today changed. The last pullback may have been minute wave iv within minor wave 1. Minute wave v may be underway.
Minute wave iii was 6.28 shorter than minute wave i. This limits minute wave v to no longer than equality in length with minute wave iii, at 1,832.57, because minute wave iii may not be the shortest actionary wave within the impulse of minor wave 1.
A target is calculated for minute wave v to end, which would see it end prior to the limit.
Minuette wave (iv) within minute wave v may not move into minuette wave (i) price territory below 1,774.46.
TECHNICAL ANALYSIS
WEEKLY CHART
Click chart to enlarge. Chart courtesy of StockCharts.com.
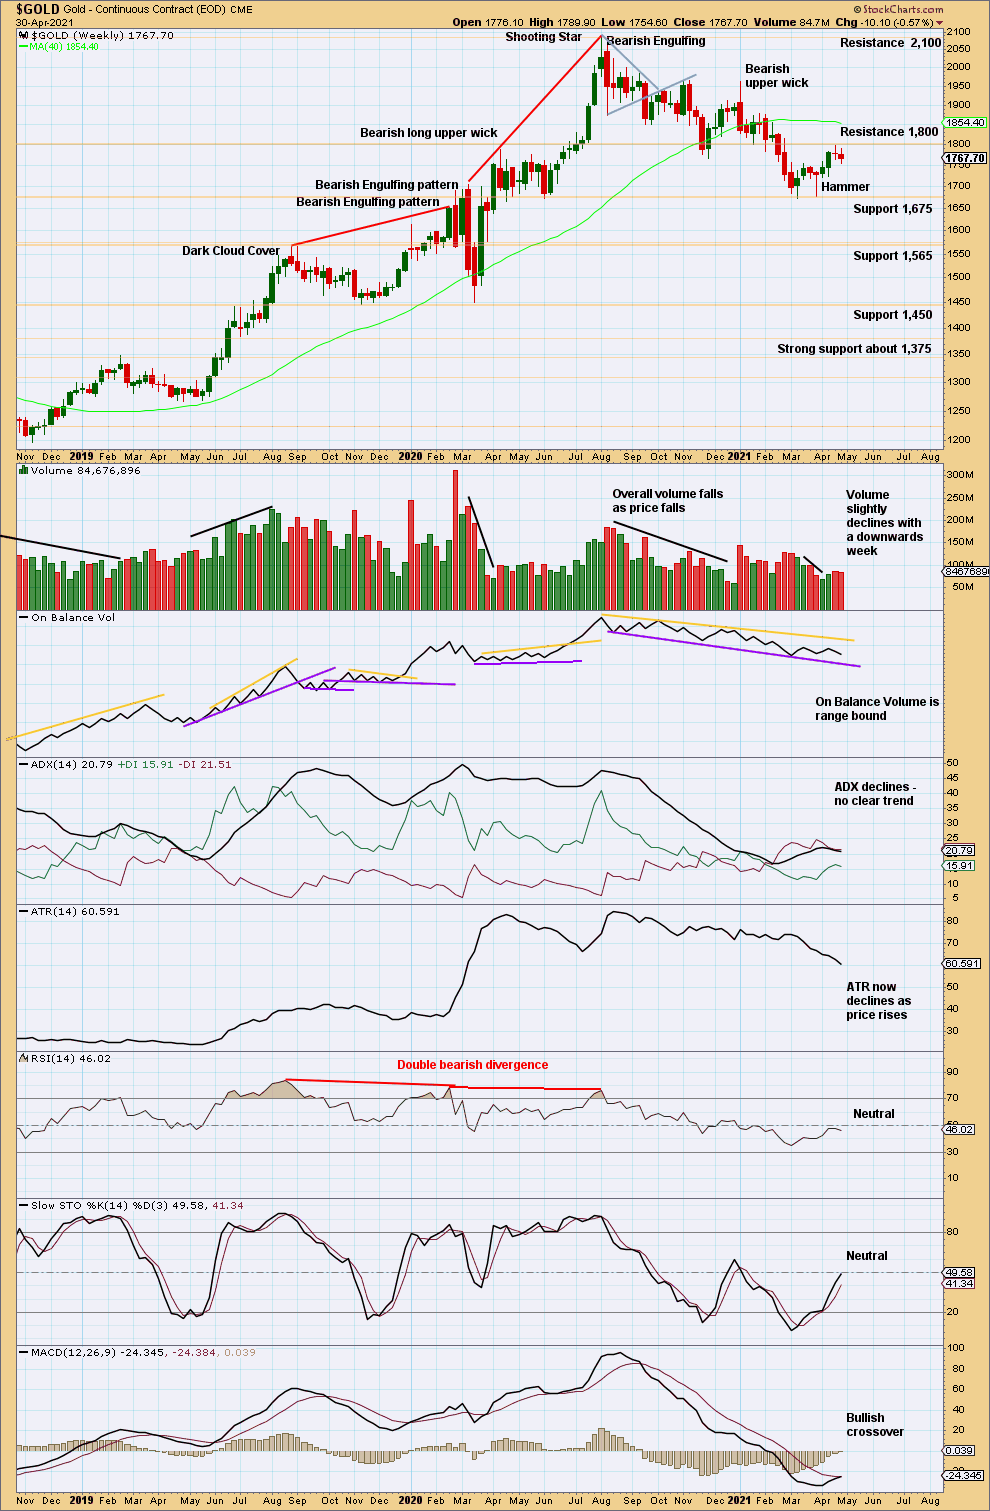
Although last week volume has slightly declined, it remains heavier than immediately prior upwards weeks. Resistance about 1,800 has held.
DAILY CHART
Click chart to enlarge. Chart courtesy of StockCharts.com.
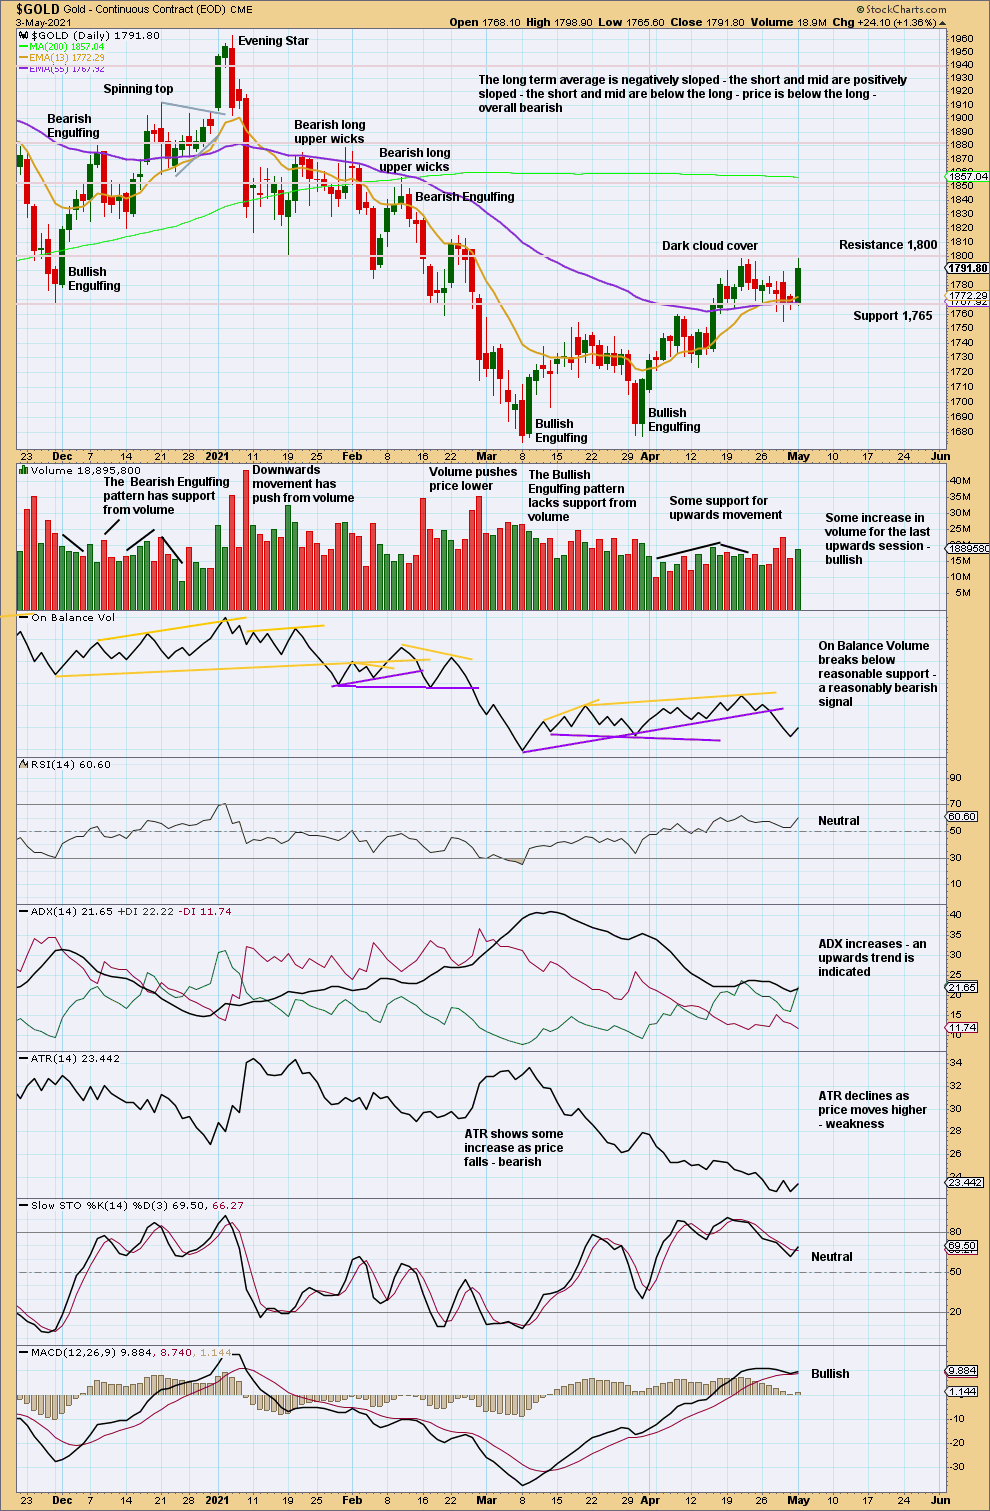
For the short term, at least the volume profile is now bullish. A strong upwards session today remains below resistance about 1,800, but an increase in range and volume is bullish. More upwards movement may be expected; the bounce may not be complete. However, volume for this last session is still lighter than prior downwards sessions. If volume shows a further increase tomorrow, then that would be further bullishness.
Weight is given in this analysis to the bearish signal from On Balance Volume.
GDX WEEKLY CHART

Click chart to enlarge. Chart courtesy of StockCharts.com.
Last week a bearish reversal pattern in an Evening Star has support for the third downwards candlestick. Price has turned down from resistance. The bounce looks to be over.
GDX DAILY CHART
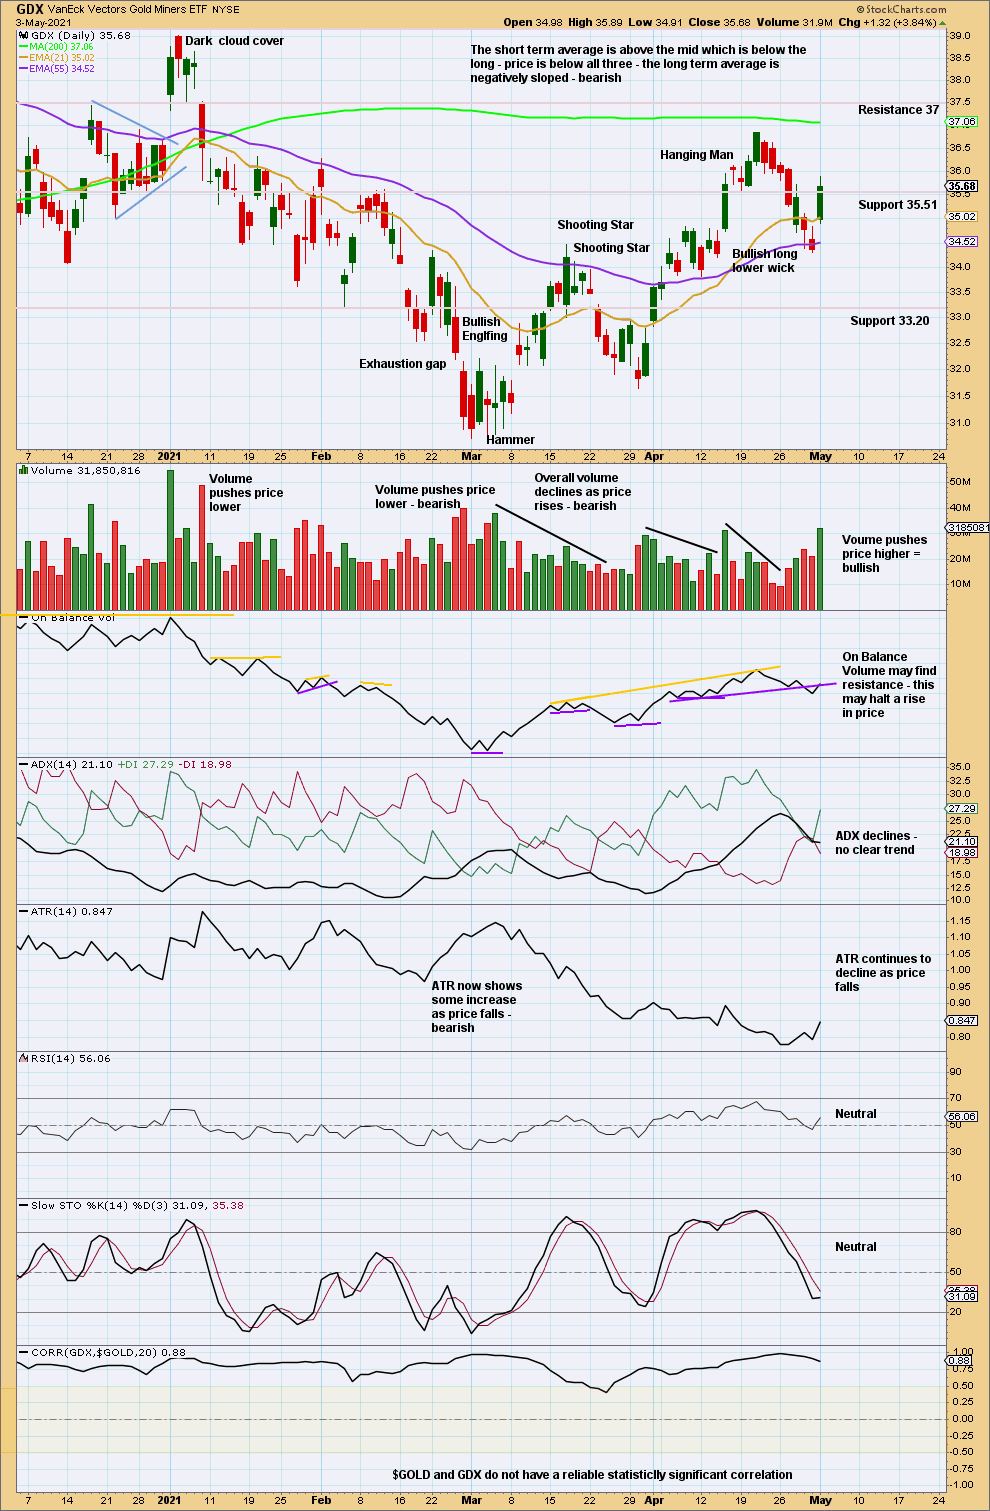
Click chart to enlarge. Chart courtesy of StockCharts.com.
A strong upwards day with support from volume suggests more upwards movement immediately ahead.
Published @ 07:57 p.m. ET.
—
Careful risk management protects your trading account(s).
Follow my two Golden Rules:
1. Always trade with stops.
2. Risk only 1-5% of equity on any one trade.
—
New updates to this analysis are in bold.