
US OIL: Elliott Wave and Technical Analysis | Charts – May 28, 2021
Summary: The main Elliott wave count expects downwards movement may continue for another few weeks to a target zone at 54.86 – 56.80. Thereafter, the next target is at 46.76 if price keeps falling.
The alternate Elliott wave count expects the upwards trend may have already resumed.
The larger trend remains up.
A longer-term target for a third wave is at 87.90 or 121.43.
Oil may have found a major sustainable low in April 2020.
ELLIOTT WAVE COUNT
MONTHLY CHART
Click chart to enlarge.
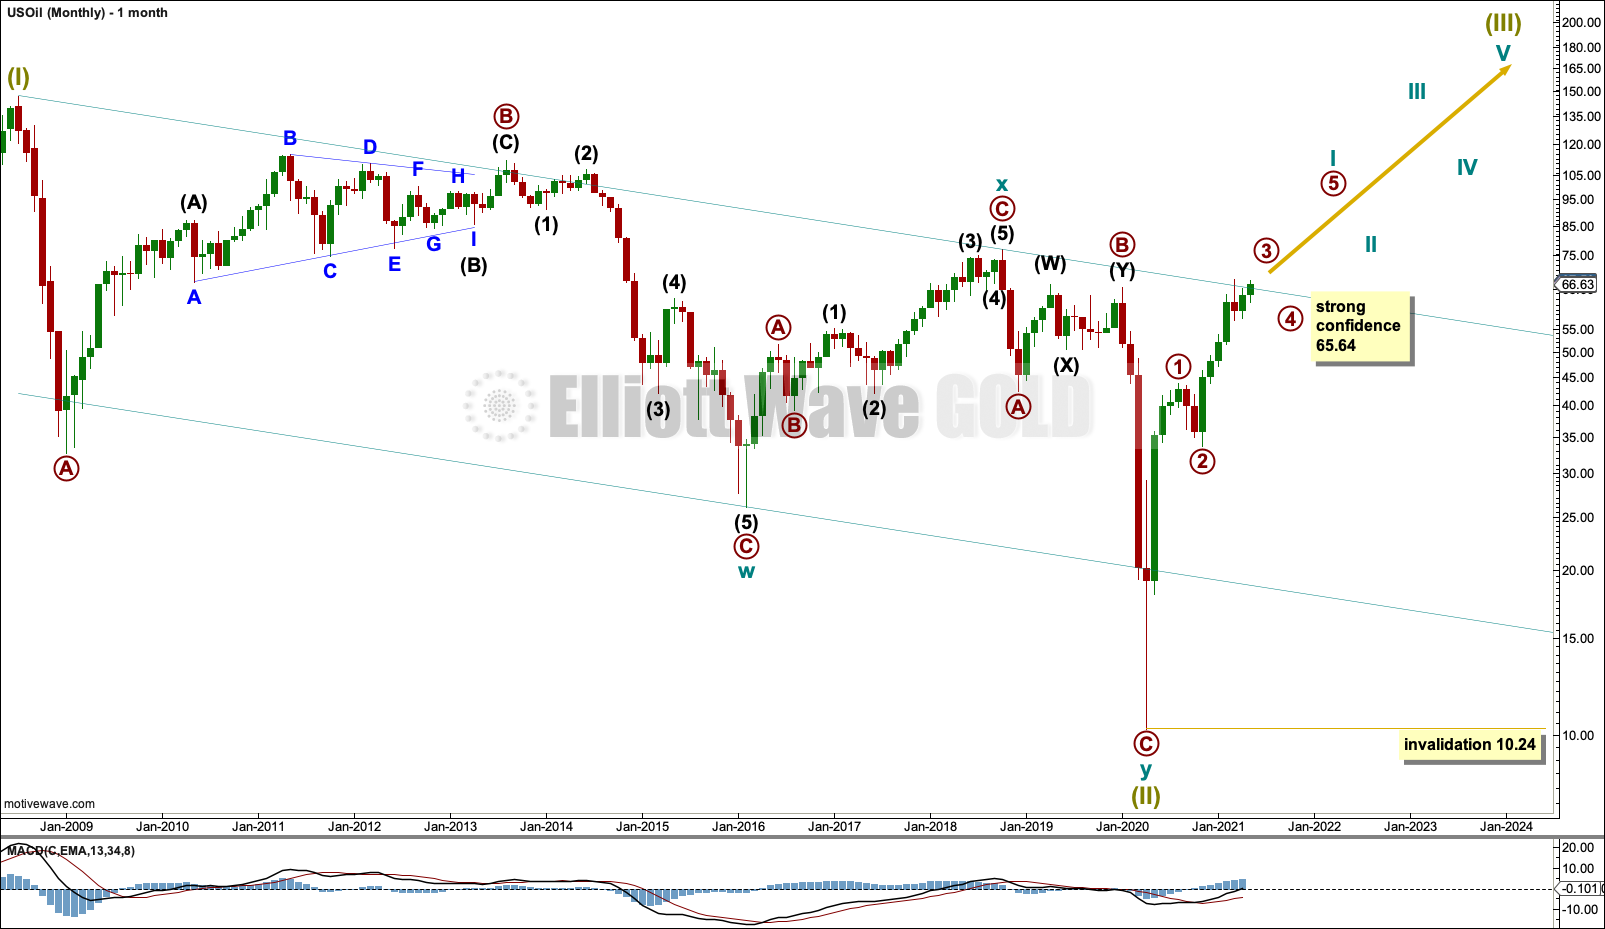
The basic Elliott wave structure is five steps forward and three steps back. This Elliott wave count expects that US Oil has completed a three steps back pattern, which began in July 2008. The Elliott wave count expects that the bear market for US Oil may now be over.
Following Super Cycle wave (II), which was a correction (three steps back), Super Cycle wave (III), which may have begun, should be five steps up when complete. Super Cycle wave (III) may last a generation and must make a new high above the end of Super Cycle wave (I) at 146.73.
A channel is drawn about Super Cycle wave (II): draw the first trend line from the start of cycle wave w to the end of cycle wave x, then place a parallel copy on the end of cycle wave w. This trend line is breached to the downside, which is a typical look for the end of a movement for a commodity.
The upper edge of the channel may provide resistance. Price is reacting down from the upper edge of this channel.
Super Cycle wave (III) may only subdivide as a five wave impulse. New trends for Oil usually start out very slowly with short first waves and deep time consuming second wave corrections. However, while this is a common tendency, it is not always seen and may not have been seen in this instance. The first reasonably sized pullback may be over already.
WEEKLY CHART
Click chart to enlarge.
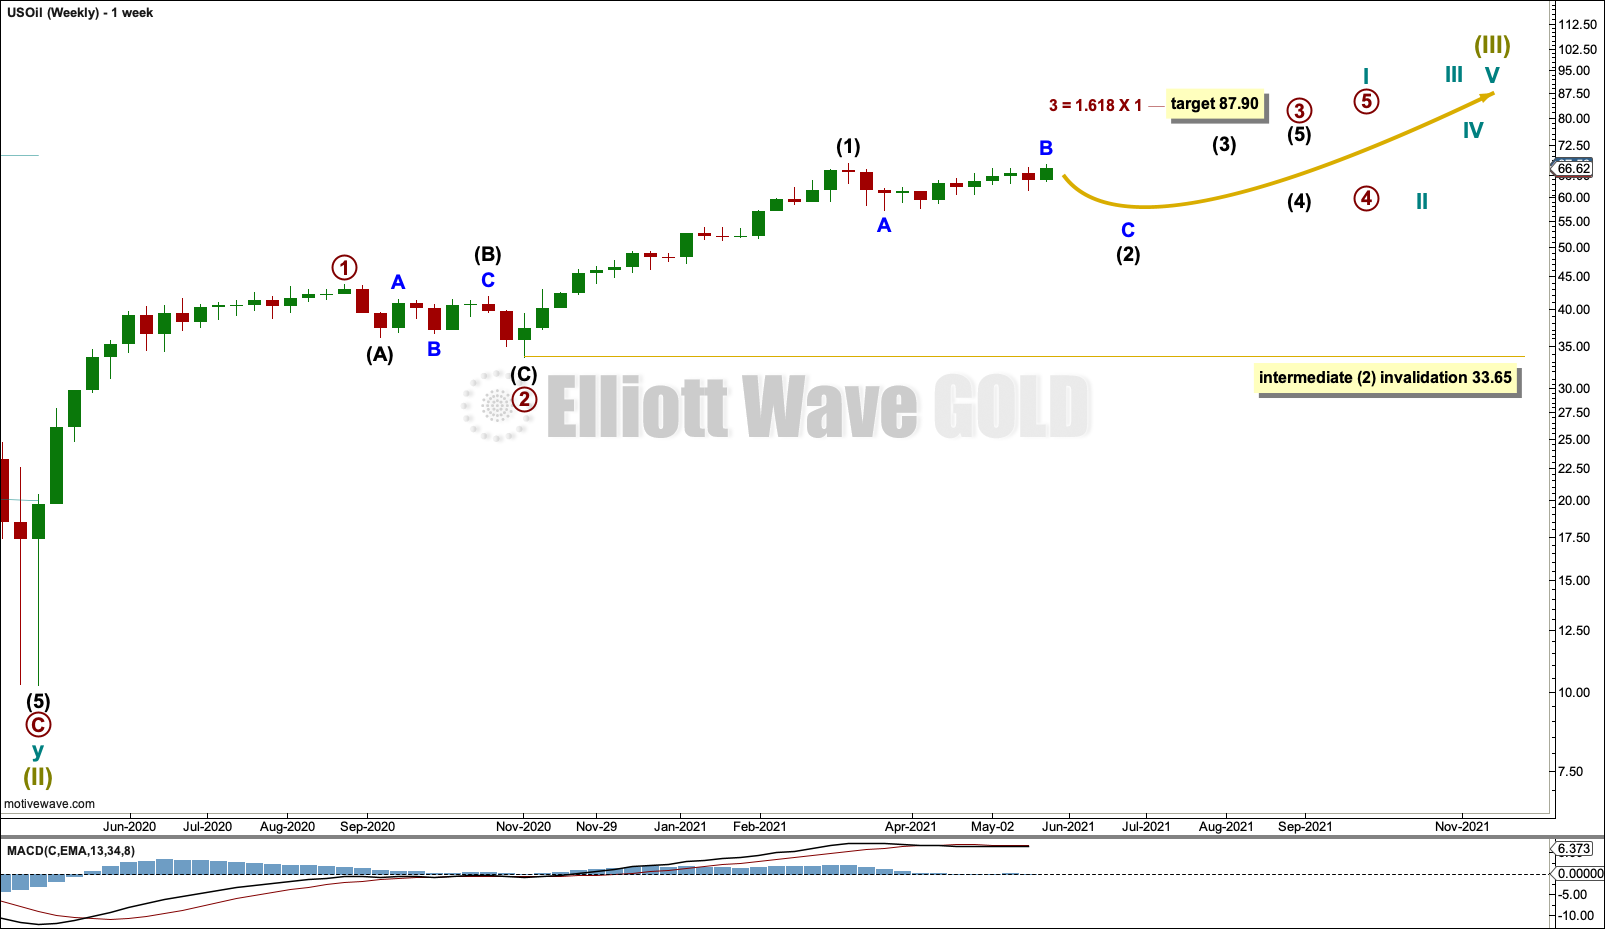
Super Cycle wave (III) must subdivide as an impulse.
Cycle wave I within Super Cycle wave (III) may be incomplete.
Within cycle wave I: Primary waves 1 and 2 may be complete, and primary wave 3, which may only subdivide as an impulse, may have begun.
Within primary wave 3: Intermediate wave (1) may be complete, and intermediate wave (2) may still be unfolding. Intermediate wave (2) may not move beyond the start of intermediate wave (1) below 33.65.
This week two charts are given at the daily chart level for intermediate wave (2).
MAIN DAILY CHART
Click chart to enlarge.
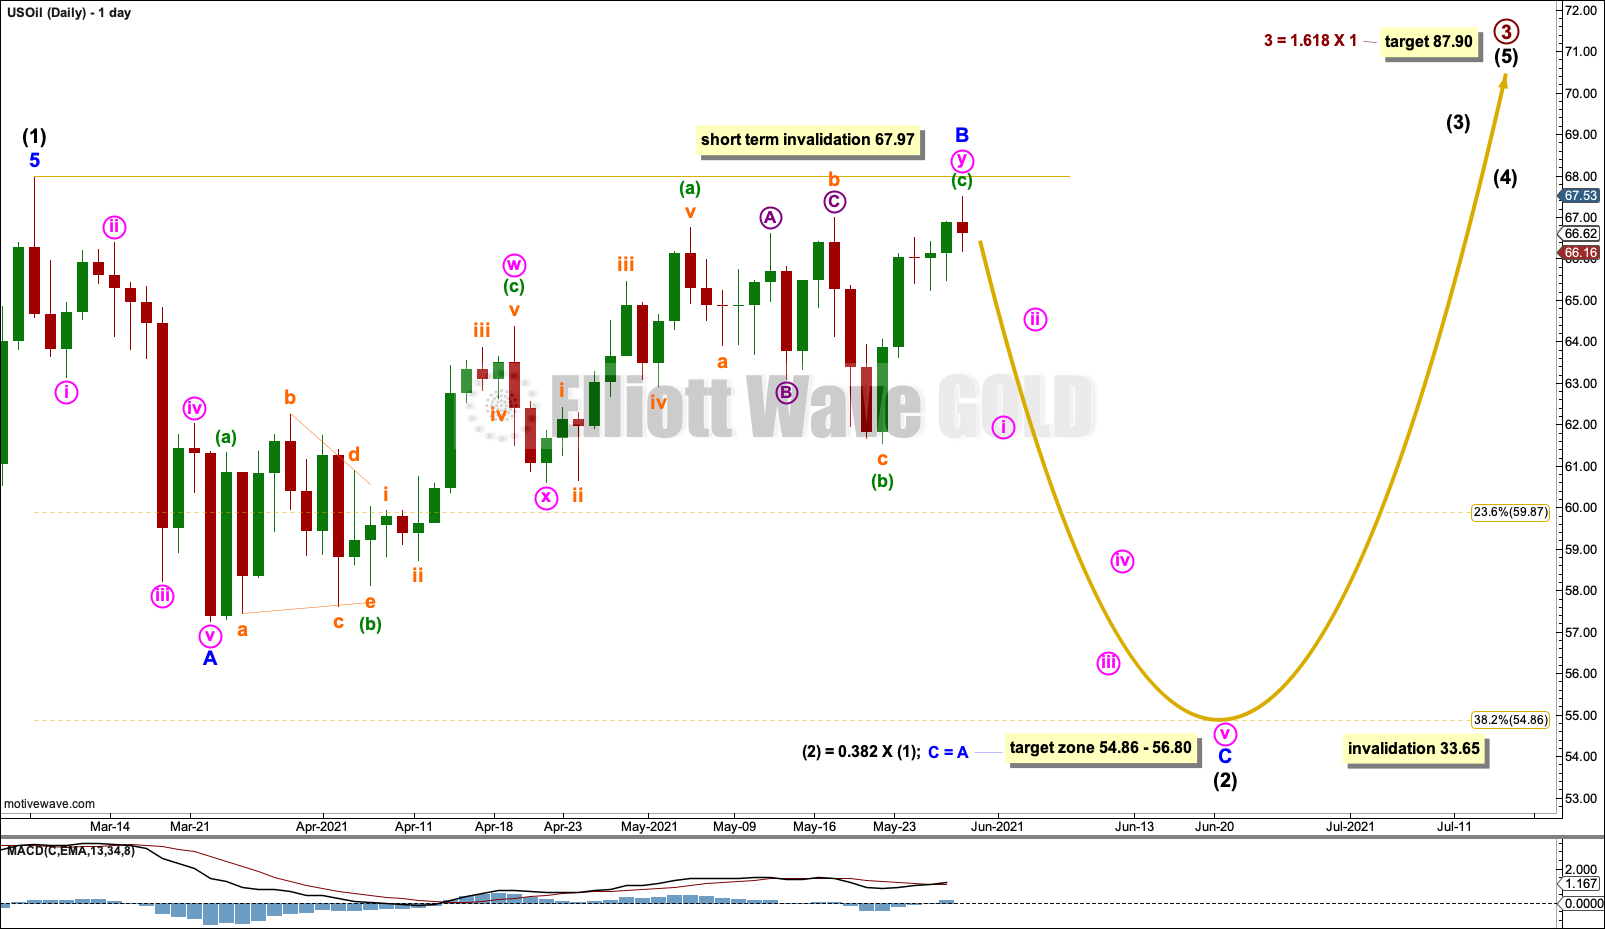
Intermediate wave (2) would most likely subdivide as a zigzag. Minor wave A within the zigzag may be a complete impulse. Minor wave B may have continued higher as a double zigzag. If minor wave A is correctly labelled as a five wave impulse, then minor wave B may not move beyond its start above 67.97. This first wave count labels minor wave A as a five; this has the best fit and look, so it has the highest probability.
Minor wave C may now continue lower for a few weeks. It must subdivide as a motive structure, most likely an impulse.
Intermediate wave (2) may last for several weeks.
As price approaches the first target zone at 54.86 to 56.80, and if then the structure is complete and technical analysis indicates a low may be in place, then it may end there. But if price keeps falling and / or the structure of intermediate wave (2) is incomplete, then the 0.618 Fibonacci ratio at 46.76 would be the next target.
Labelling within intermediate wave (2) may still change as it unfolds and alternate wave counts for the short-term structure may need to be considered. There are several different structures that intermediate wave (2) may unfold as.
Intermediate wave (2) may not move beyond the start of intermediate wave (1) below 33.65.
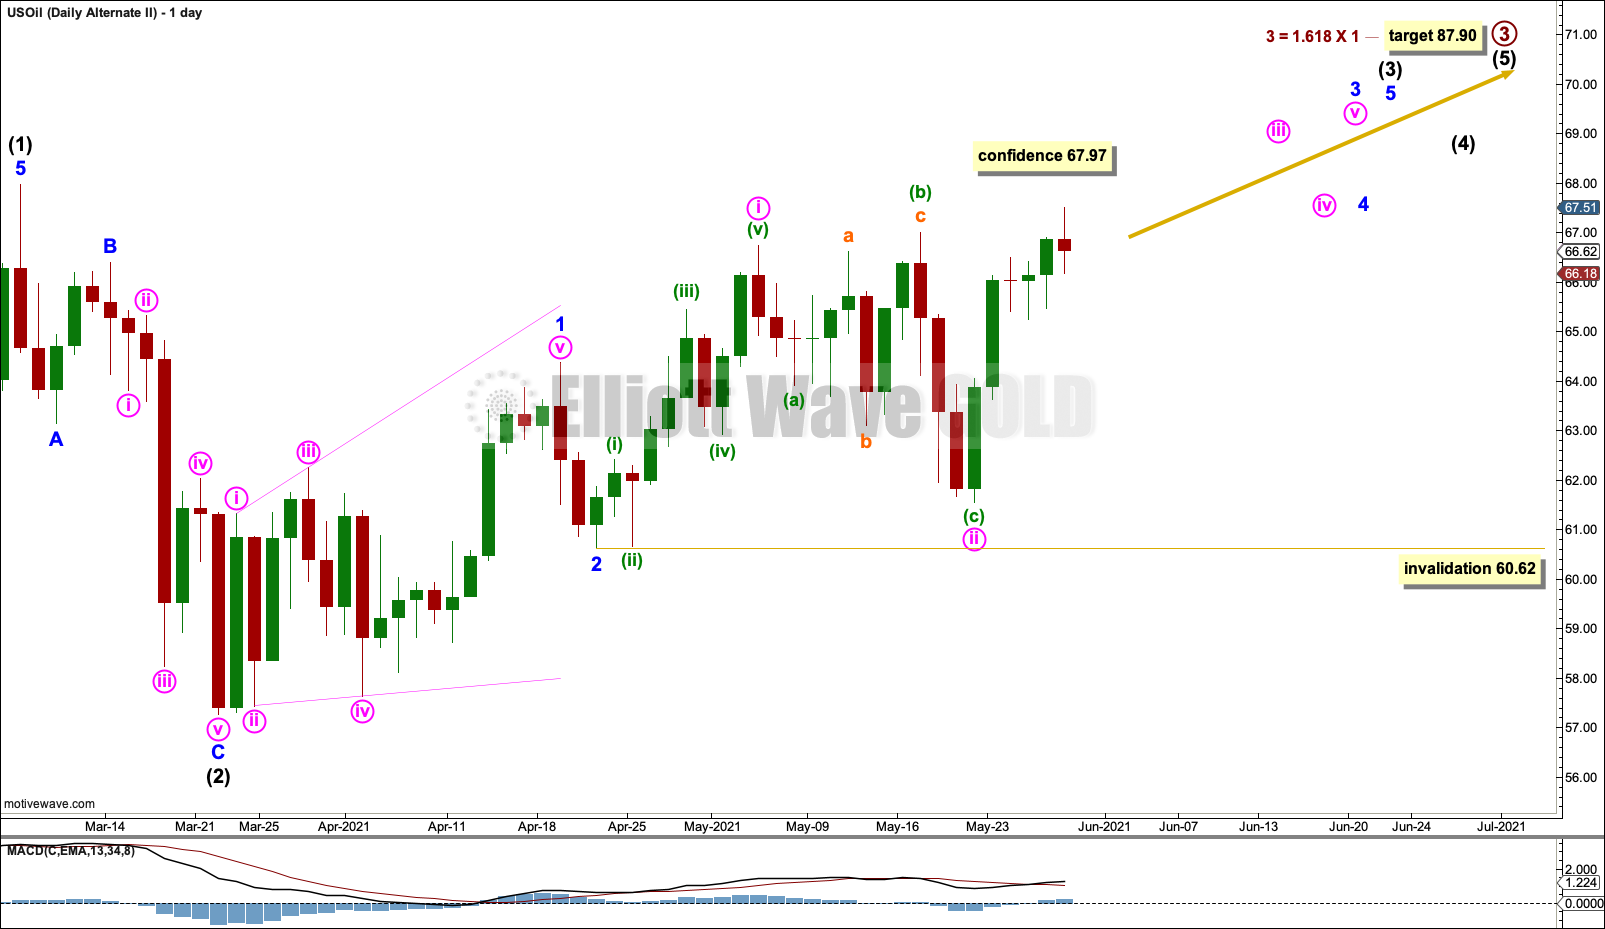
FIRST ALTERNATE DAILY CHART
Click chart to enlarge.
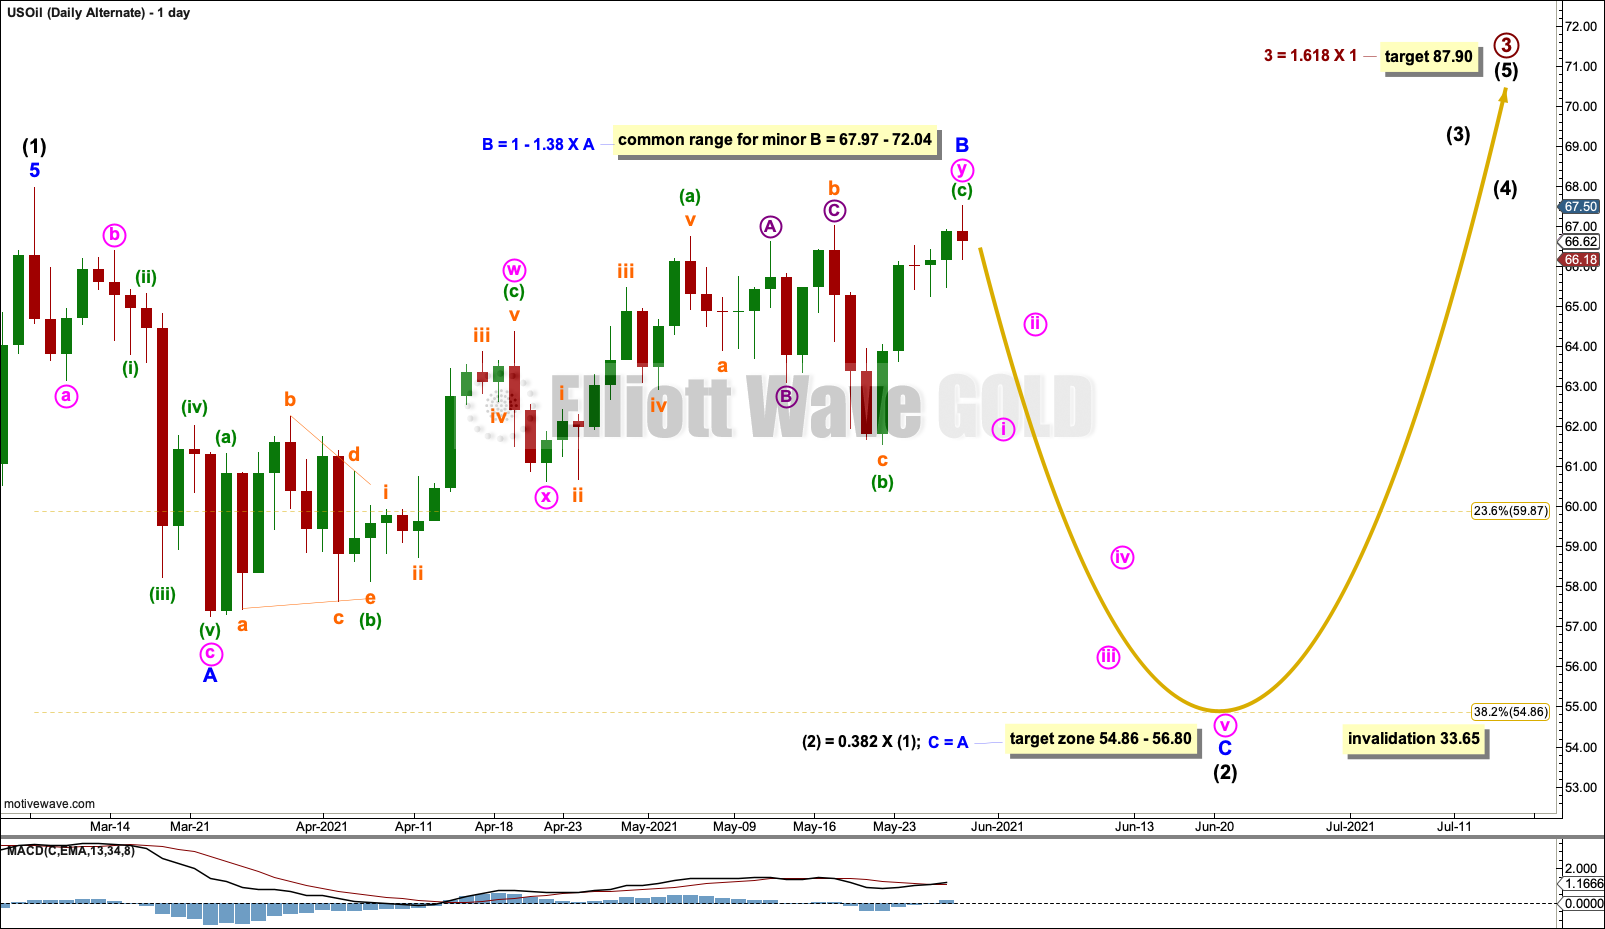
This week this alternate wave count is new.
This wave count must see the downwards wave ending on 23rd of March as a three, but this movement looks best as a five. This reduces the probability of this wave count.
If the downwards wave labelled minor wave A may be seen as either a three or a five, then both structures must be considered. If minor wave A within intermediate wave (2) subdivides as a three, then intermediate wave (2) may be subdividing as a flat.
Within a flat the common range for minor wave B would be from 67.97 to 72.04. Minor wave B may make a new high beyond the start of minor wave A, as in an expanded flat. If minor wave B is complete at this week’s high, then intermediate wave (2) may be unfolding as a regular flat.
Minor wave C would be likely to make at least a slight new low below the end of minor wave A at 57.26 to avoid a truncation.
The target is the same for both this first alternate wave count and the main wave count.
SECOND ALTERNATE DAILY CHART
Click chart to enlarge.
It is possible that intermediate wave (2) is over as a brief and shallow zigzag.
This wave count must see the downwards wave ending on 23rd of March as a three, but this movement looks best as a five. This reduces the probability of this wave count.
If intermediate wave (3) has begun, then minor wave 1 within it may be a complete leading expanding diagonal. Leading expanding diagonals are less common than impulses. This further reduces the probability of this wave count.
Minute wave ii within minor wave 3 may not move beyond the start of minute wave i below 60.62.
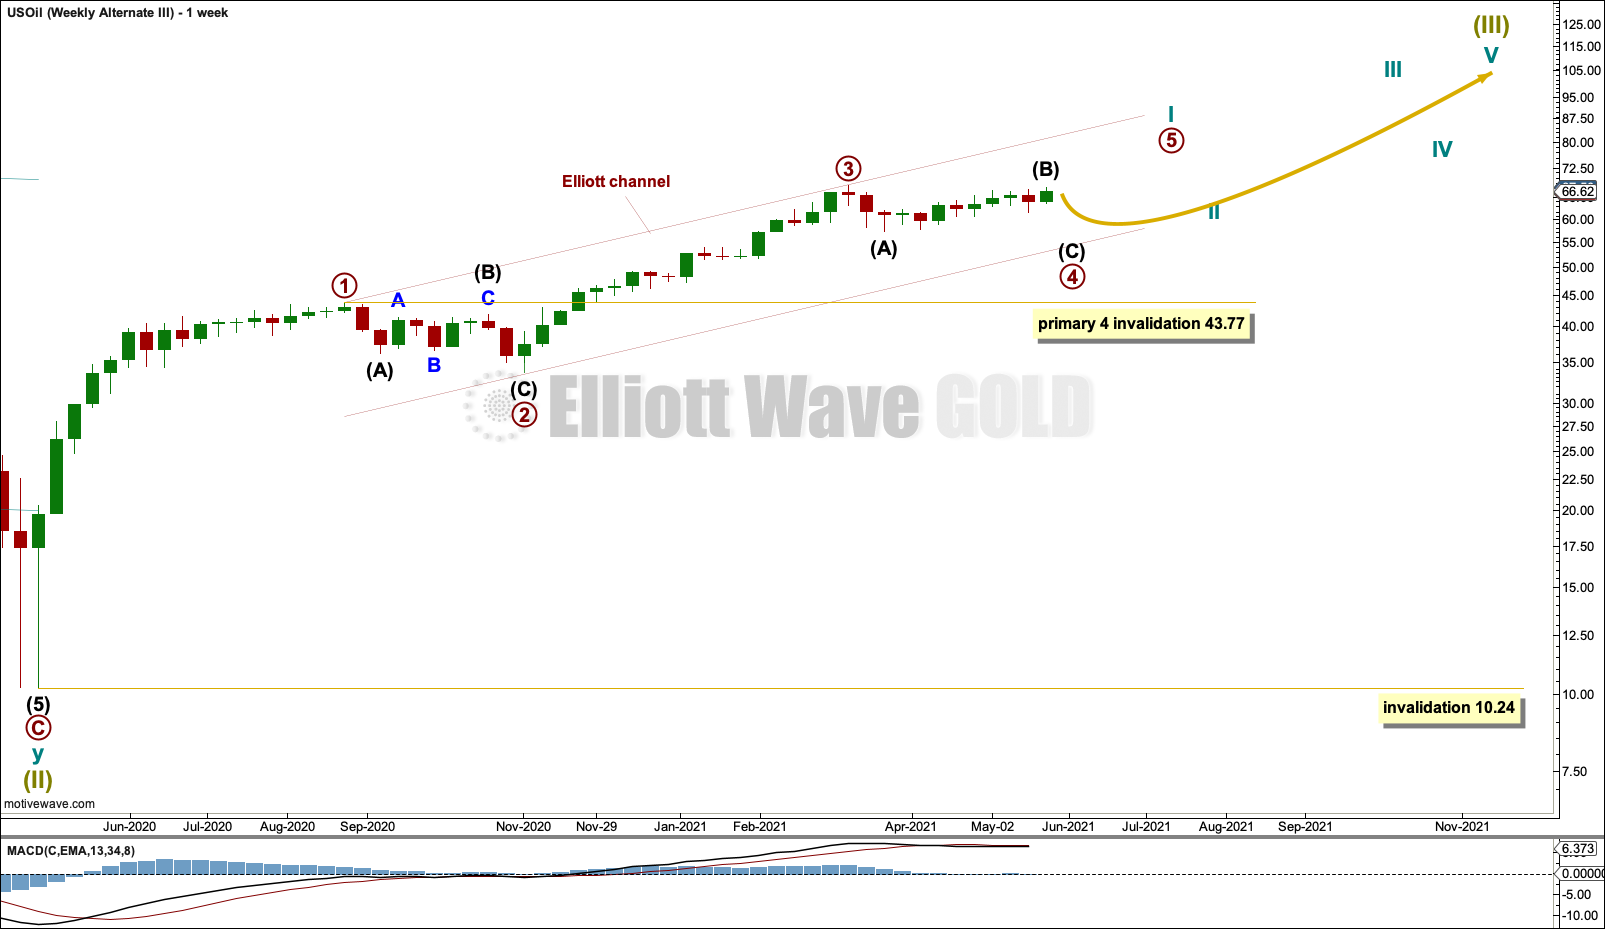
THIRD ALTERNATE WEEKLY CHART
Click chart to enlarge.
This third alternate wave count considers the possibility that primary wave 3 may have been over at the last high.
Primary wave 3 is close to equal in length with primary wave 1; it is 0.79 longer than primary wave 1.
Primary wave 4 may be continuing as a zigzag, flat, triangle or combination. The daily charts for this alternate wave count would look the same as the three daily charts above, the degree of labelling would be one degree higher.
TECHNICAL ANALYSIS
WEEKLY CHART
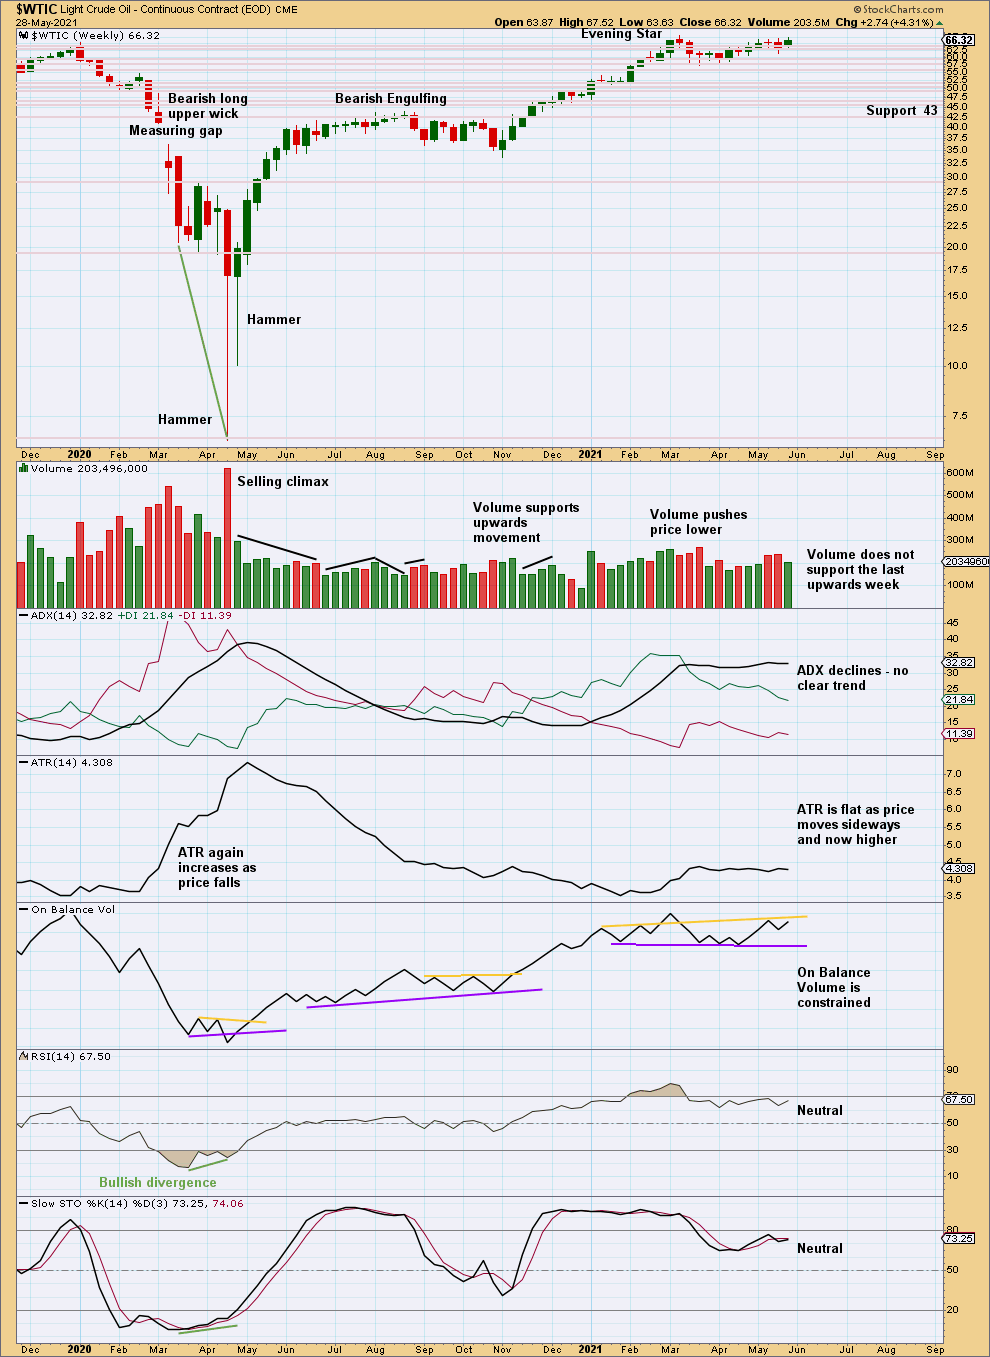
Click chart to enlarge. Chart courtesy of StockCharts.com.
The Bearish Engulfing pattern has been followed by an upwards week, which negates the pattern. However, this week volume has not supported upwards movement. Weak volume and resistance for both price and On Balance Volume this week support the main daily and first daily alternate charts.
DAILY CHART
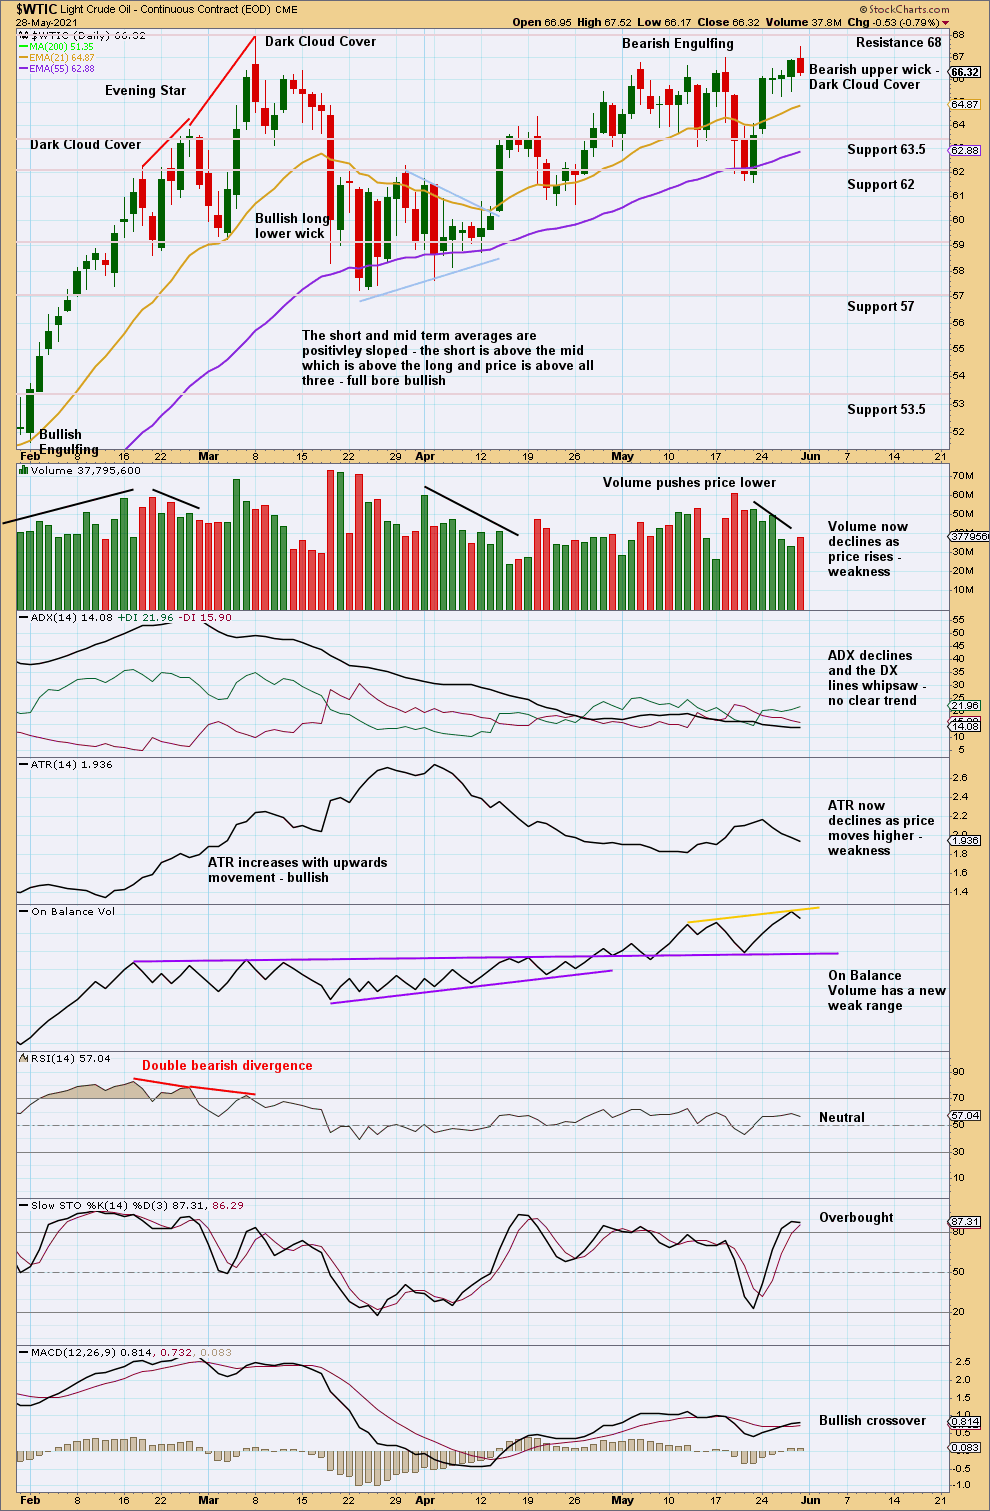
Click chart to enlarge. Chart courtesy of StockCharts.com.
There is no clear trend. Price is consolidating with resistance about 68 and support about 57. At this stage, an upwards swing may be complete here or very soon. A downwards swing to support may now be expected. This is the general outline for the main daily and first alternate daily Elliott wave counts.
A break above resistance with a close above 68 on an upwards day with support from volume would be required for the bullish case.
Published @ 07:06 p.m. ET.
—
Careful risk management protects your trading account(s).
Follow my two Golden Rules:
1. Always trade with stops.
2. Risk only 1-5% of equity on any one trade.
—
New updates to this analysis are in bold.
—