
SILVER: Elliott Wave and Technical Analysis | Charts – July 2, 2021
Another small range week leaves all three Elliott wave counts essentially the same.
Summary: The first wave count is bearish for the mid and long term. A target is at 7.45. For the short term, upwards movement may again be complete this week. However, if it continues higher, then upwards movement is not expected to make a new high above 26.601.
The second wave count is overall bullish at the monthly chart level.
The second wave count is bearish for the mid term, expecting a pullback to about 18.605 before the bull market resumes.
A new alternate Elliott wave count has some support from classic technical analysis. It allows for an upwards trend to continue with a minimum requirement at 31.727.
ELLIOTT WAVE COUNTS
FIRST ELLIOTT WAVE COUNT
MONTHLY CHART
Click chart to enlarge.
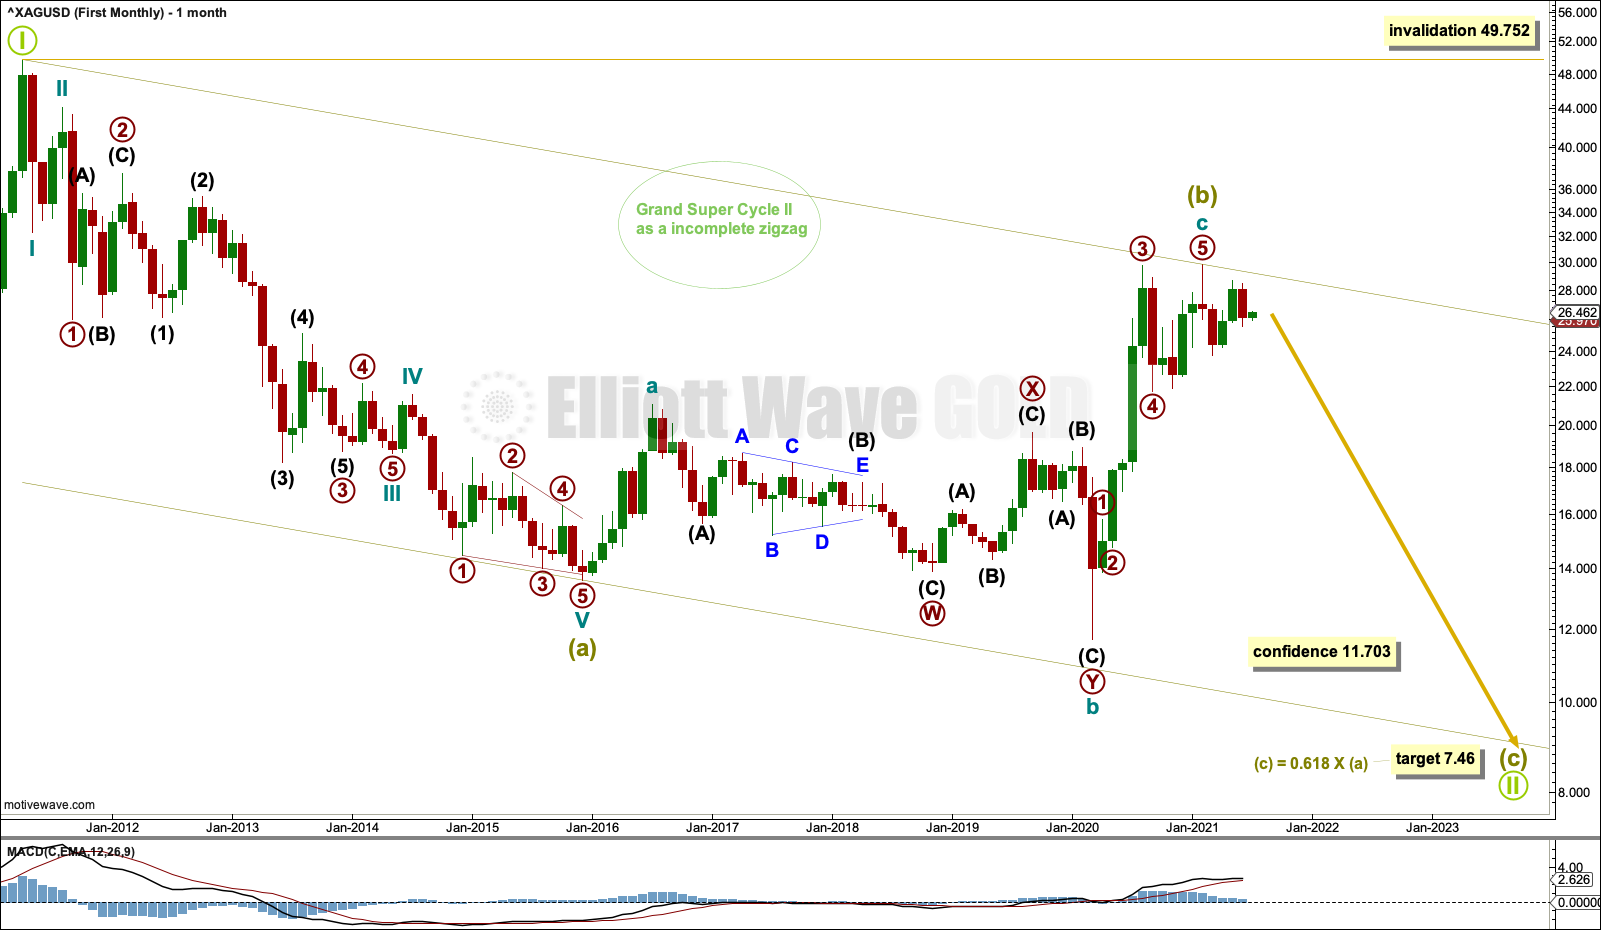
This first wave count has a better look in terms of Elliott wave structures.
It is possible that the zigzag for Grand Super Cycle wave II may be incomplete. Super Cycle wave (b) may be complete as an expanded flat correction.
Cycle wave b within the expanded flat of Super Cycle wave (b) is a 1.25 length of cycle wave a. This is within the most common range for B waves within flats of up to 1.38 times their counterpart A wave.
Cycle wave b within Super Cycle wave (b) subdivides as a double zigzag. This is a very common Elliott wave corrective structure, particularly in a B wave position. This part of the wave count has an excellent fit; all subdivisions are correct and the structures are common. This resolves the problem that the second wave count has of the triangle trend lines not being strictly adhered to.
If it continues further, then Super Cycle wave (b) may not move beyond the start of Super Cycle wave (a) above 49.752.
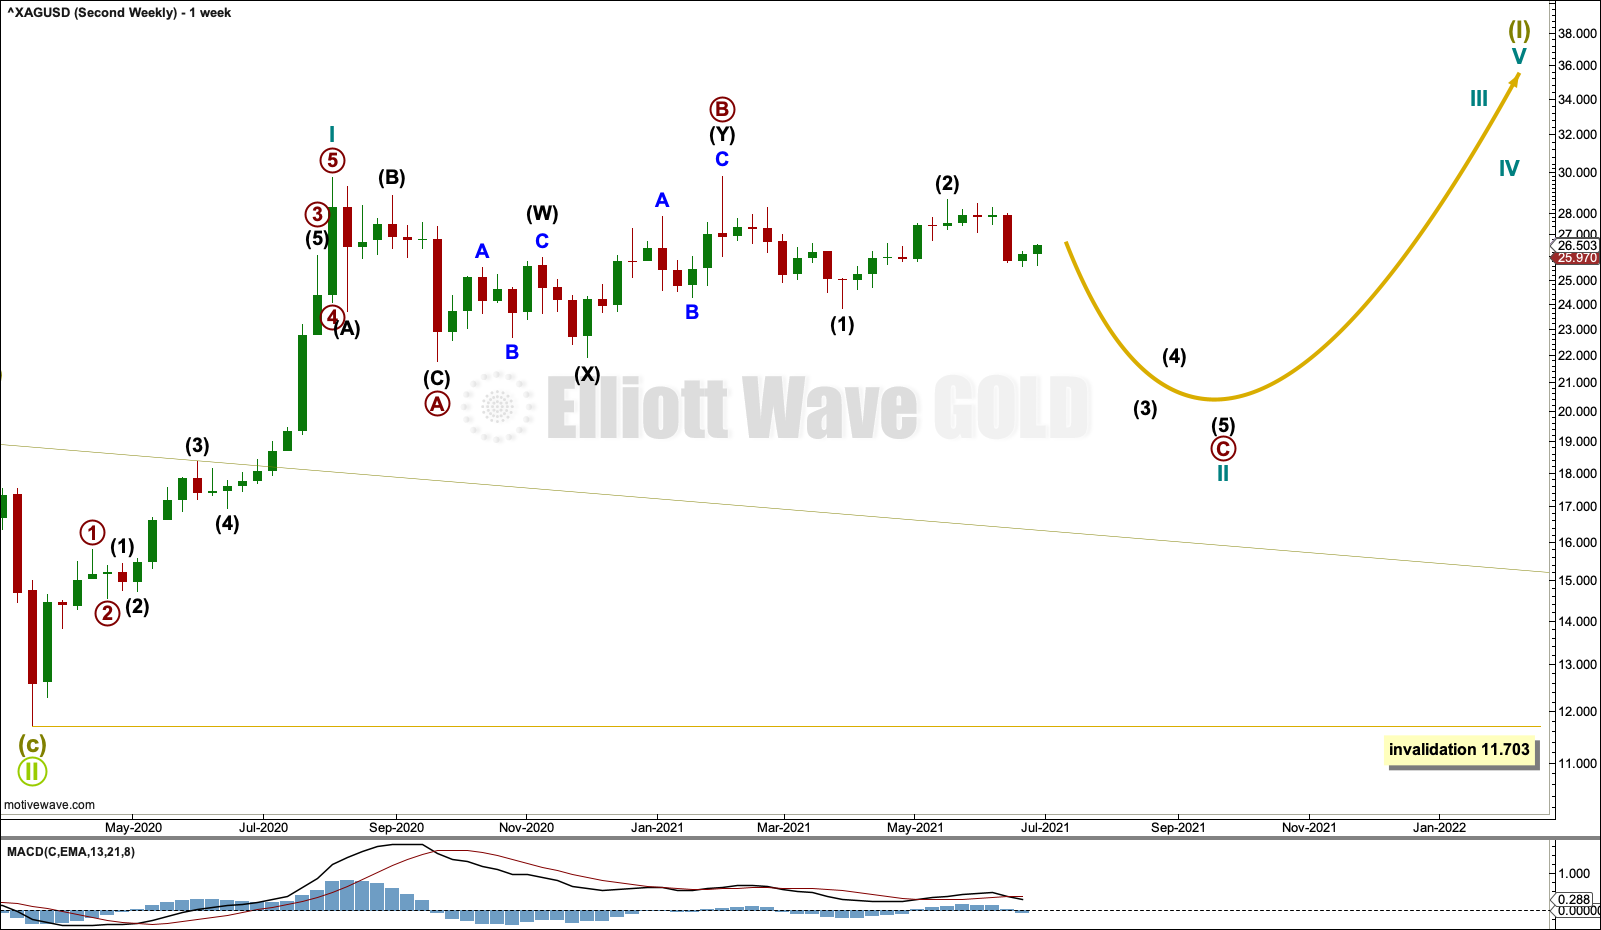
WEEKLY CHART
Click chart to enlarge.
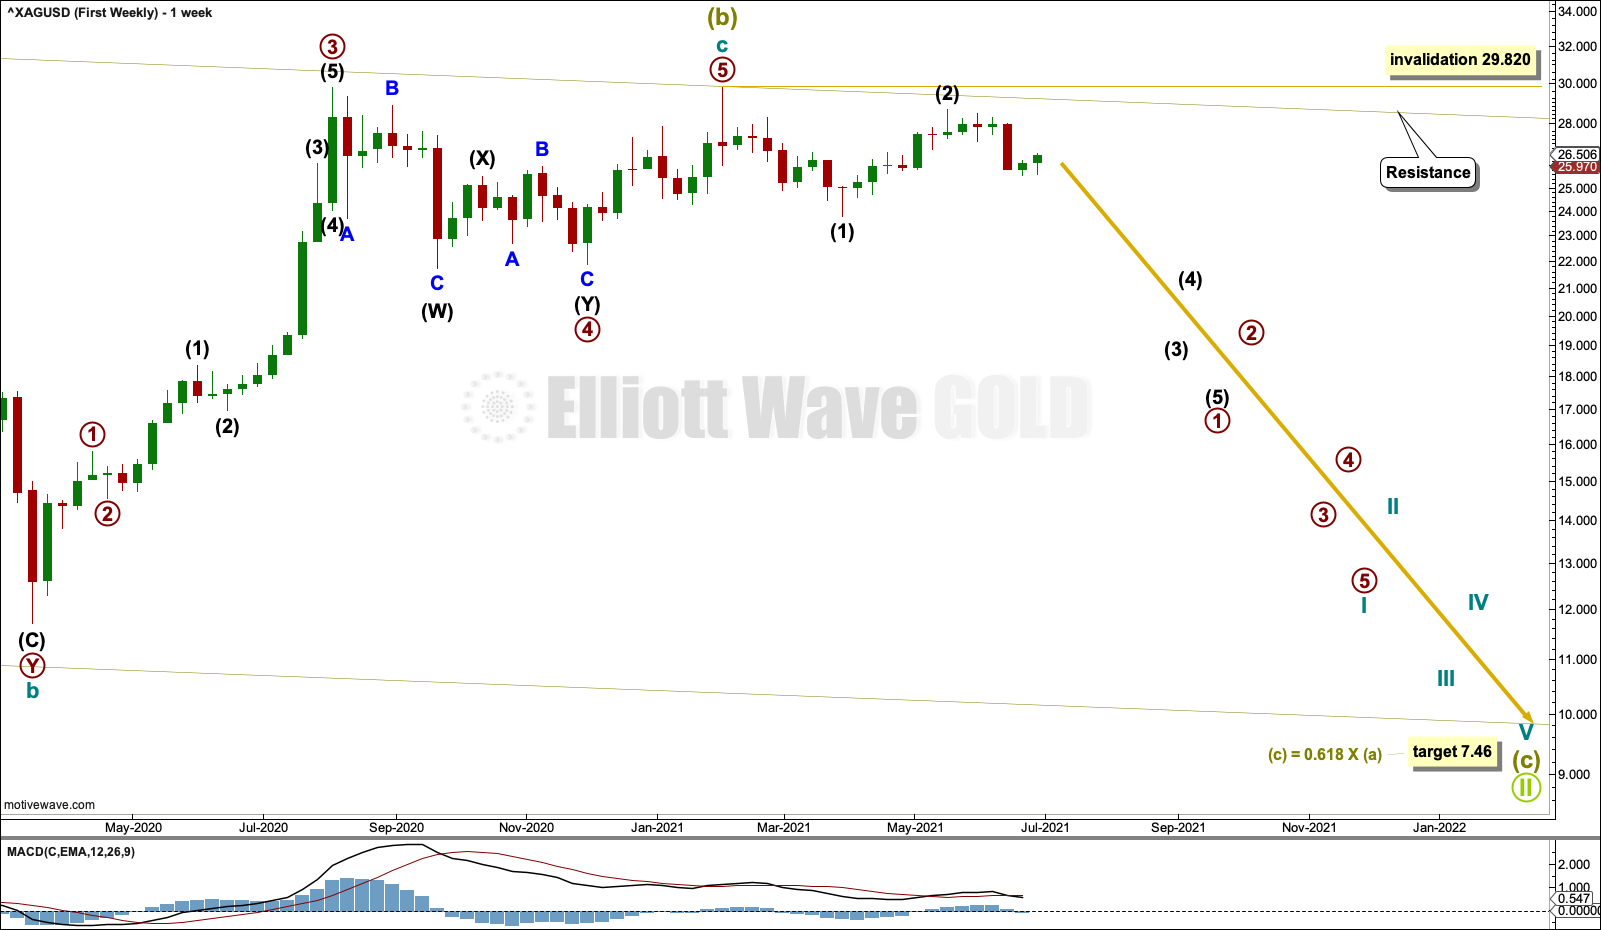
It is possible that Super Cycle wave (b) was complete at the last high and cycle wave c within it is a complete five wave impulse.
The disproportion between primary waves 2 and 4 within cycle wave c gives this part of the wave count the wrong look, but it should still be considered because Silver does not always exhibit good proportion.
If Super Cycle wave (c) has begun, then it should move below the end of Super Cycle wave (a) at 13.569 to avoid a truncation. A target is calculated.
The large channel from the monthly chart is copied over to the weekly chart. Intermediate wave (2) may have found resistance just below the upper edge of this channel.
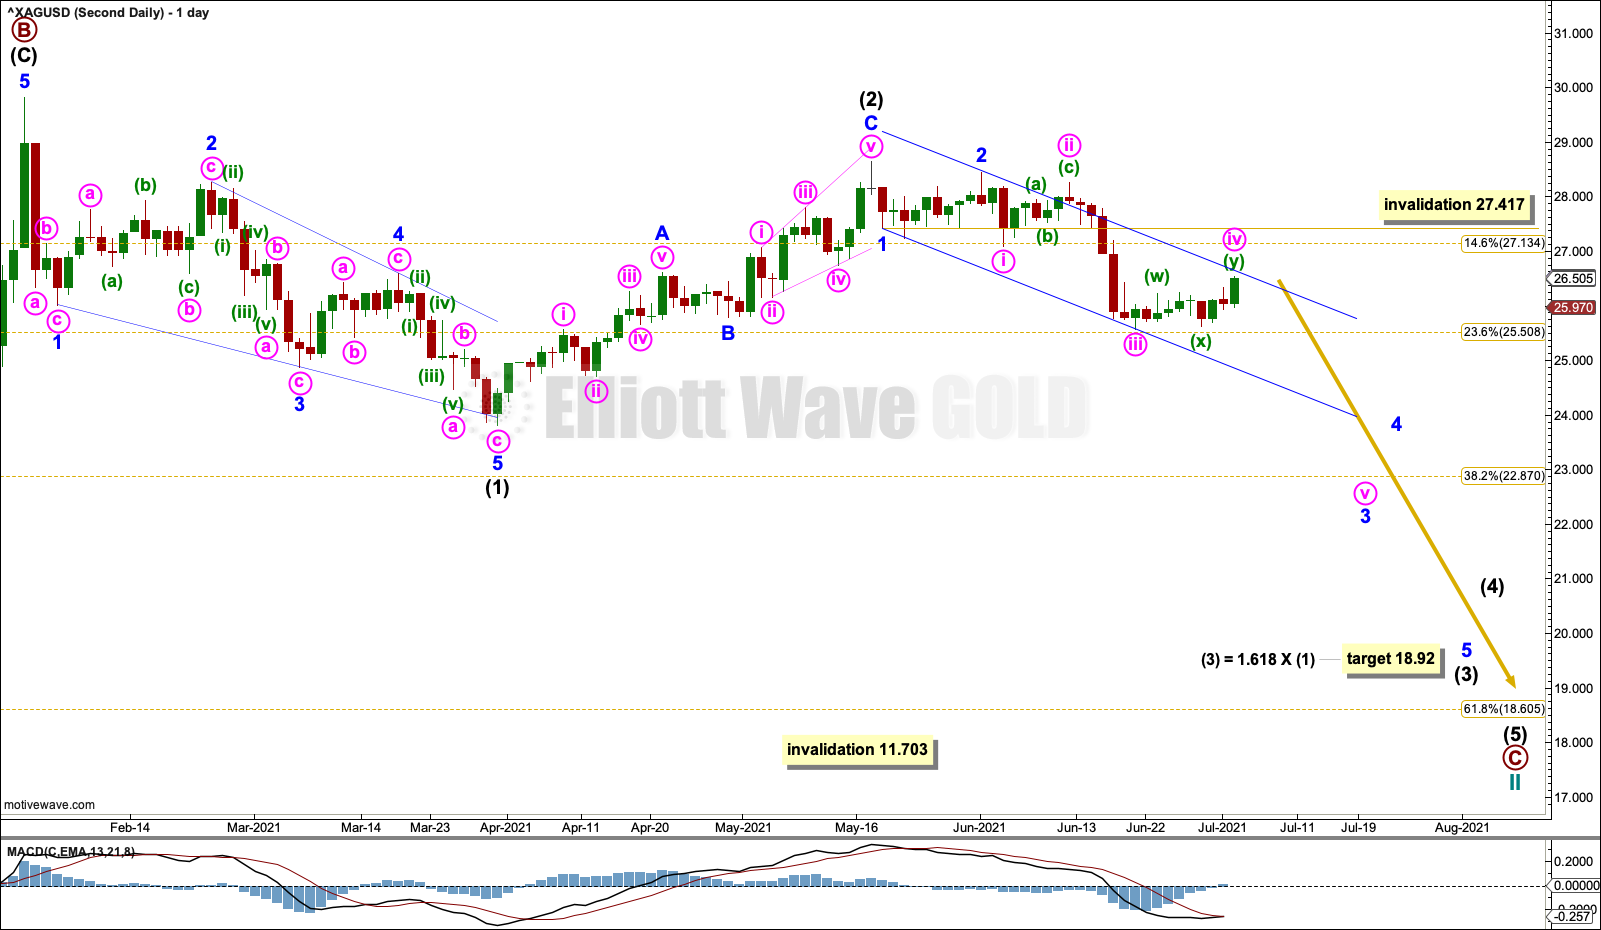
DAILY CHART
Click chart to enlarge.
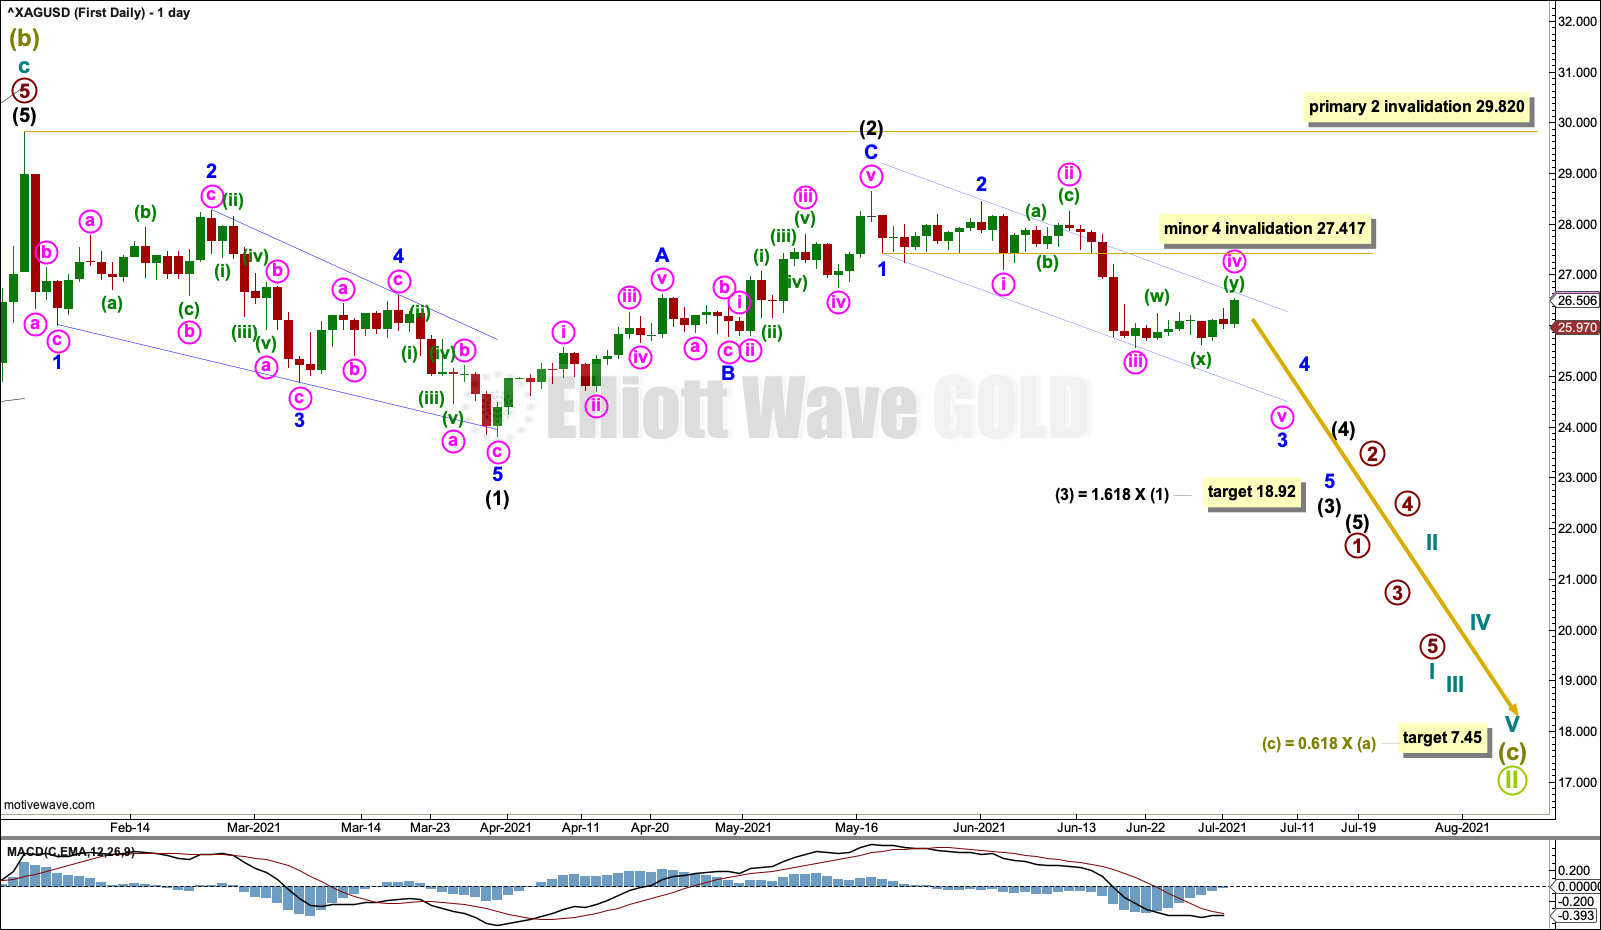
Super Cycle wave (c) downwards may be underway.
Neither intermediate wave (2), nor primary wave 2 nor cycle wave II within Super Cycle wave (c) may move beyond their start above 29.820.
It is possible that intermediate wave (1) was over at the last low as a leading contracting diagonal. The last bounce may be intermediate wave (2).
Following a diagonal in a first wave position, the second wave is commonly very deep. Intermediate wave (2) is a 0.8 depth of intermediate wave (1); this fits most common behaviour.
Draw a channel about the start of intermediate wave (3). Draw the first trend line from the end of minor wave 1 to the last low, then place a parallel copy on the end of minor wave 2. Keep redrawing the channel as price continues lower. Look for bounces to find resistance about the upper edge of the channel.
Within intermediate wave (3): Minor waves 1 and 2 may be complete, minor wave 3 may be extending and, when it arrives, minor wave 4 may not move into minor wave 1 price territory above 27.417.
SECOND ELLIOTT WAVE COUNT
MONTHLY CHART
Click chart to enlarge.
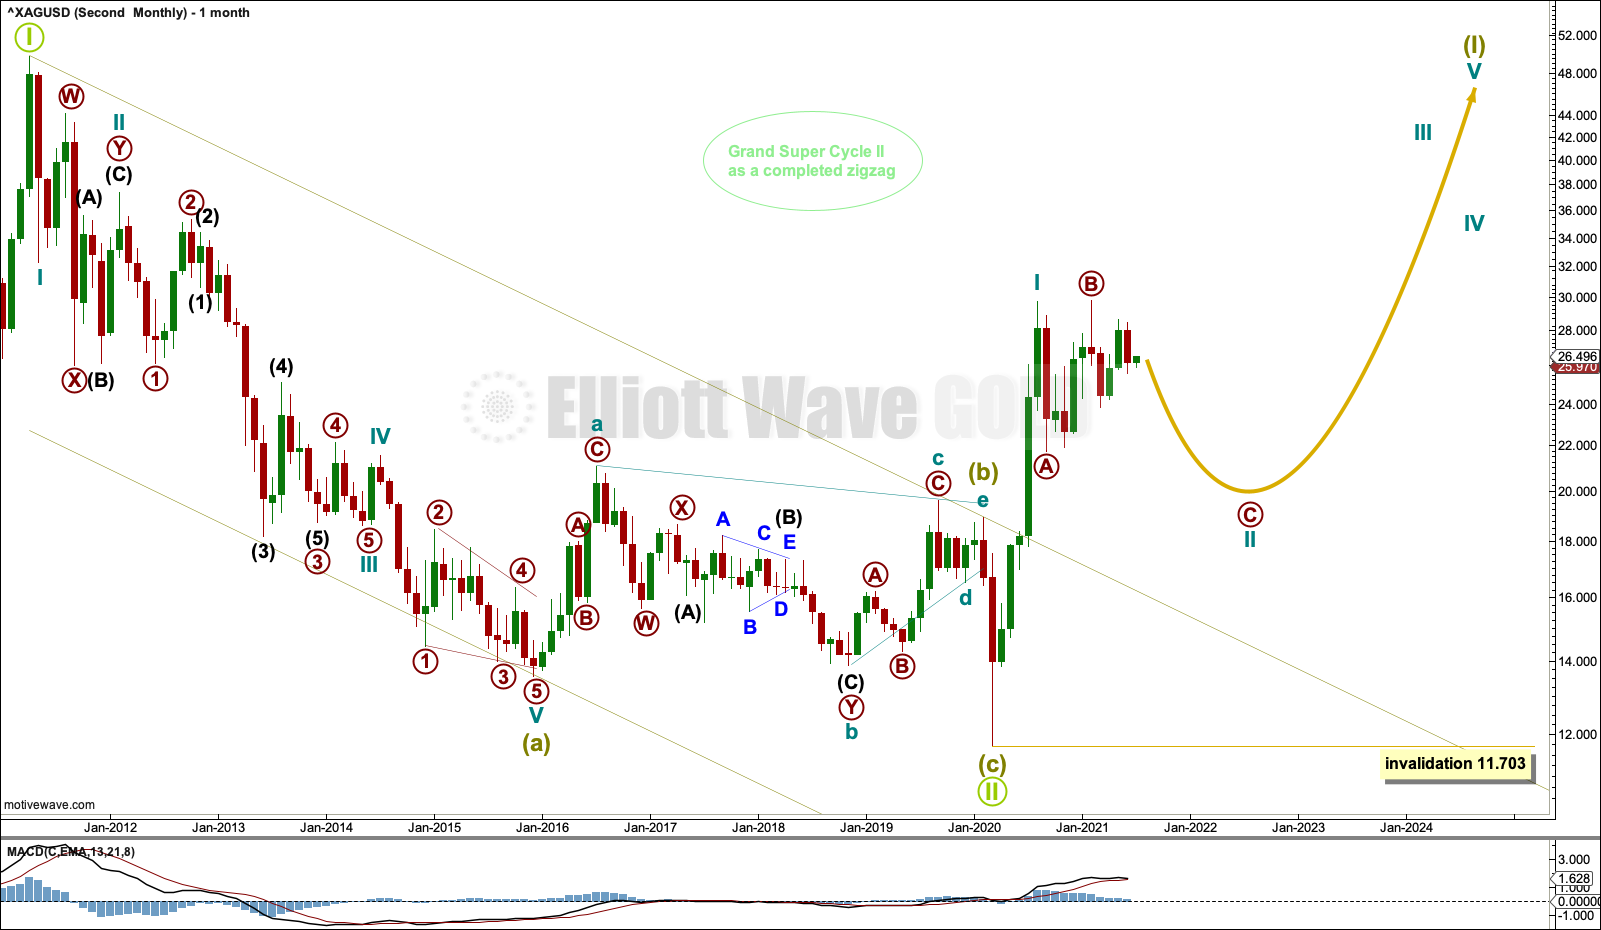
The bear market for Silver may be complete.
This Elliott wave structure for this bear market is labelled as a single zigzag for Grand Super Cycle wave II. Single zigzags are the most common Elliott wave corrective structure.
Within the zigzag: Super Cycle wave (a) subdivides as a five wave impulse, Super Cycle wave (b) subdivides as a complete regular contracting triangle, and Super Cycle wave (c) subdivides as a complete five wave impulse that is relatively brief and shallow.
Elliott wave triangles normally adhere strictly to their trend lines. The triangle for Super Cycle wave (b) does not; the lower b-d trend line is overshot, which reduces the probability of this wave count and is one reason for publication of the first wave count.
When charts are drawn on a semi-log scale, price has now breached the upper edge of the trend channel. Copy this channel over to weekly and daily charts. The upper edge of this channel may now provide support.
Grand Super Cycle wave III must subdivide as a five wave impulse at Super Cycle degree.
WEEKLY CHART
Click chart to enlarge.
The channel about Grand Super Cycle wave II is copied over from the monthly chart and extended outwards.
Cycle wave II may continue as a multi-month pullback. Cycle wave II may be subdividing as a regular flat. A likely point for cycle wave II to end may still be the 0.618 Fibonacci ratio of cycle wave I at 18.605. If this target is wrong, then it may not be low enough. The first major correction within a new trend is often very deep.
Cycle wave II may not move beyond the start of cycle wave I below 11.703.
DAILY CHART
Click chart to enlarge.
Primary wave B within the flat of cycle wave II is a 1.01 length of primary wave A. This is within the common range for B waves within flats of 1 to 1.38.
Primary wave C may now move lower for this wave count to at least make a slight new low below the end of primary wave A at 21.749 to avoid a truncation and a very rare running flat.
Within primary wave C: Intermediate wave (1) may be a complete leading contracting diagonal, and intermediate wave (2) may now be a complete zigzag. Following leading diagonals in first wave positions, second waves are commonly very deep.
Minor wave 4 within intermediate wave (3) may not move into minor wave 1 price territory above 27.417.
ALTERNATE WEEKLY CHART
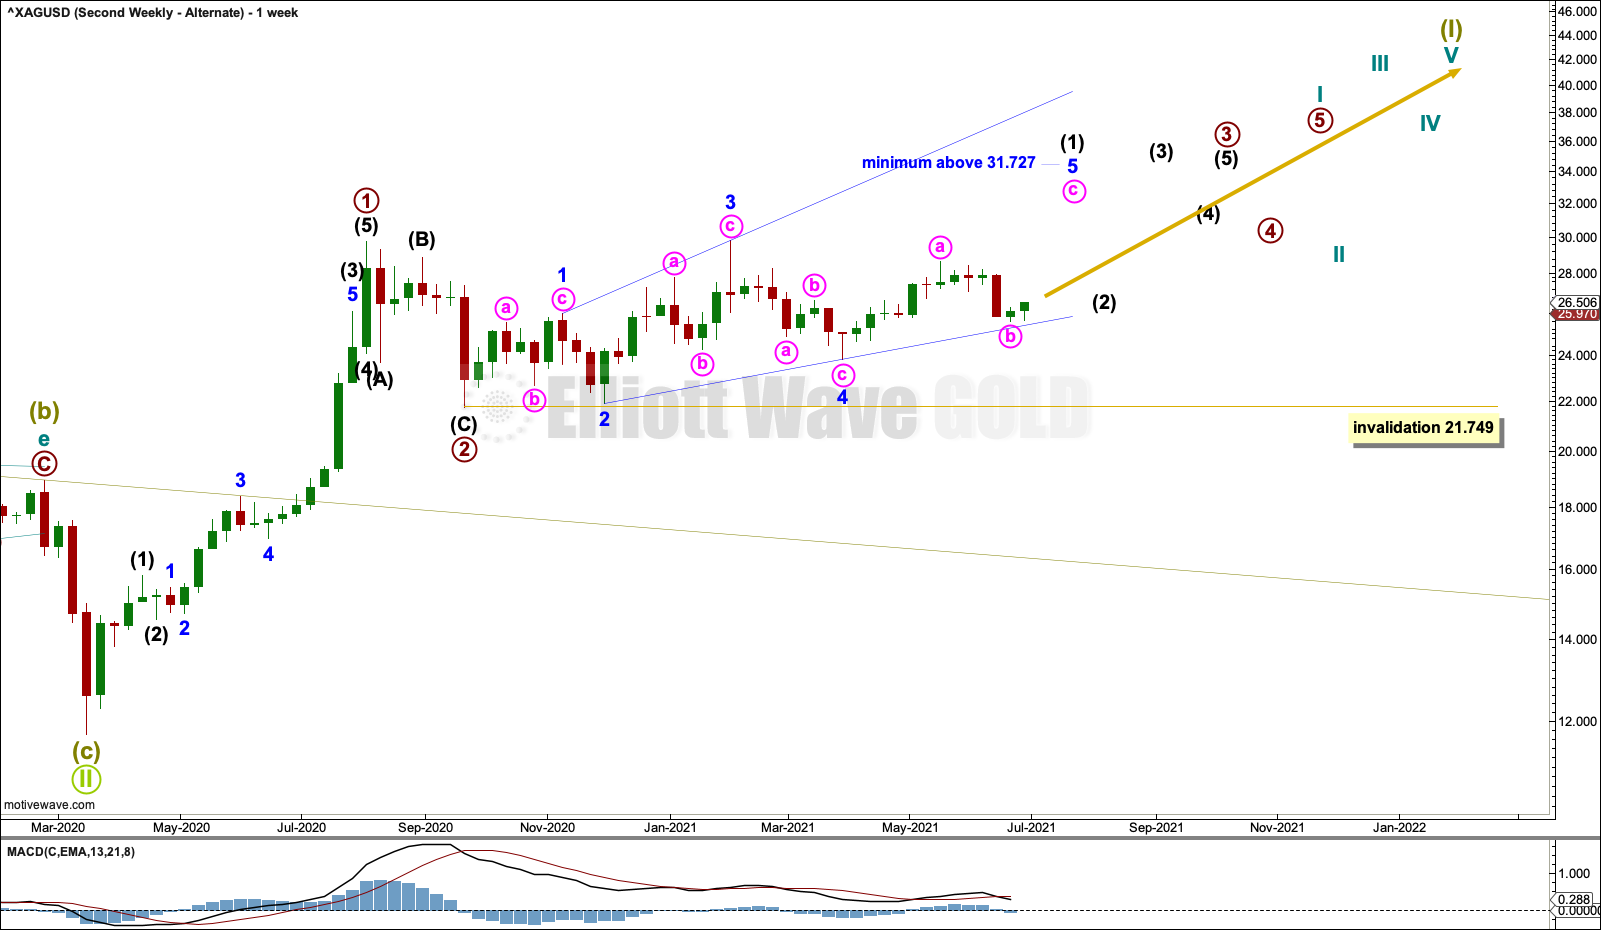
Click chart to enlarge.
This alternate Elliott wave count is the same as the second weekly chart to the low labelled Grand Super Cycle wave II. Thereafter, it looks at a more immediately bullish possibility.
Cycle wave I within Super Cycle wave (I) may be incomplete.
Within cycle wave I: Primary waves 1 and 2 may be complete, and primary wave 3 may be beginning with a leading expanding diagonal for intermediate wave (1).
Within the diagonal: Minor wave 3 is longer than minor wave 1, and minor wave 4 is longer than minor wave 2. The trend lines diverge; the diagonal is expanding. Minor wave 5 must be longer than minor wave 3 and must end above 31.727.
The final wave of minor wave 5 may be unfolding. The first, third and fifth waves within a leading diagonal most commonly subdivide as zigzags. Within minor wave 5: Minute wave a may be complete, and minute wave b may end at support at the lower diagonal trend line. Diagonal trend lines are normally strictly adhered to; if the lower trend line is breached, then this wave count would be discarded.
When the leading diagonal for intermediate wave (1) may be complete, then intermediate wave (2) may not move beyond the start of intermediate wave (1) below 21.749.
TECHNICAL ANALYSIS
WEEKLY CHART
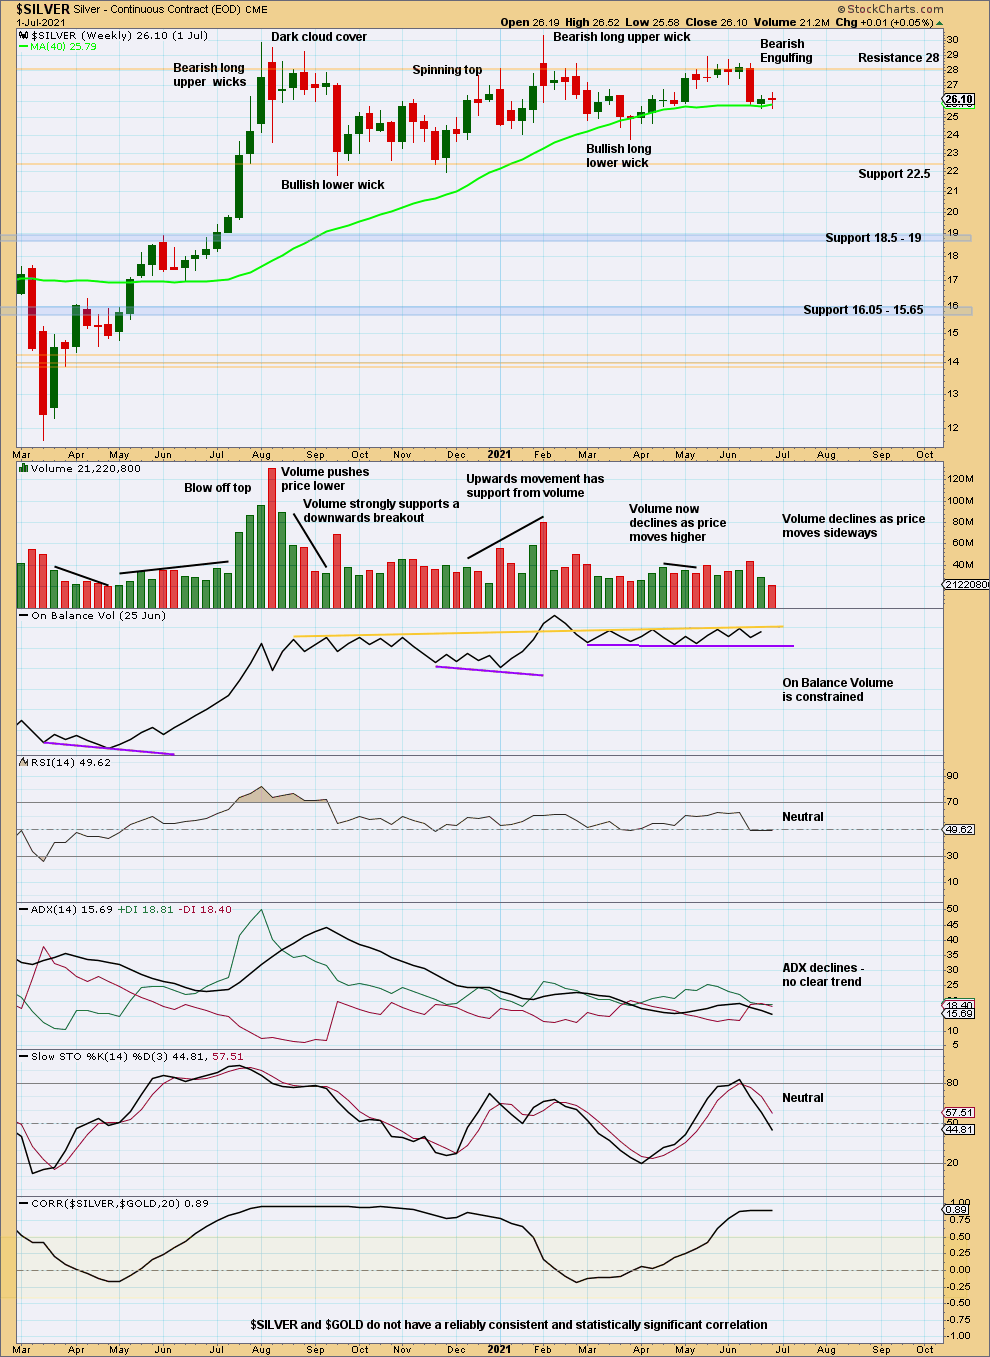
Click chart to enlarge. Chart courtesy of StockCharts.com.
The Bearish Engulfing pattern is very close to highs and has support from volume. This supports the first two Elliott wave counts.
DAILY CHART
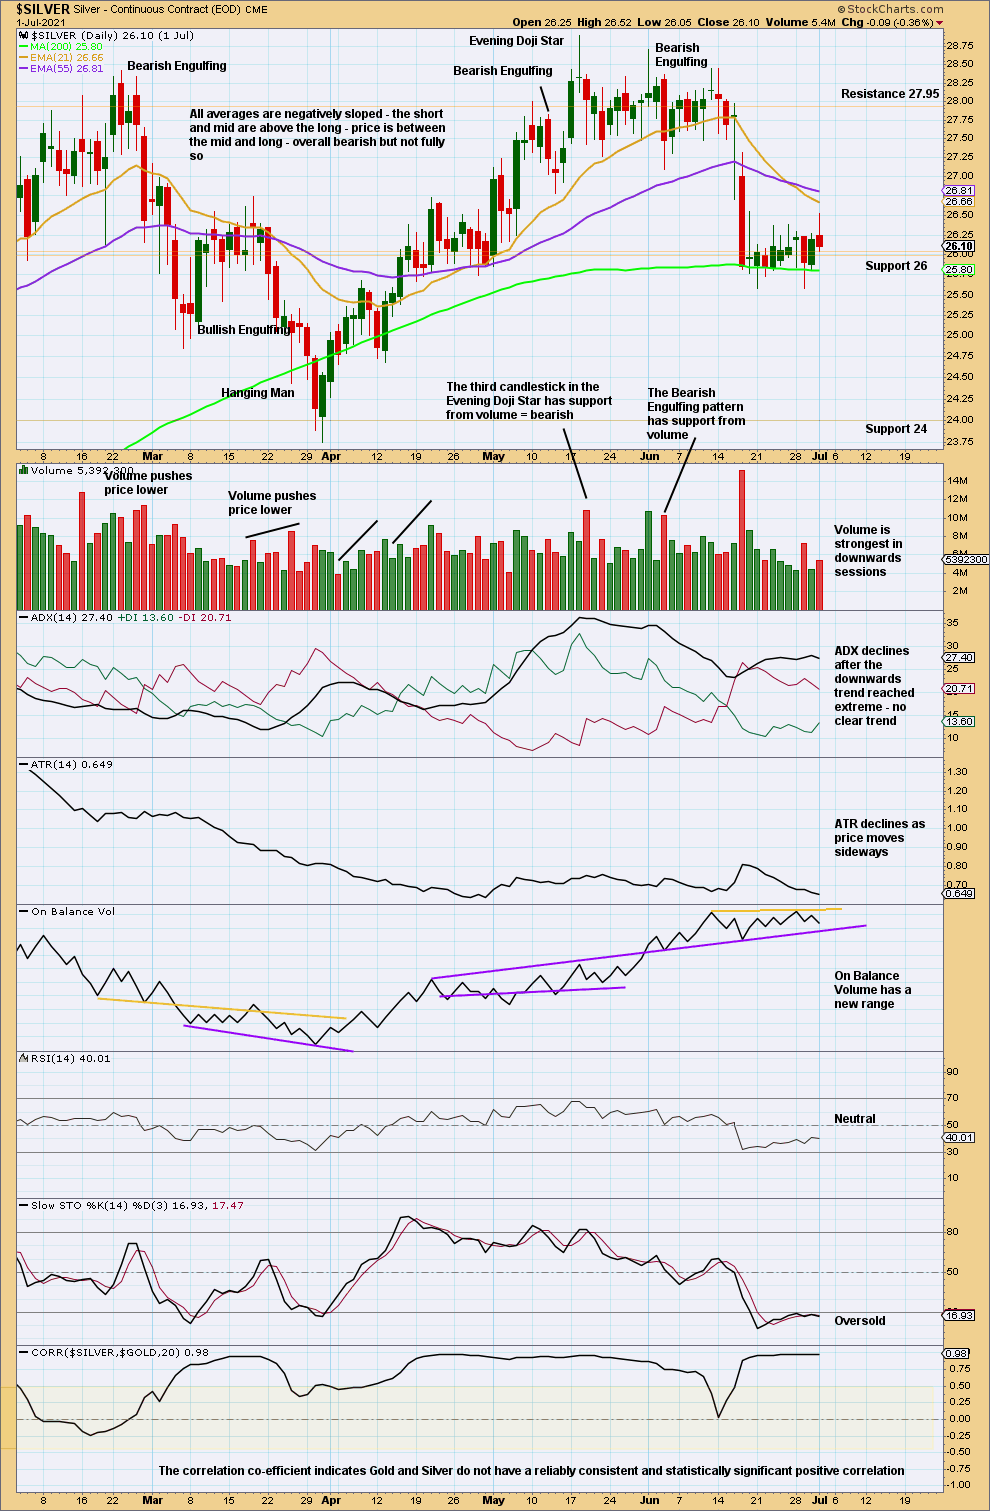
Click chart to enlarge. Chart courtesy of StockCharts.com.
The pennant pattern has failed, so it is removed.
Sideways movement of the last several sessions looks like a pause within an ongoing downwards trend.
Published @ 07:06 p.m. ET.
—
Careful risk management protects your trading account(s).
Follow my two Golden Rules:
1. Always trade with stops.
2. Risk only 1-5% of equity on any one trade.
—
New updates to this analysis are in bold.