
SILVER: Elliott Wave and Technical Analysis | Charts – July 29, 2021
Last analysis expected downwards movement from both Elliott wave counts, which is so far what is happening.
Summary: The first wave count is bearish for the mid and long term. A short-term target is at 18.92. A long-term target is at 7.45.
The second wave count is overall bullish at the monthly chart level.
The second wave count is bearish for the mid-term, expecting a pullback to about 18.605 before the bull market resumes.
ELLIOTT WAVE COUNTS
FIRST ELLIOTT WAVE COUNT
MONTHLY CHART
Click chart to enlarge.
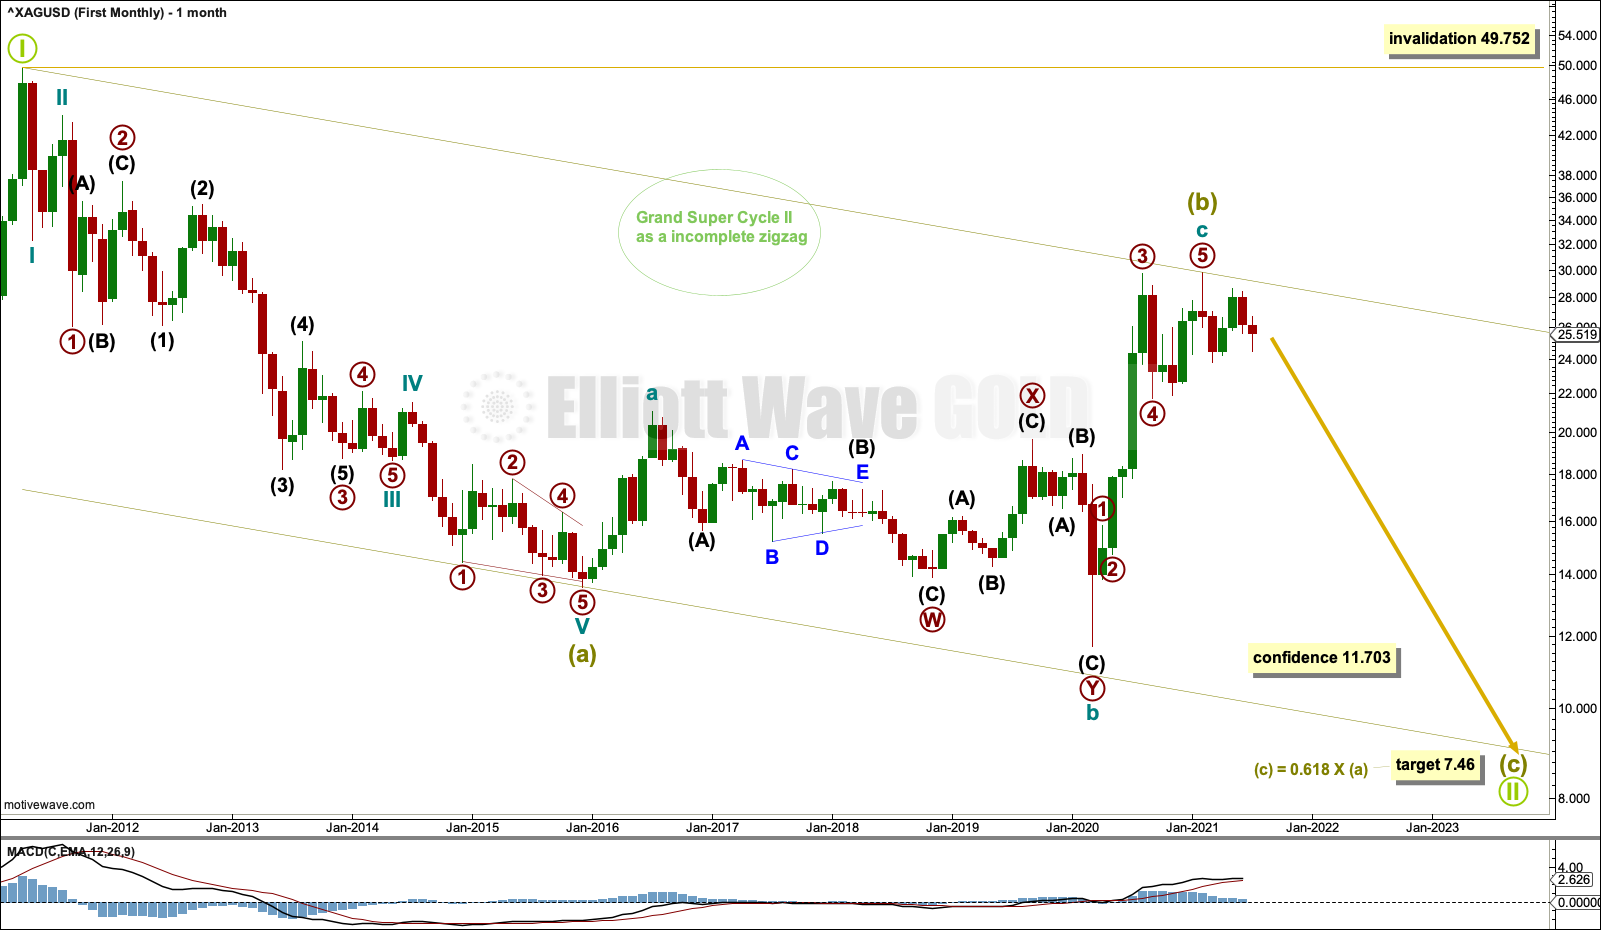
This first wave count has a better look in terms of Elliott wave structures.
It is possible that the zigzag for Grand Super Cycle wave II may be incomplete. Super Cycle wave (b) may be complete as an expanded flat correction.
Cycle wave b within the expanded flat of Super Cycle wave (b) is a 1.25 length of cycle wave a. This is within the most common range for B waves within flats of up to 1.38 times their counterpart A wave.
Cycle wave b within Super Cycle wave (b) subdivides as a double zigzag. This is a very common Elliott wave corrective structure, particularly in a B wave position. This part of the wave count has an excellent fit; all subdivisions are correct and the structures are common. This resolves the problem that the second wave count has of the triangle trend lines not being strictly adhered to.
If it continues further, then Super Cycle wave (b) may not move beyond the start of Super Cycle wave (a) above 49.752.
It is possible that Super Cycle wave (b) was complete at the last high and cycle wave c within it is a complete five wave impulse.
The disproportion between primary waves 2 and 4 within cycle wave c gives this part of the wave count the wrong look, but it should still be considered because Silver does not always exhibit good proportion.
WEEKLY CHART
Click chart to enlarge.
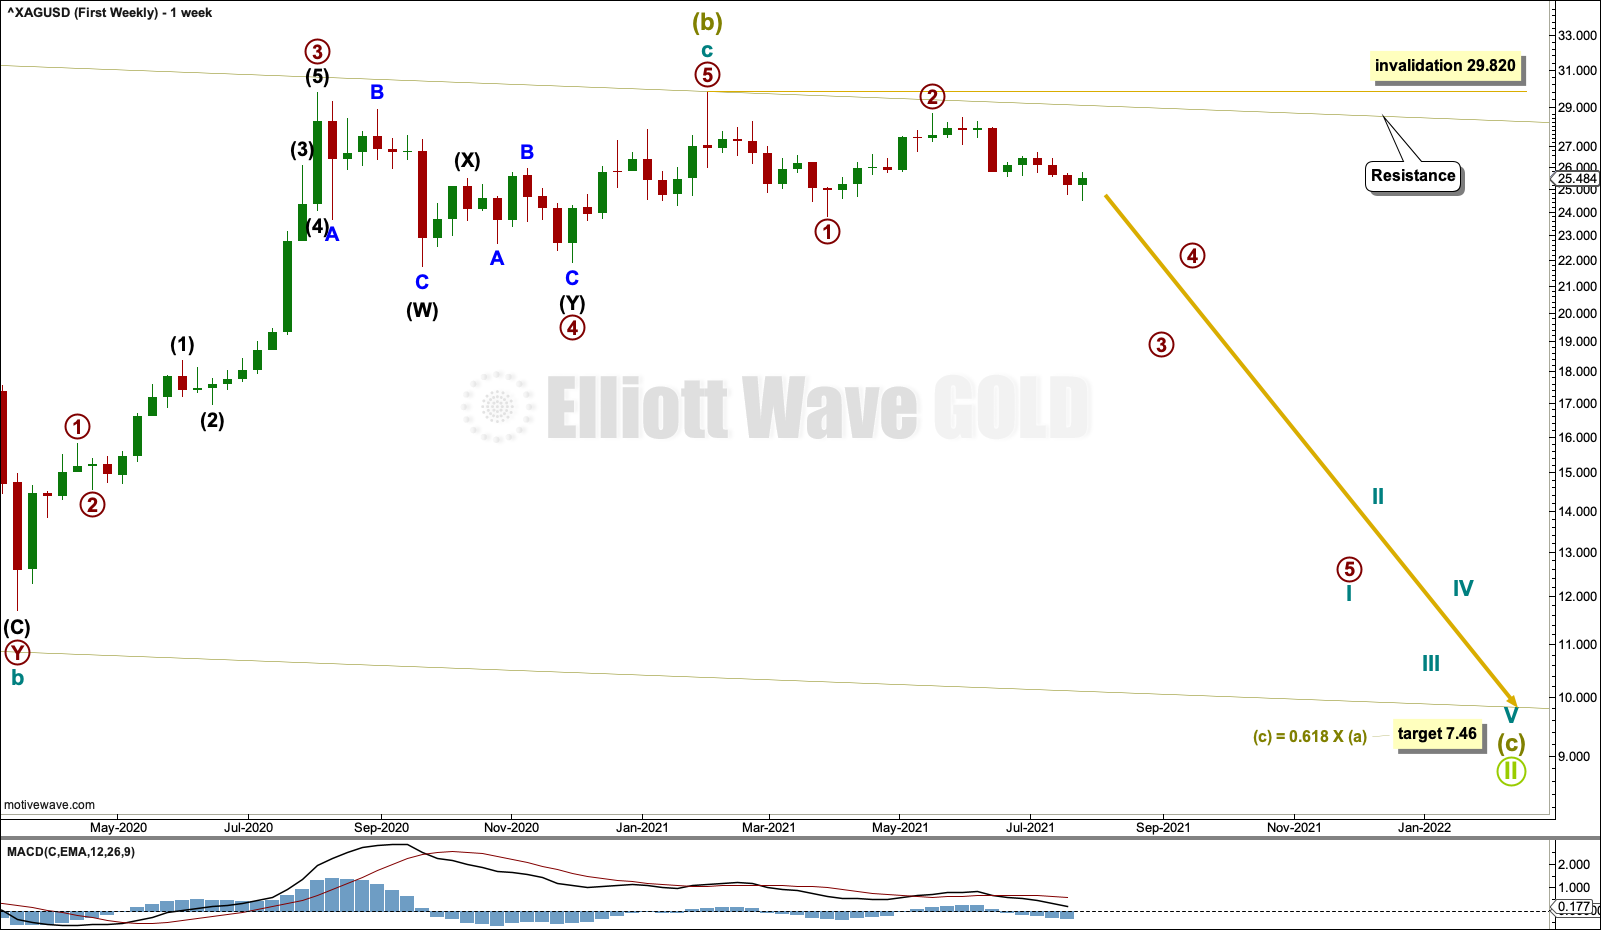
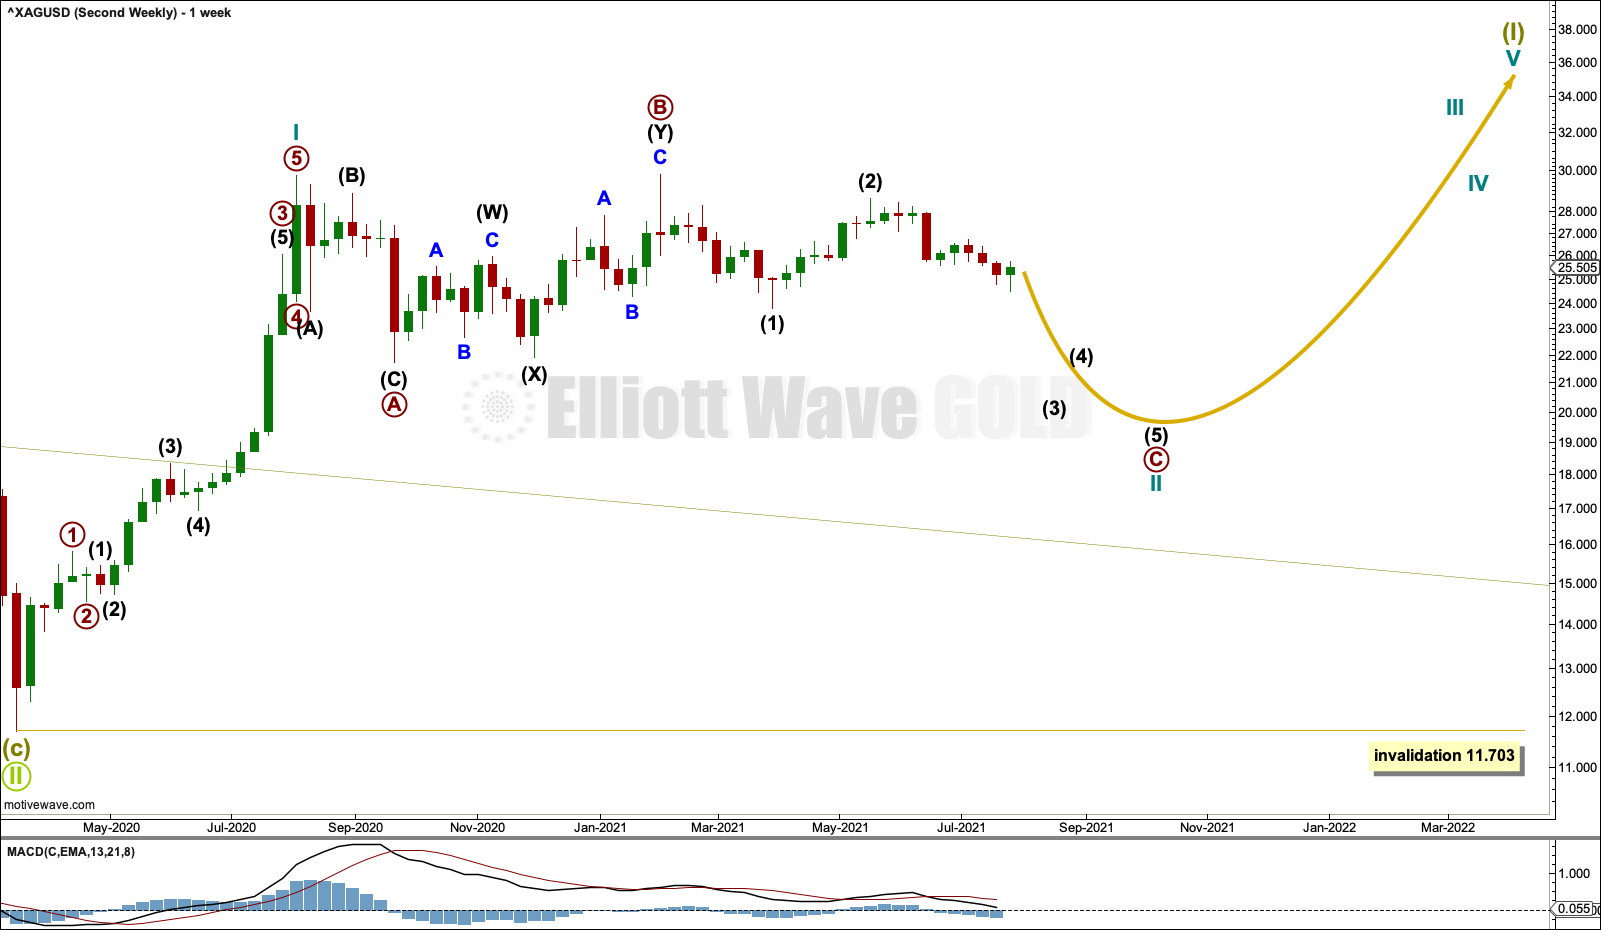
The degree of labelling within cycle wave I of Super Cycle wave (c) is today moved up one degree.
If Super Cycle wave (c) has begun, then it should move below the end of Super Cycle wave (a) at 13.569 to avoid a truncation. A target is calculated.
The large channel from the monthly chart is copied over to the weekly chart. Primary wave 2 may have found resistance just below the upper edge of this channel.
DAILY CHART
Click chart to enlarge.
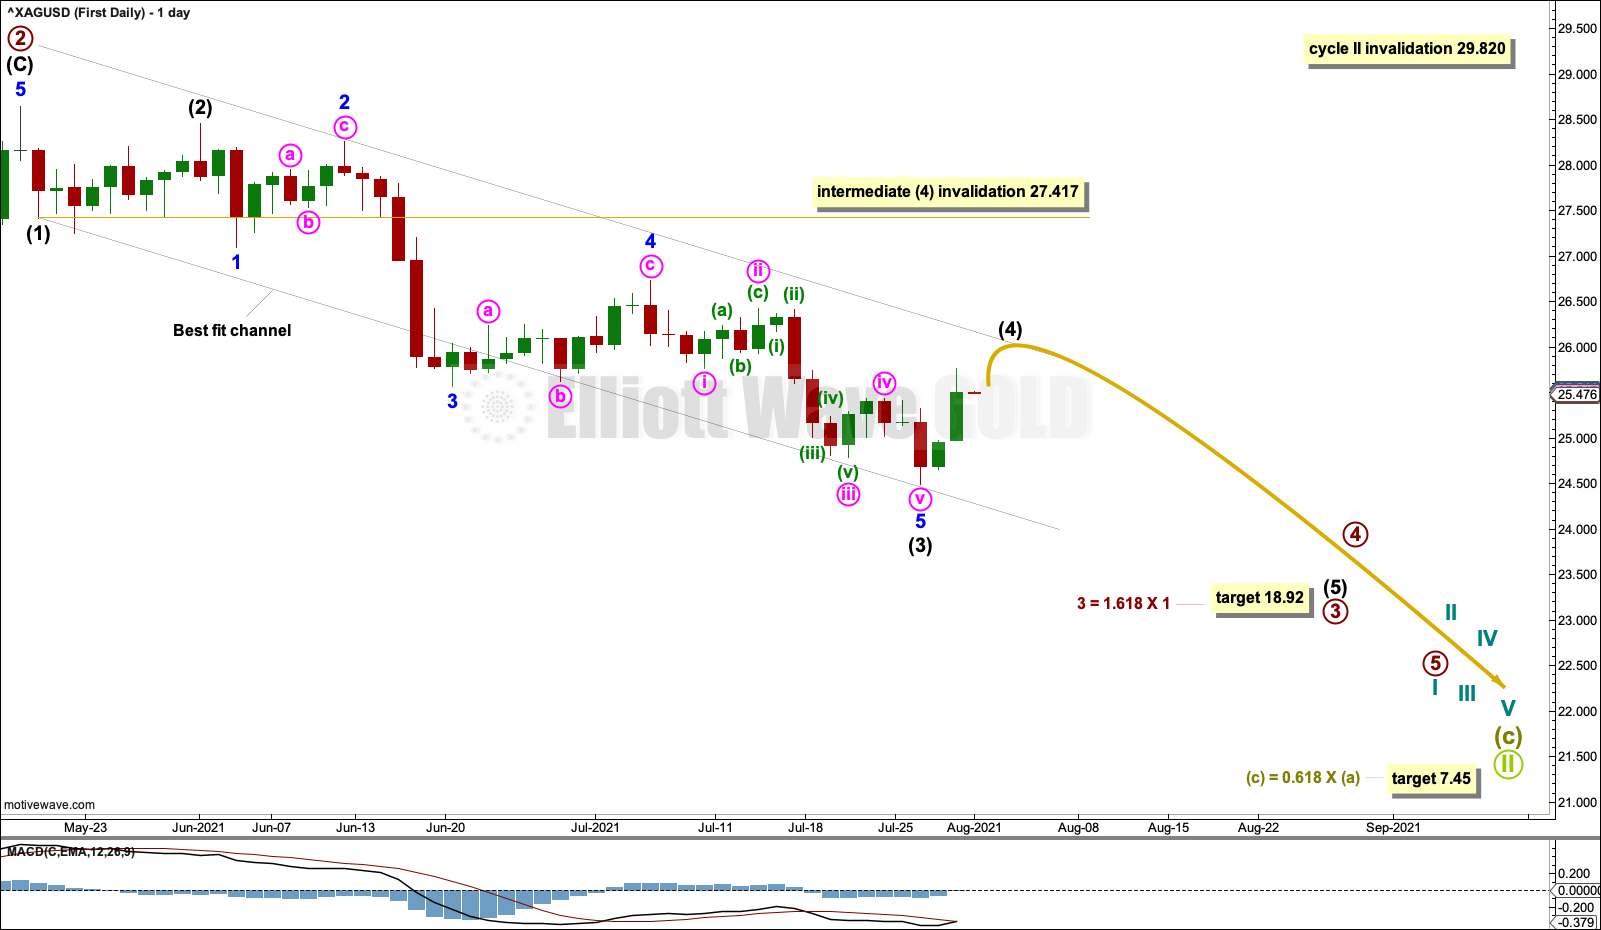
Super Cycle wave (c) downwards may be underway.
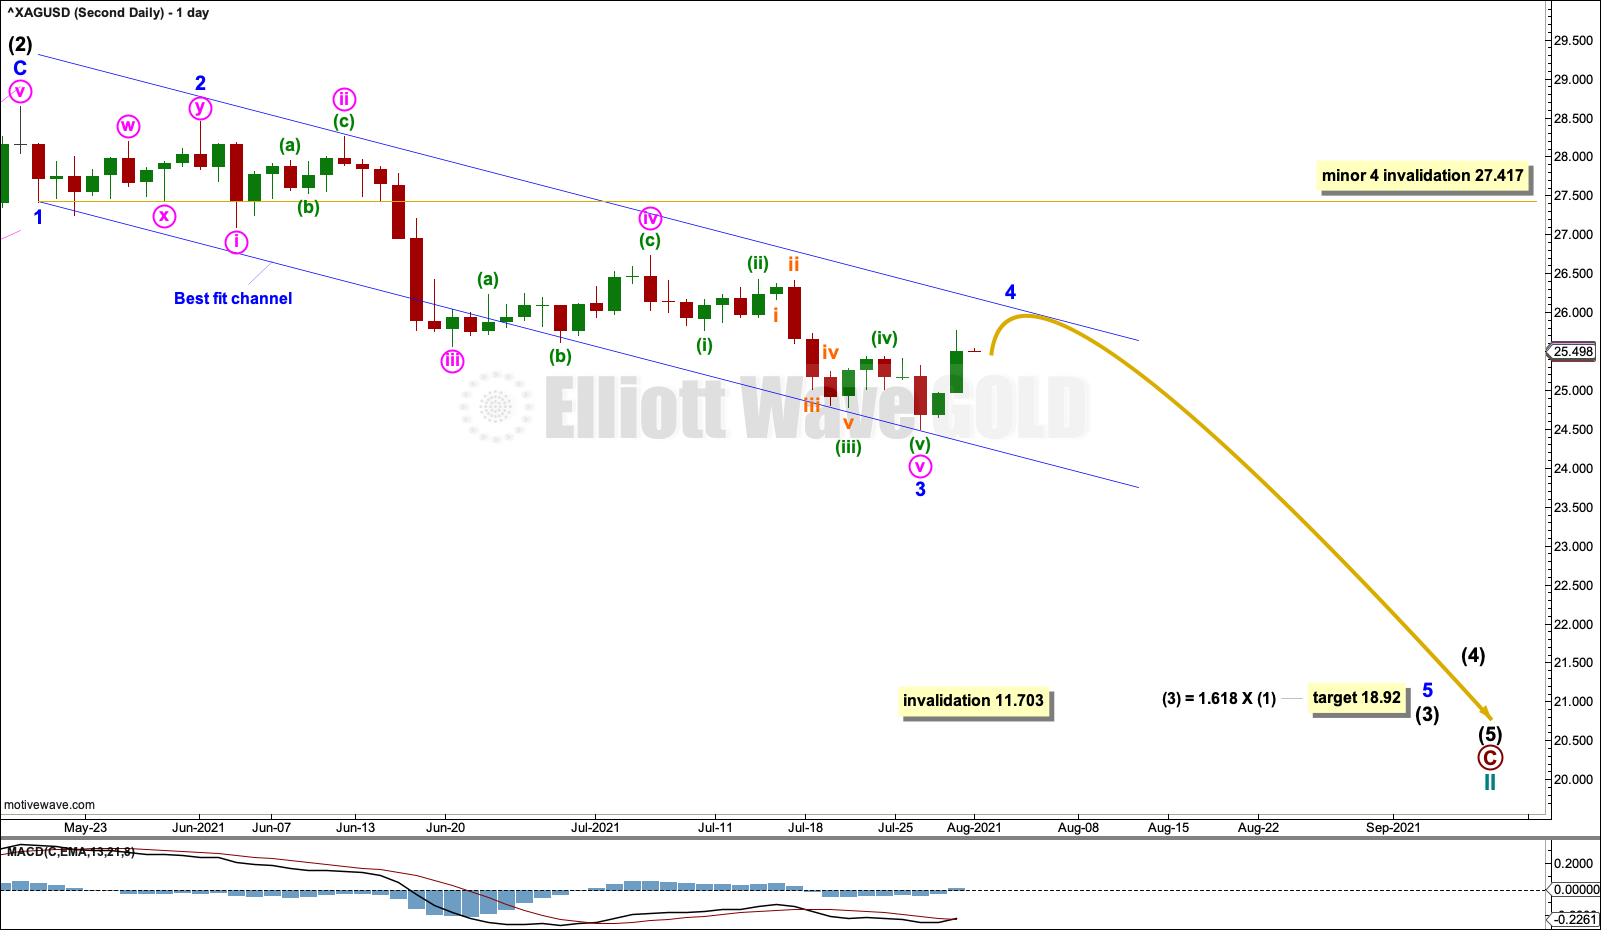
Primary wave 3 within cycle wave I may have begun at the high on May 19th.
Primary wave 3 may only subdivide as an impulse. Within the impulse: Intermediate waves (1), (2) and (3) may be complete, and intermediate wave (4) may not move into intermediate wave (1) price territory above 27.417. Intermediate wave (4) may end about resistance at the upper edge of the best fit channel.
Intermediate wave (5) may end about support at the lower edge of the channel.
SECOND ELLIOTT WAVE COUNT
MONTHLY CHART
Click chart to enlarge.
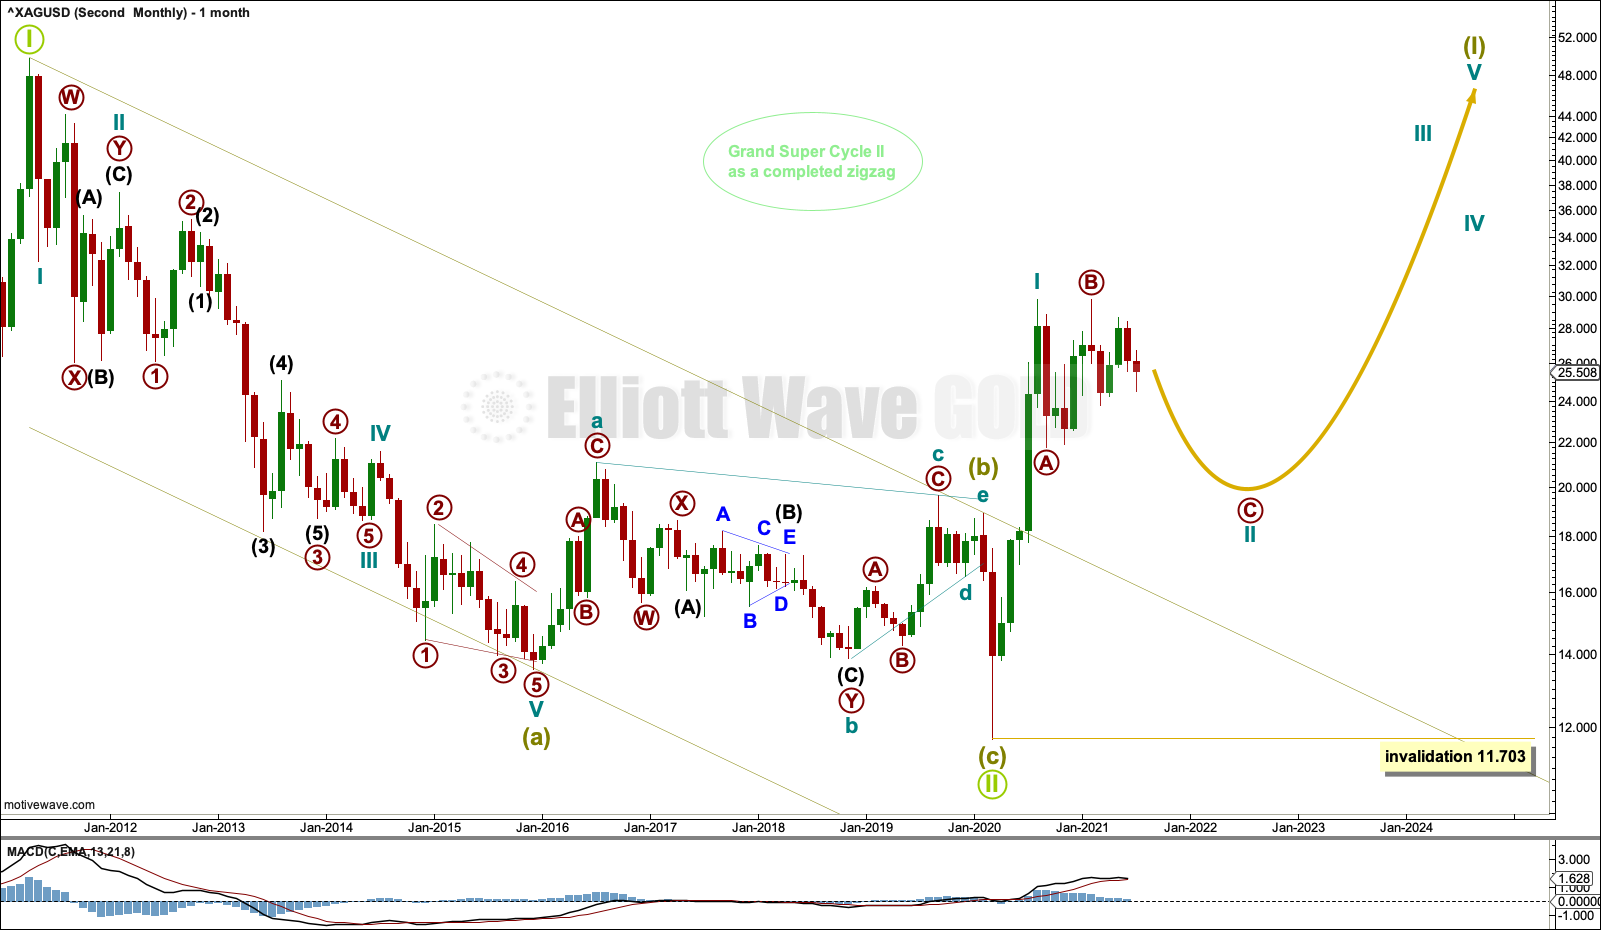
The bear market for Silver may be complete.
This Elliott wave structure for this bear market is labelled as a single zigzag for Grand Super Cycle wave II. Single zigzags are the most common Elliott wave corrective structure.
Within the zigzag: Super Cycle wave (a) subdivides as a five wave impulse, Super Cycle wave (b) subdivides as a complete regular contracting triangle, and Super Cycle wave (c) subdivides as a complete five wave impulse that is relatively brief and shallow.
Elliott wave triangles normally adhere strictly to their trend lines. The triangle for Super Cycle wave (b) does not; the lower b-d trend line is overshot, which reduces the probability of this wave count and is one reason for publication of the first wave count.
When charts are drawn on a semi-log scale, price has now breached the upper edge of the trend channel. Copy this channel over to weekly and daily charts. The upper edge of this channel may now provide support.
Grand Super Cycle wave III must subdivide as a five wave impulse at Super Cycle degree.
WEEKLY CHART
Click chart to enlarge.
The channel about Grand Super Cycle wave II is copied over from the monthly chart and extended outwards.
Cycle wave II may continue as a multi-month pullback. Cycle wave II may be subdividing as a regular flat. A likely point for cycle wave II to end may still be the 0.618 Fibonacci ratio of cycle wave I at 18.605. If this target is wrong, then it may not be low enough. The first major correction within a new trend is often very deep.
Primary wave B within the flat of cycle wave II is a 1.01 length of primary wave A. This is within the common range for B waves within flats of 1 to 1.38.
Primary wave C may now move lower for this wave count to at least make a slight new low below the end of primary wave A at 21.749 to avoid a truncation and a very rare running flat.
Cycle wave II may not move beyond the start of cycle wave I below 11.703.
DAILY CHART
Click chart to enlarge.
Within primary wave C: Intermediate waves (1) and (2) may now be complete, and intermediate wave (3) may only subdivide as an impulse.
Within the impulse of intermediate wave (3): Minor waves 1, 2 and 3 may be complete, and minor wave 4 may not move into minor wave 1 price territory above 27.417.
Minor wave 4 may end about resistance at the upper edge of the channel. Minor wave 5 may end about support at the lower edge of the channel.
TECHNICAL ANALYSIS
WEEKLY CHART
Click chart to enlarge. Chart courtesy of StockCharts.com.
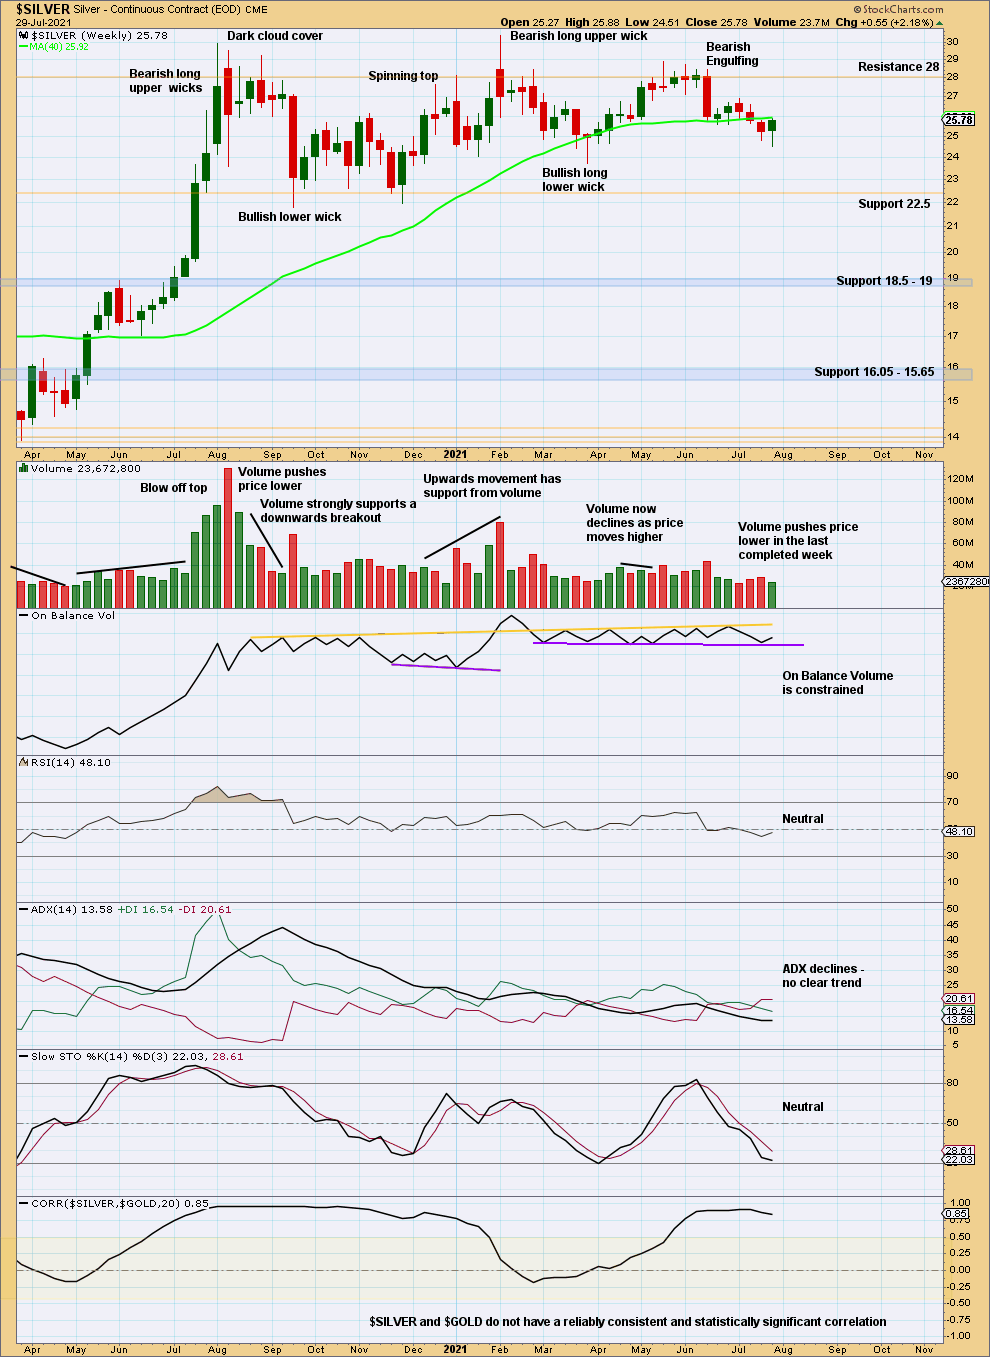
The Bearish Engulfing pattern is very close to highs and has support from volume. This supports the Elliott wave counts. Now two downwards weeks in a row have push from volume.
DAILY CHART
Click chart to enlarge. Chart courtesy of StockCharts.com.
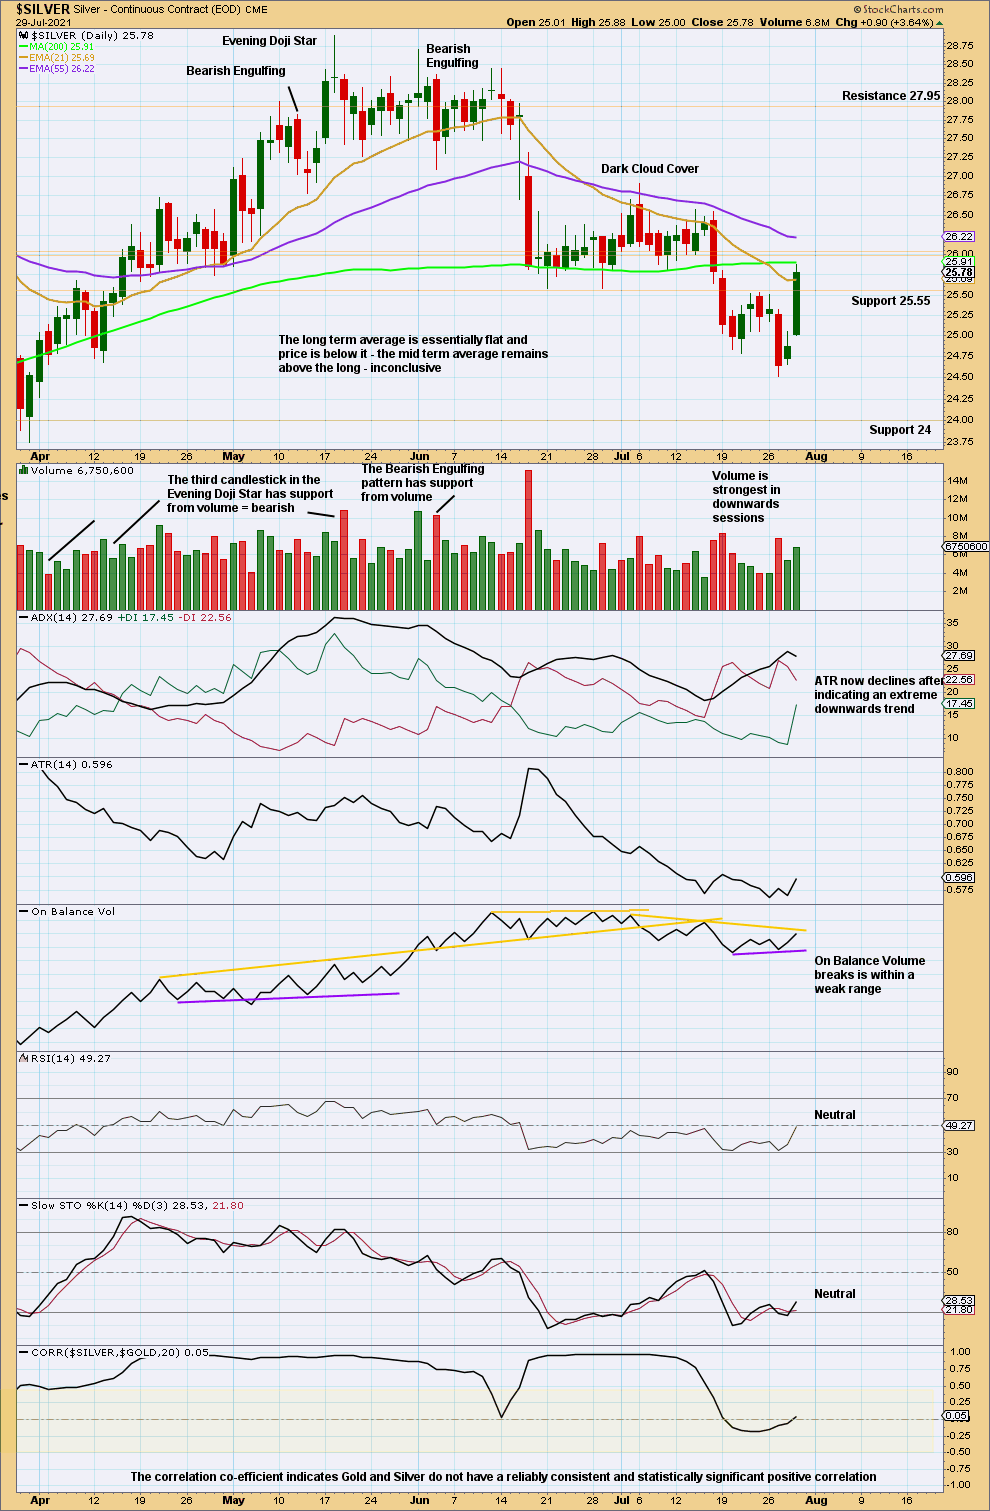
The downwards trend may be interrupted here by a more sustained bounce. Look for price to reach resistance and Stochastics to reach overbought.
Published @ 08:44 p.m. ET.
—
Careful risk management protects your trading account(s).
Follow my two Golden Rules:
1. Always trade with stops.
2. Risk only 1-5% of equity on any one trade.
—
New updates to this analysis are in bold.