
US OIL: Elliott Wave and Technical Analysis | Charts – July 2, 2021
Upwards movement continues towards targets as expected.
Summary: The Elliott wave count expects upwards movement to continue to a short-term target at 76.91, with a longer term target at 87.90.
Oil may have found a major sustainable low in April 2020.
ELLIOTT WAVE COUNT
MONTHLY CHART
Click chart to enlarge.
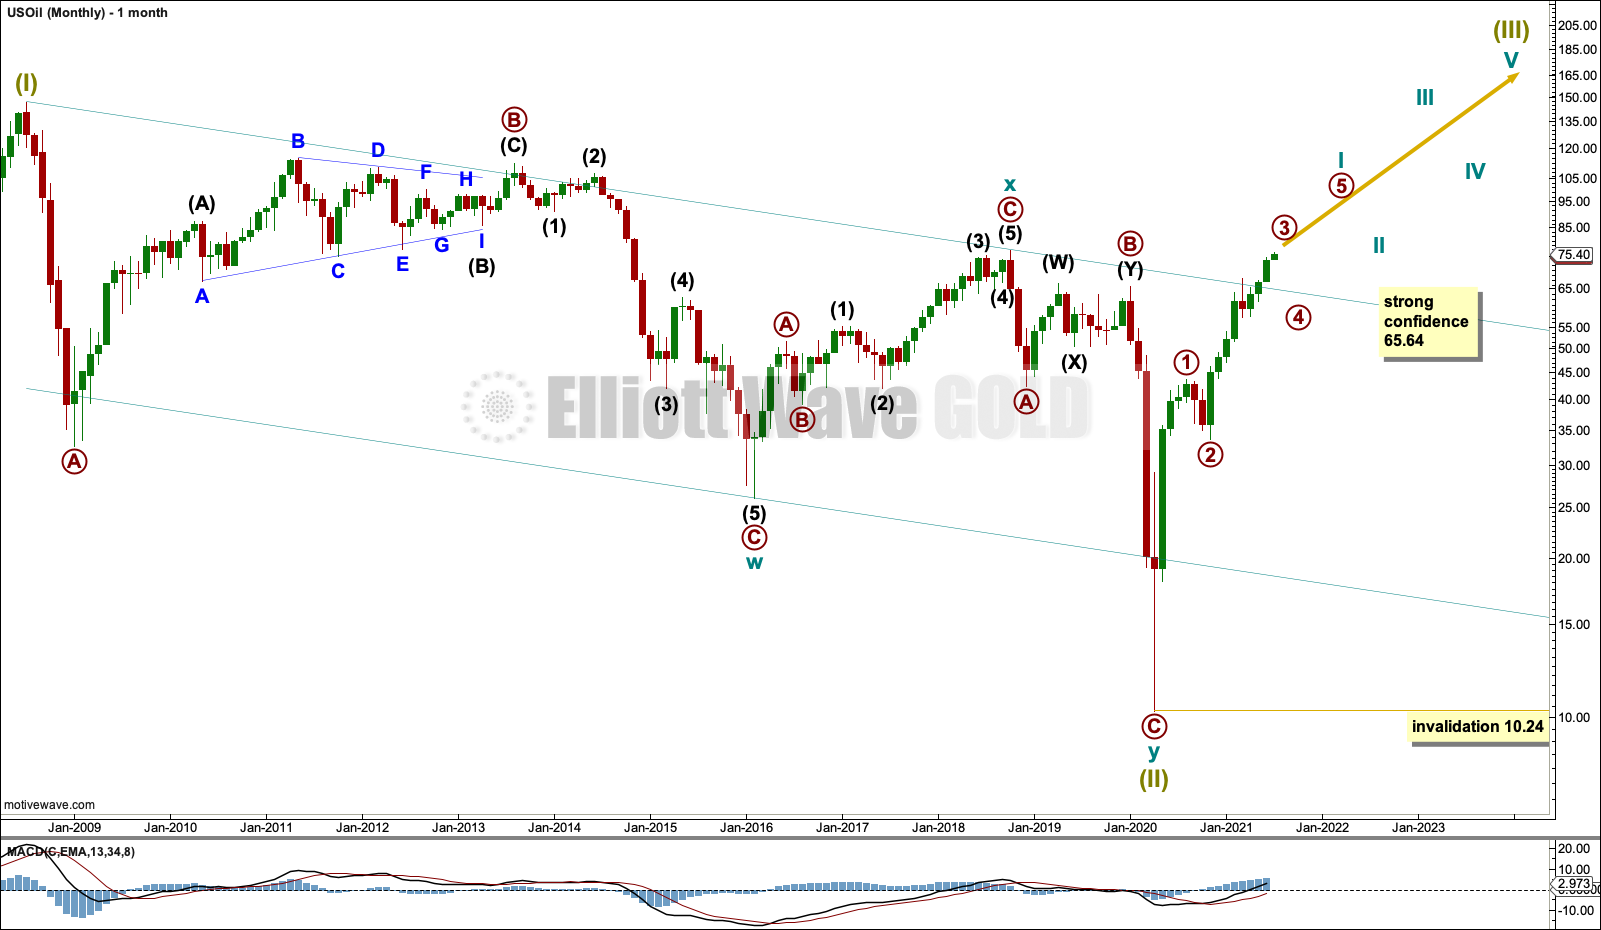
The basic Elliott wave structure is five steps forward and three steps back. This Elliott wave count expects that US Oil has completed a three steps back pattern, which began in July 2008. The Elliott wave count expects that the bear market for US Oil may now be over.
Following Super Cycle wave (II), which was a correction (three steps back), Super Cycle wave (III), which may have begun, should be five steps up when complete. Super Cycle wave (III) may last a generation and must make a new high above the end of Super Cycle wave (I) at 146.73.
A channel is drawn about Super Cycle wave (II): draw the first trend line from the start of cycle wave w to the end of cycle wave x, then place a parallel copy on the end of cycle wave w. This trend line is breached to the downside, which is a typical look for the end of a movement for a commodity.
The upper edge of the channel may provide resistance. Price is reacting down from the upper edge of this channel.
Super Cycle wave (III) may only subdivide as a five wave impulse. New trends for Oil usually start out very slowly with short first waves and deep time consuming second wave corrections. However, while this is a common tendency, it is not always seen and may not have been seen in this instance. The first reasonably sized pullback may be over already.
WEEKLY CHART
Click chart to enlarge.
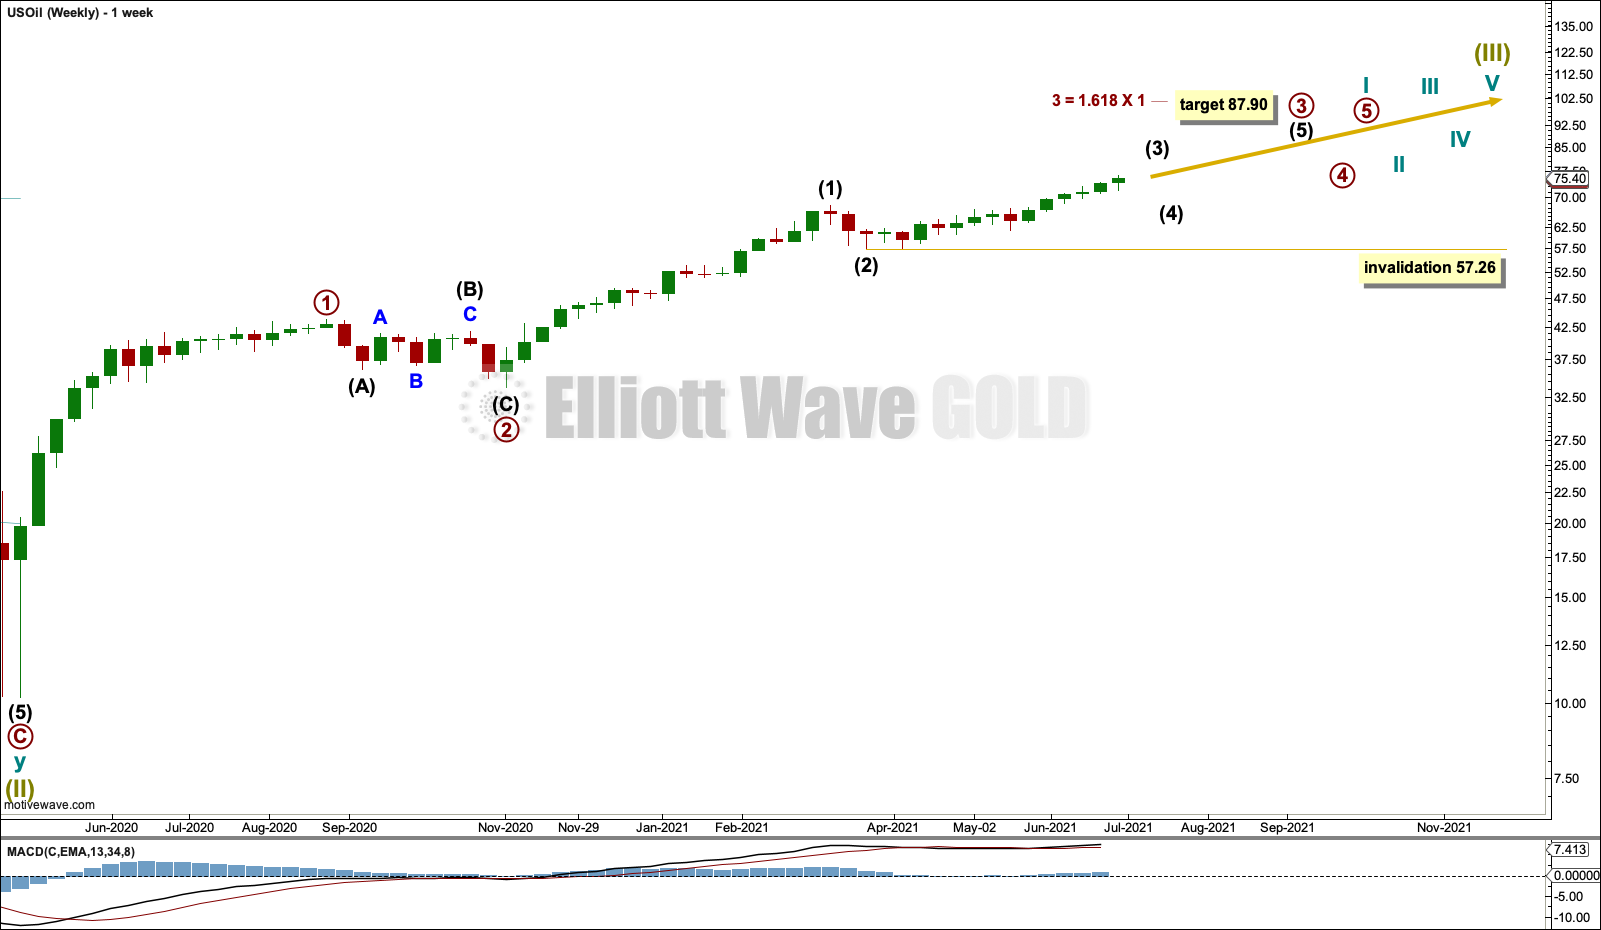
Super Cycle wave (III) must subdivide as an impulse.
Cycle wave I within Super Cycle wave (III) may be incomplete.
Within cycle wave I: Primary waves 1 and 2 may be complete, and primary wave 3, which may only subdivide as an impulse, may be underway.
Within primary wave 3: Intermediate waves (1) and (2) may be complete. No second wave correction within intermediate wave (3) may move beyond its start below 57.26.
DAILY CHART
Click chart to enlarge.
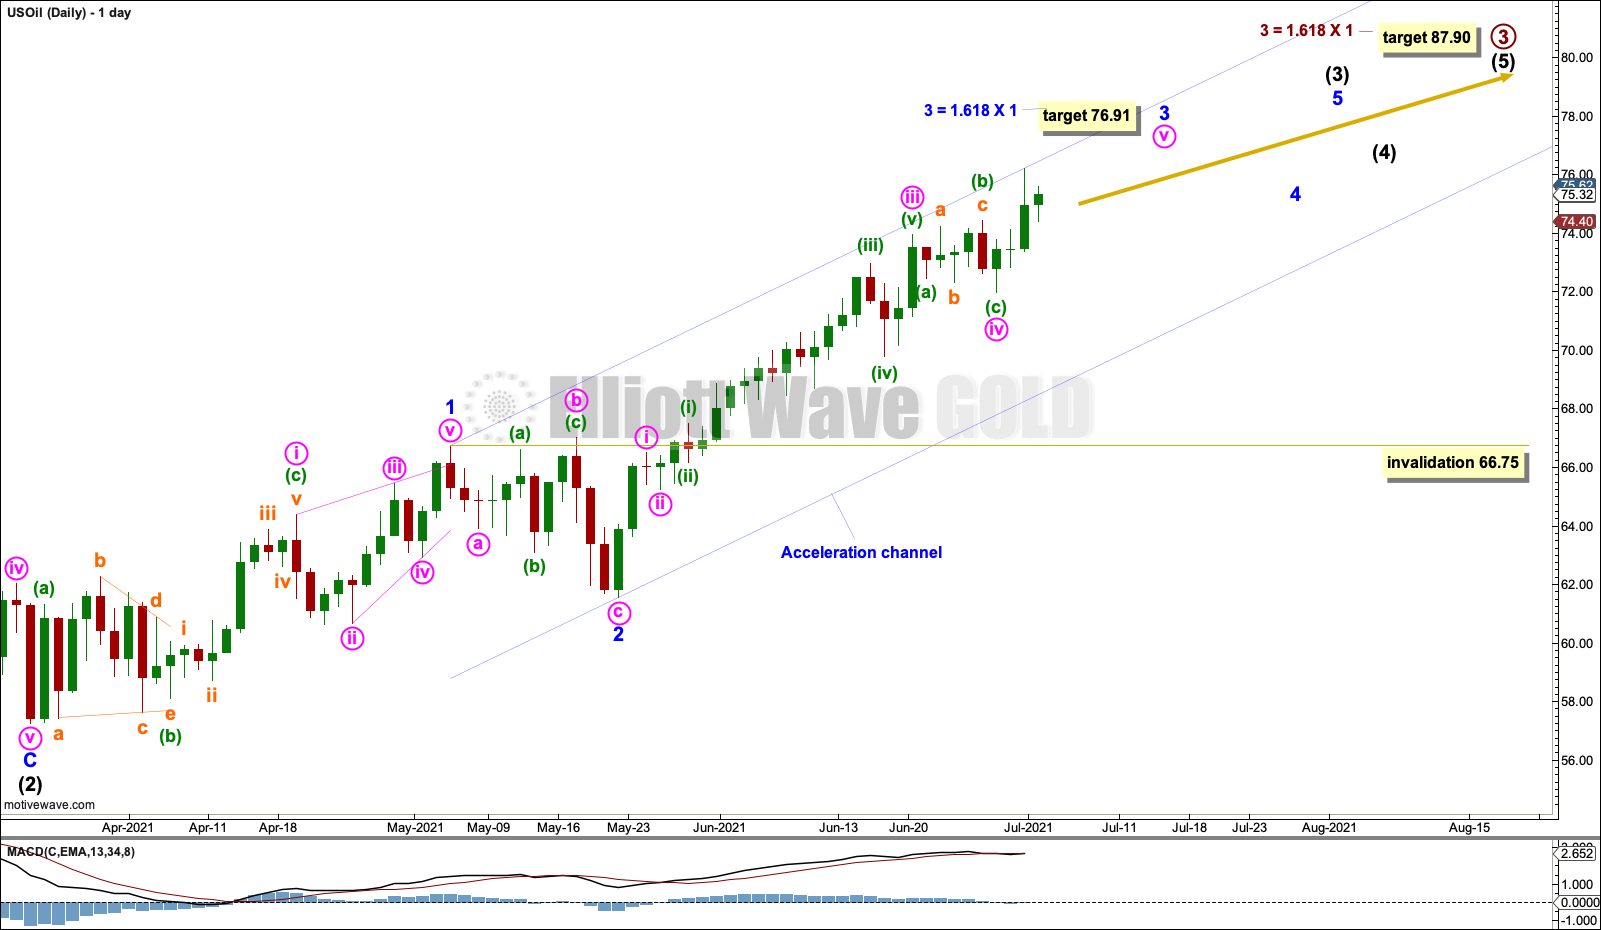
If intermediate wave (3) has begun, then minor wave 1 within it may be a complete leading contracting diagonal. Following a leading diagonal in a first wave position, the second wave correction is usually very deep. Minor wave 2 is a 0.55 depth of minor wave 1.
When a first wave subdivides as a leading diagonal, then the third wave is almost always extended. The target expects this common scenario.
A target is calculated for minor wave 3 that expects it to exhibit a common Fibonacci ratio to minor wave 1. Minor wave 4 may not move into minor wave 1 price territory below 66.75.
Draw an acceleration channel about intermediate wave (3). Draw the first trend line from the end of minor wave 1 to the last high, then place a parallel copy on the end of minor wave 2. Keep redrawing the channel as price continues higher. When minor wave 3 may be over, then this channel would be drawn using Elliott’s first technique and may show were minor wave 4 may find support.
ALTERNATE DAILY CHART
Click chart to enlarge.
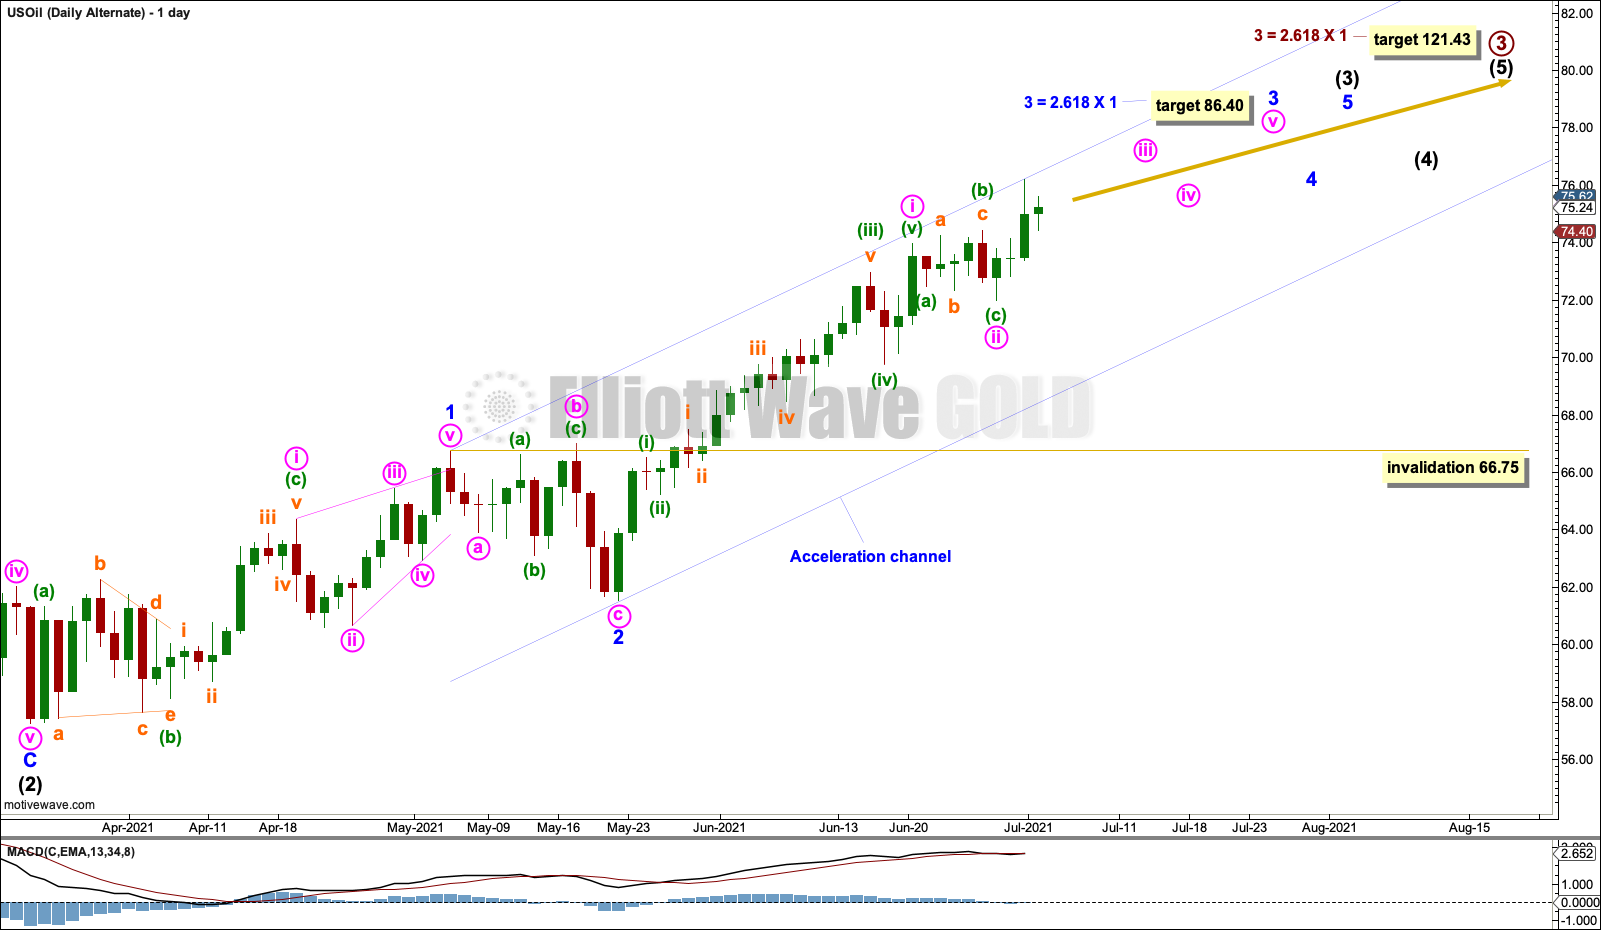
This alternate daily chart is the same as the main daily chart up to the low labelled minor wave 2,. Thereafter, it sees subdivisions within minor wave 3 differently.
Minor wave 3 may be a longer extension. Targets for this alternate use the Fibonacci ratio 2.618.
Only minute wave i within minor wave 3 may be complete.
This wave count is very bullish. It expects a third wave at minor, intermediate and primary degree may have just begun. A strong increase in upwards momentum may be expected if this wave count is correct.
Minor wave 4 may not move into minor wave 1 price territory below 66.75.
TECHNICAL ANALYSIS
WEEKLY CHART
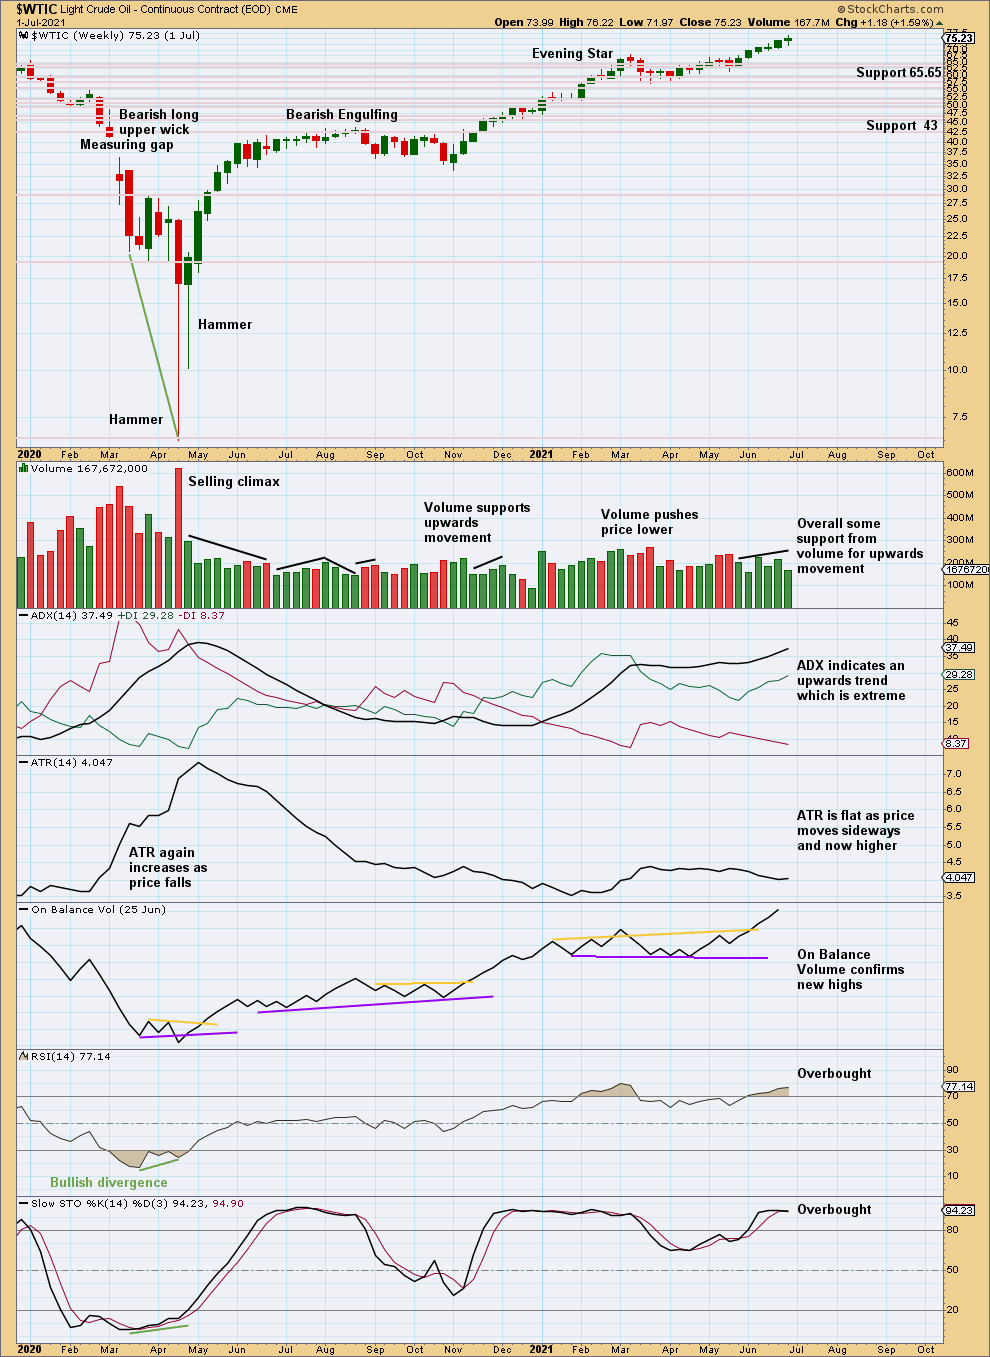
Click chart to enlarge. Chart courtesy of StockCharts.com.
This market can sustain extreme trends for a reasonable period of time. Despite weak bearish divergence between price and RSI, price continues higher. Divergence is weakening even further this week.
DAILY CHART
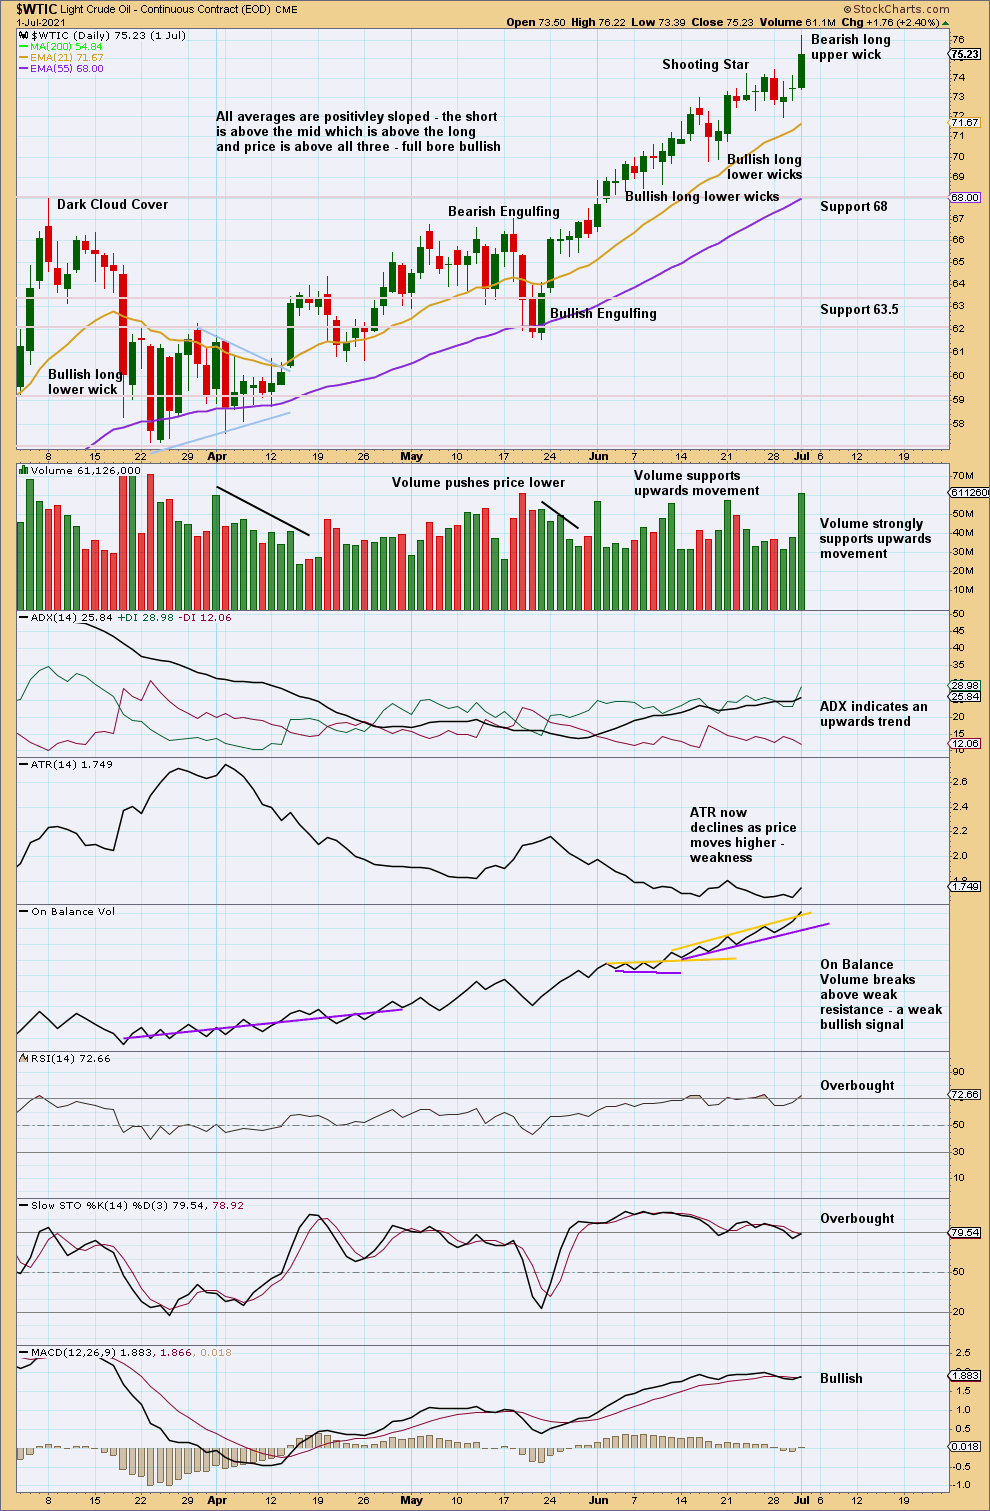
Click chart to enlarge. Chart courtesy of StockCharts.com.
There is an upwards trend that is not extreme, but RSI is again overbought; RSI can move more deeply overbought before the trend ends.
The bearish long upper wick on the last completed candlestick is bearish for the short term only. This is not a reversal pattern.
Published @ 06:39 p.m. ET.
—
Careful risk management protects your trading account(s).
Follow my two Golden Rules:
1. Always trade with stops.
2. Risk only 1-5% of equity on any one trade.
—
New updates to this analysis are in bold.
—