
US OIL: Elliott Wave and Technical Analysis | Charts – July 16, 2021
Friday’s session has reached the lower edge of the Elliott channel on the daily chart.
Summary: The main Elliott wave count expects upwards movement to resume to the next target at 110.61 to 112.79.
Oil may have found a major sustainable low in April 2020.
ELLIOTT WAVE COUNT
MONTHLY CHART
Click chart to enlarge.
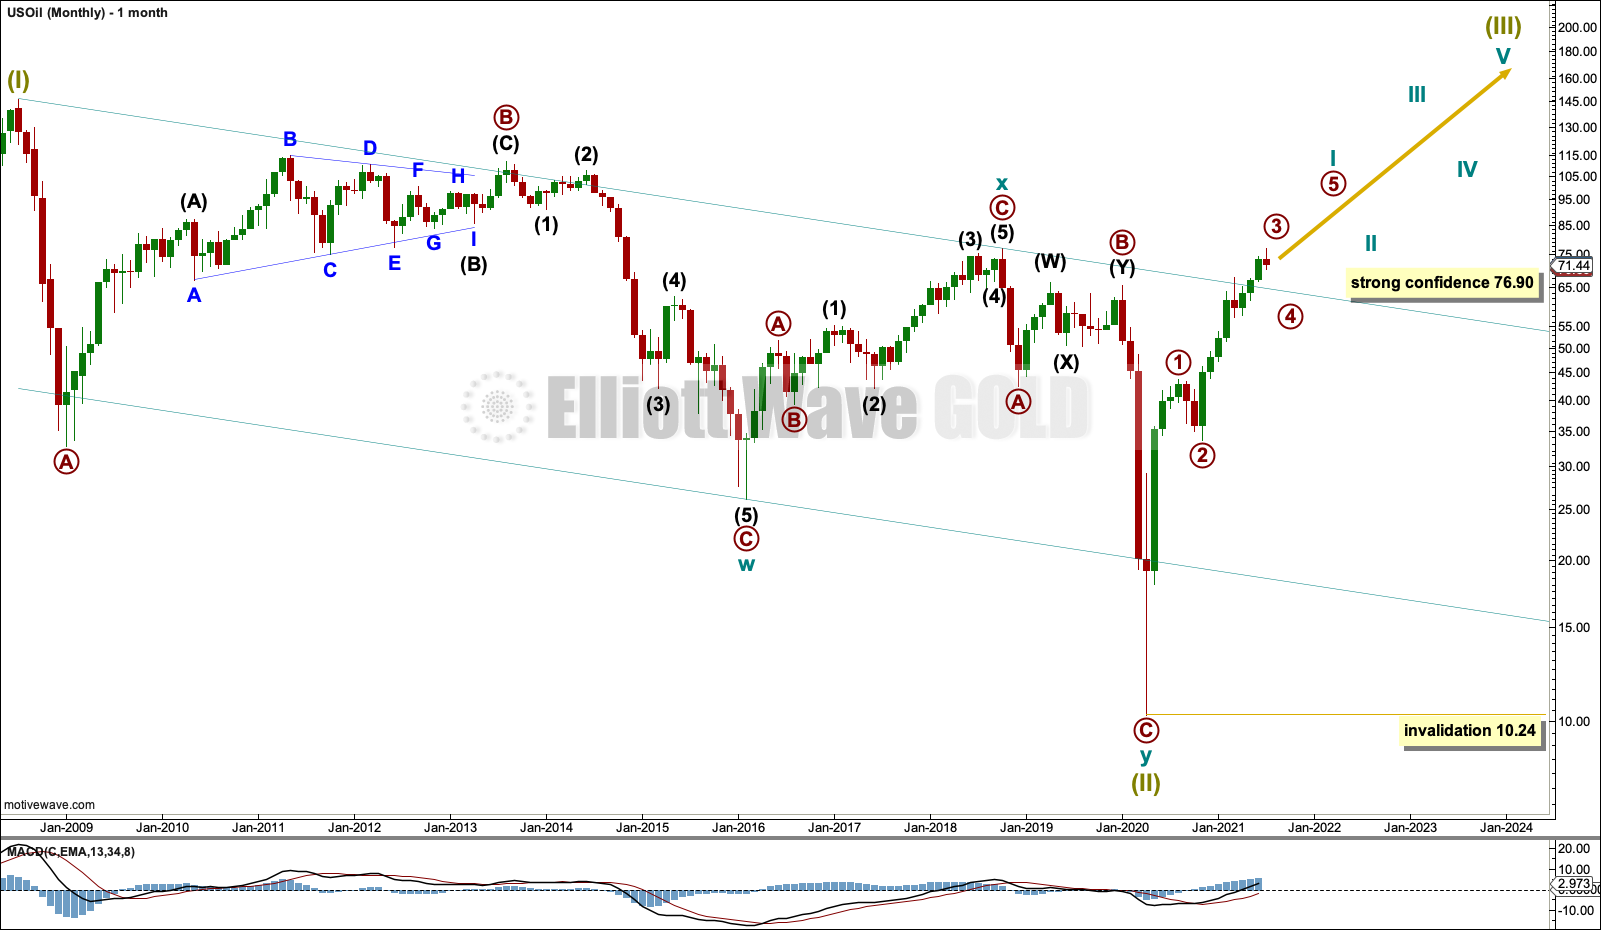
The basic Elliott wave structure is five steps forward and three steps back. This Elliott wave count expects that US Oil has completed a three steps back pattern, which began in July 2008. The Elliott wave count expects that the bear market for US Oil may now be over.
Following Super Cycle wave (II), which was a correction (three steps back), Super Cycle wave (III), which may have begun, should be five steps up when complete. Super Cycle wave (III) may last a generation and must make a new high above the end of Super Cycle wave (I) at 146.73.
A channel is drawn about Super Cycle wave (II): draw the first trend line from the start of cycle wave w to the end of cycle wave x, then place a parallel copy on the end of cycle wave w. This trend line is breached to the downside, which is a typical look for the end of a movement for a commodity.
The upper edge of the channel has now been breached by upwards movement. This trend line may now provide support for any deeper pullbacks along the way up.
A new high above the high at 76.90 from October 2018 has been made. This is a significant new high and was expected from this wave count. Further confidence in a bull market for Oil may be had.
Super Cycle wave (III) may only subdivide as a five wave impulse. New trends for Oil usually start out very slowly with short first waves and deep time consuming second wave corrections. However, while this is a common tendency, it is not always seen and may not have been seen in this instance. The first reasonably sized pullback may be over already.
WEEKLY CHART
Click chart to enlarge.
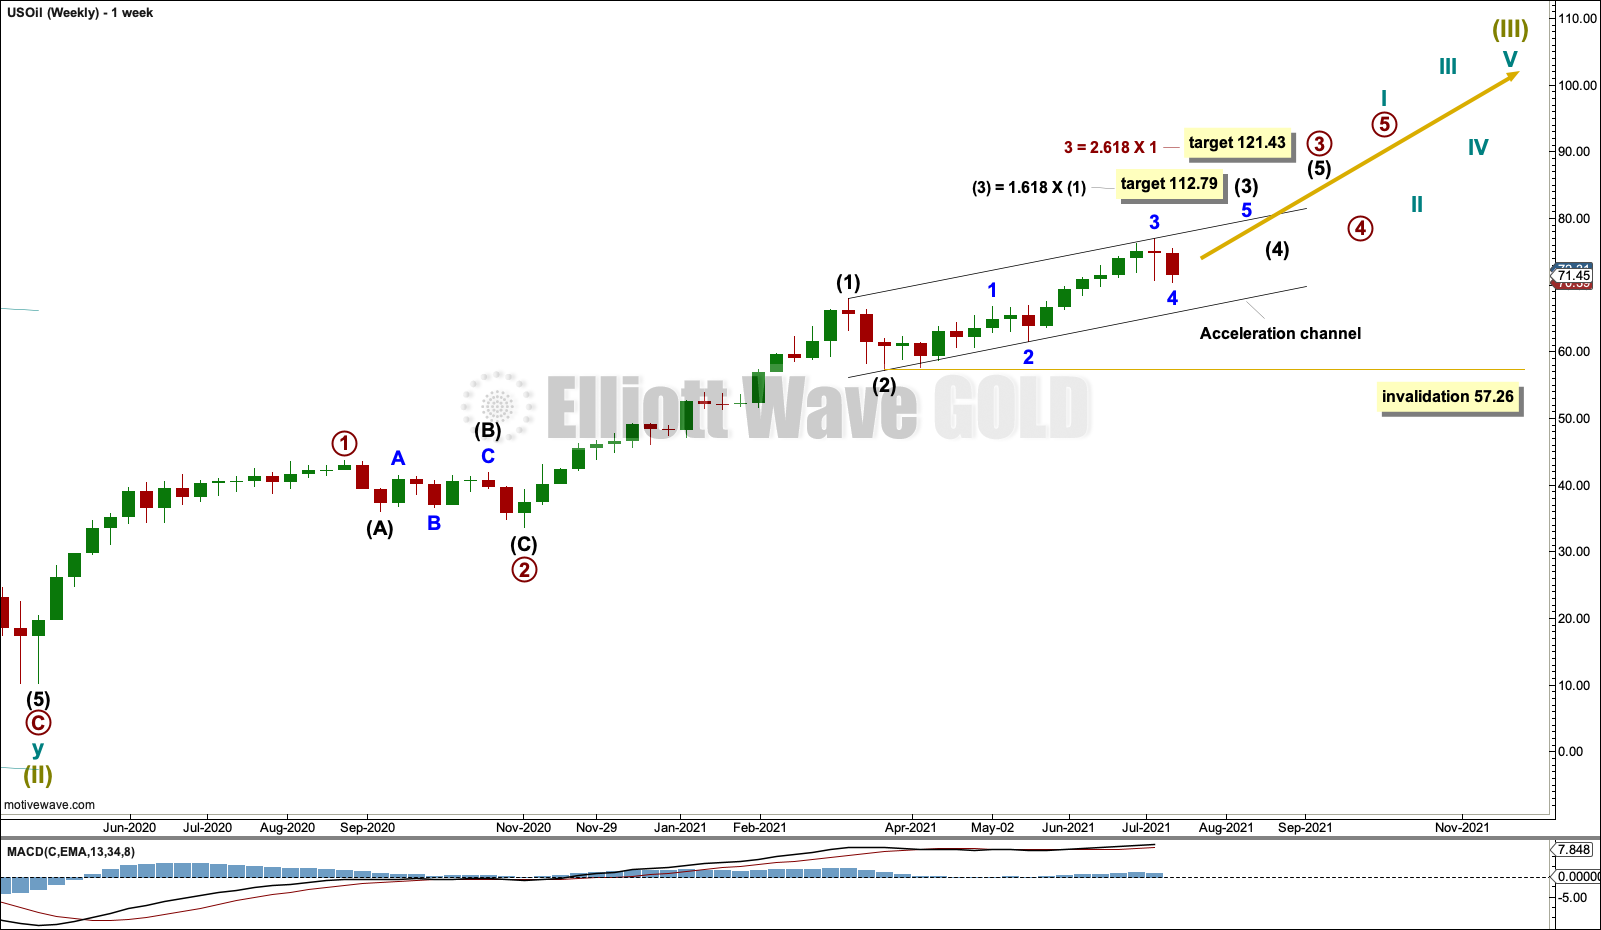
Super Cycle wave (III) must subdivide as an impulse.
Cycle wave I within Super Cycle wave (III) may be incomplete.
Within cycle wave I: Primary waves 1 and 2 may be complete, and primary wave 3 may only subdivide as an impulse.
Within primary wave 3: Intermediate waves (1) and (2) may be complete, and no second wave correction within intermediate wave (3) may move beyond its start below 57.26.
DAILY CHART
Click chart to enlarge.
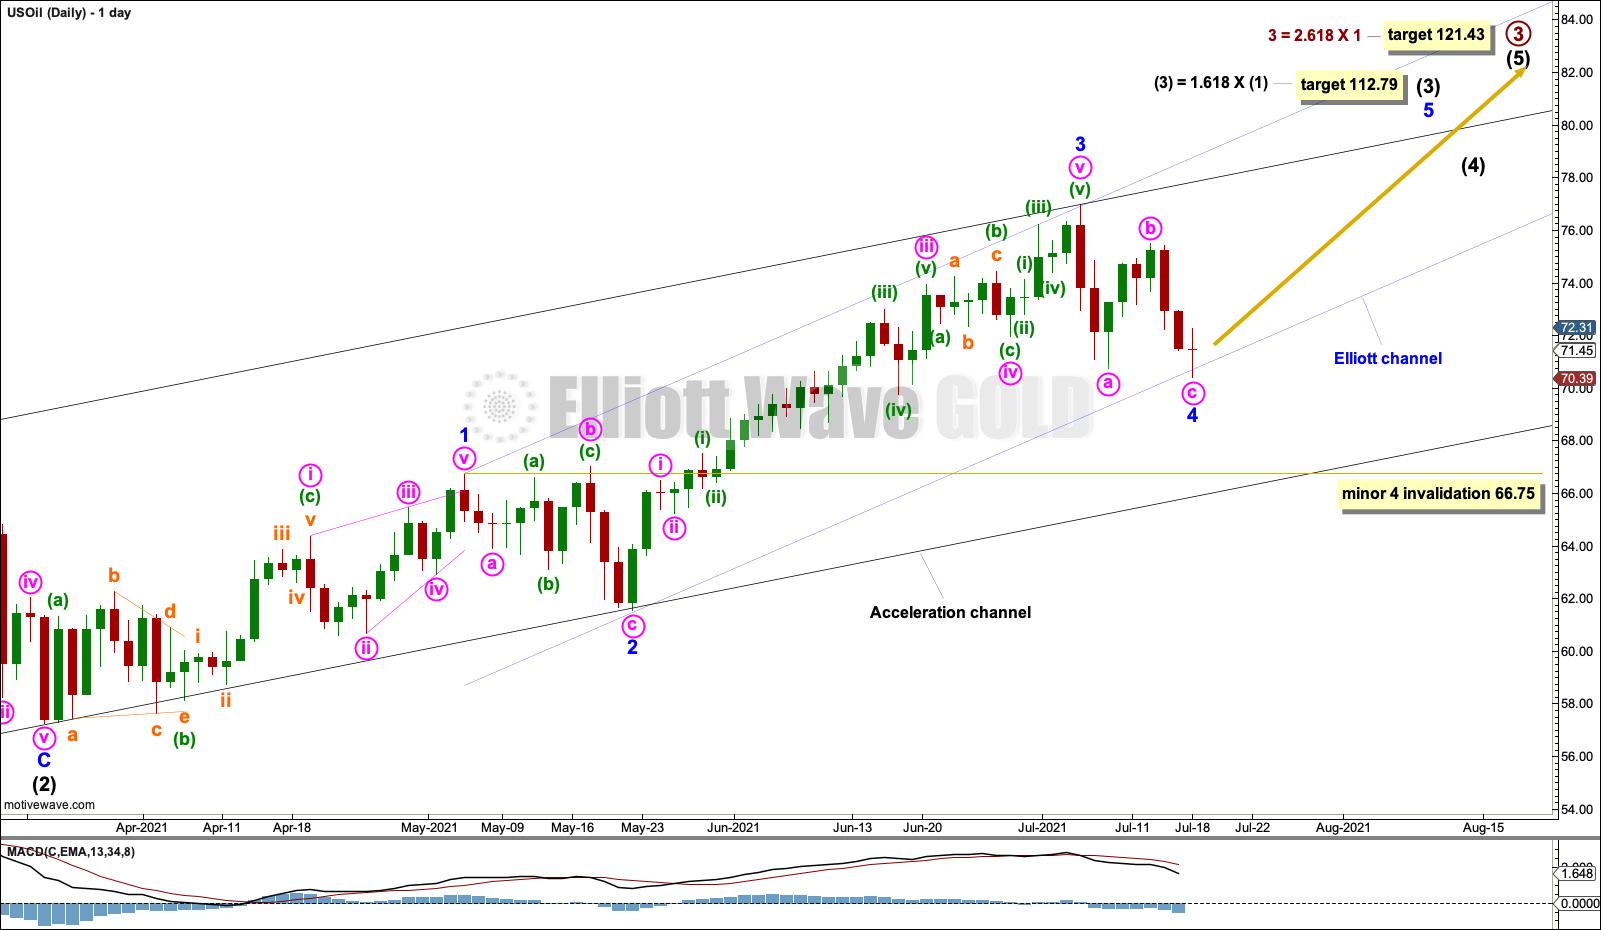
Within intermediate wave (3), minor wave 1 may be a complete leading contracting diagonal. Following a leading diagonal in a first wave position, the second wave correction is usually very deep. Minor wave 2 is a 0.55 depth of minor wave 1.
When a first wave subdivides as a leading diagonal, then the third wave is almost always extended. If minor wave 3 was over at the last high, then it is very close to 1.618 the length of minor wave 1. The size of downwards movement this week looks like minor wave 4.
Draw an Elliott channel about intermediate wave (3). Draw the first trend line from the ends of minor waves 1 to 3, then place a parallel copy on the end of minor wave 2. When drawn on an arithmetic scale, this trend channel shows where price found support during Friday’s session.
A target zone is calculated at two degrees for intermediate wave (3) to end.
Minor wave 4 may not move into minor wave 1 price territory below 66.75.
ALTERNATE DAILY CHART
Click chart to enlarge.
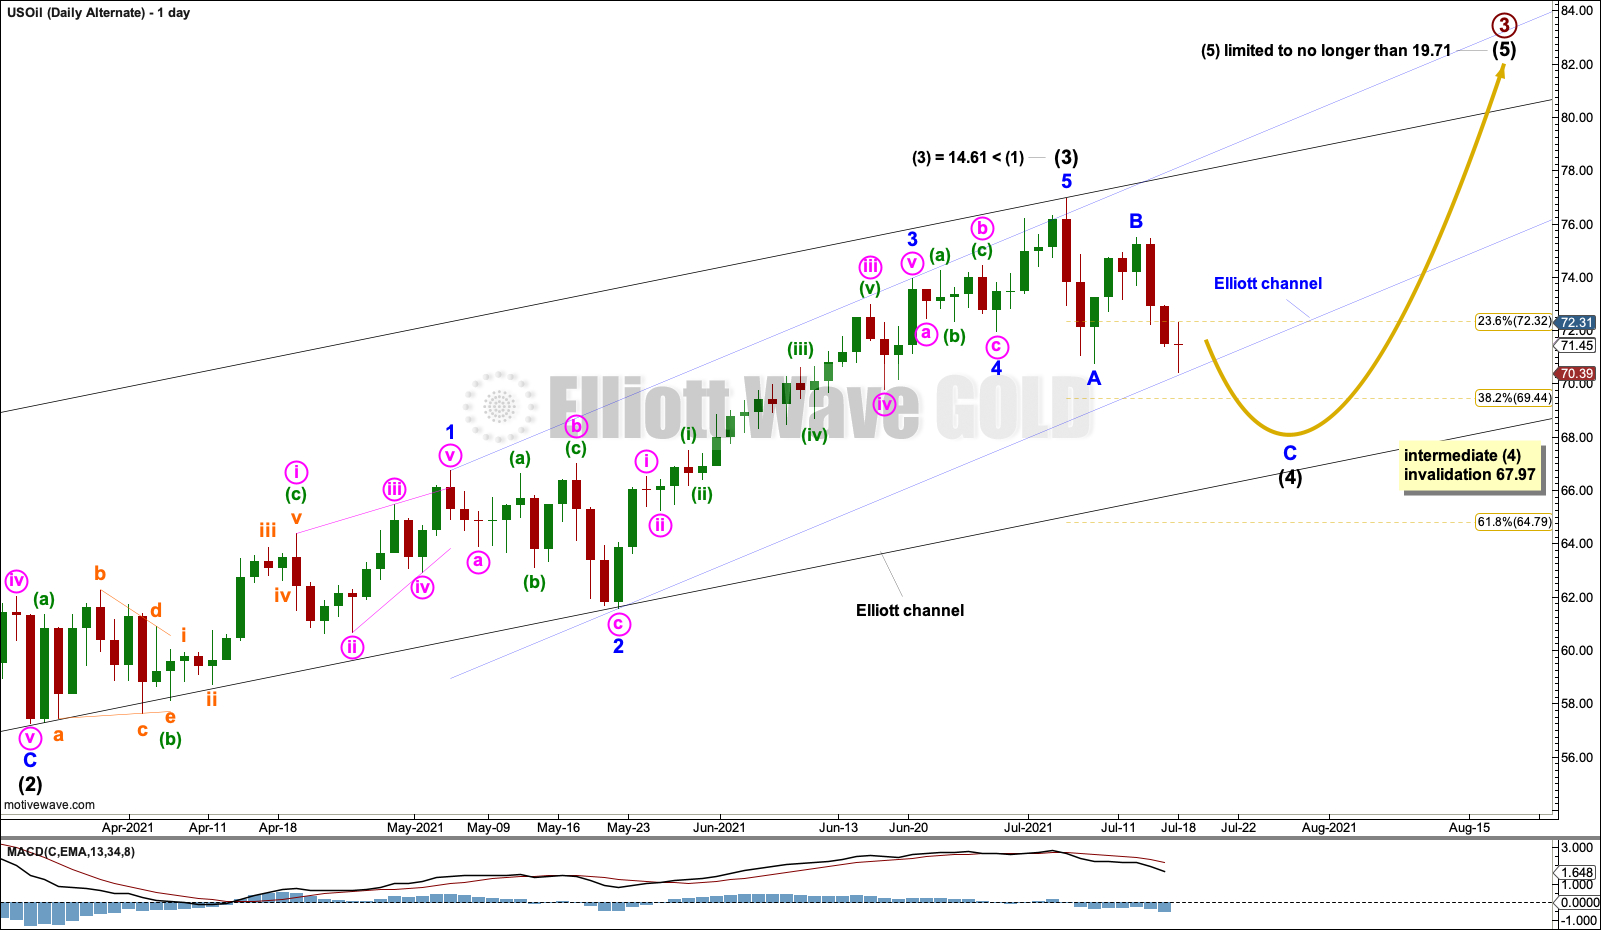
If the degree of labelling within intermediate wave (3) is moved up one and it is slightly relabelled, then it is possible to see intermediate wave (3) over at the last high and the current pullback as intermediate wave (4).
Intermediate wave (4) may continue for a few more sessions. Intermediate wave (2) lasted 11 sessions and subdivided as a zigzag. So far intermediate wave (4) has lasted 8 sessions, but it may continue for a little longer to have better proportion to intermediate wave (2).
Intermediate wave (4) may subdivide as any corrective structure. So far it is labelled as a zigzag, but this labelling may need to change.
Intermediate wave (4) may not move into intermediate wave (1) price territory below 67.97.
For this wave count, intermediate wave (3) is significantly shorter than intermediate wave (1). Third waves are commonly longer than their counterpart first waves. This alternate wave count has a very low probability.
TECHNICAL ANALYSIS
WEEKLY CHART
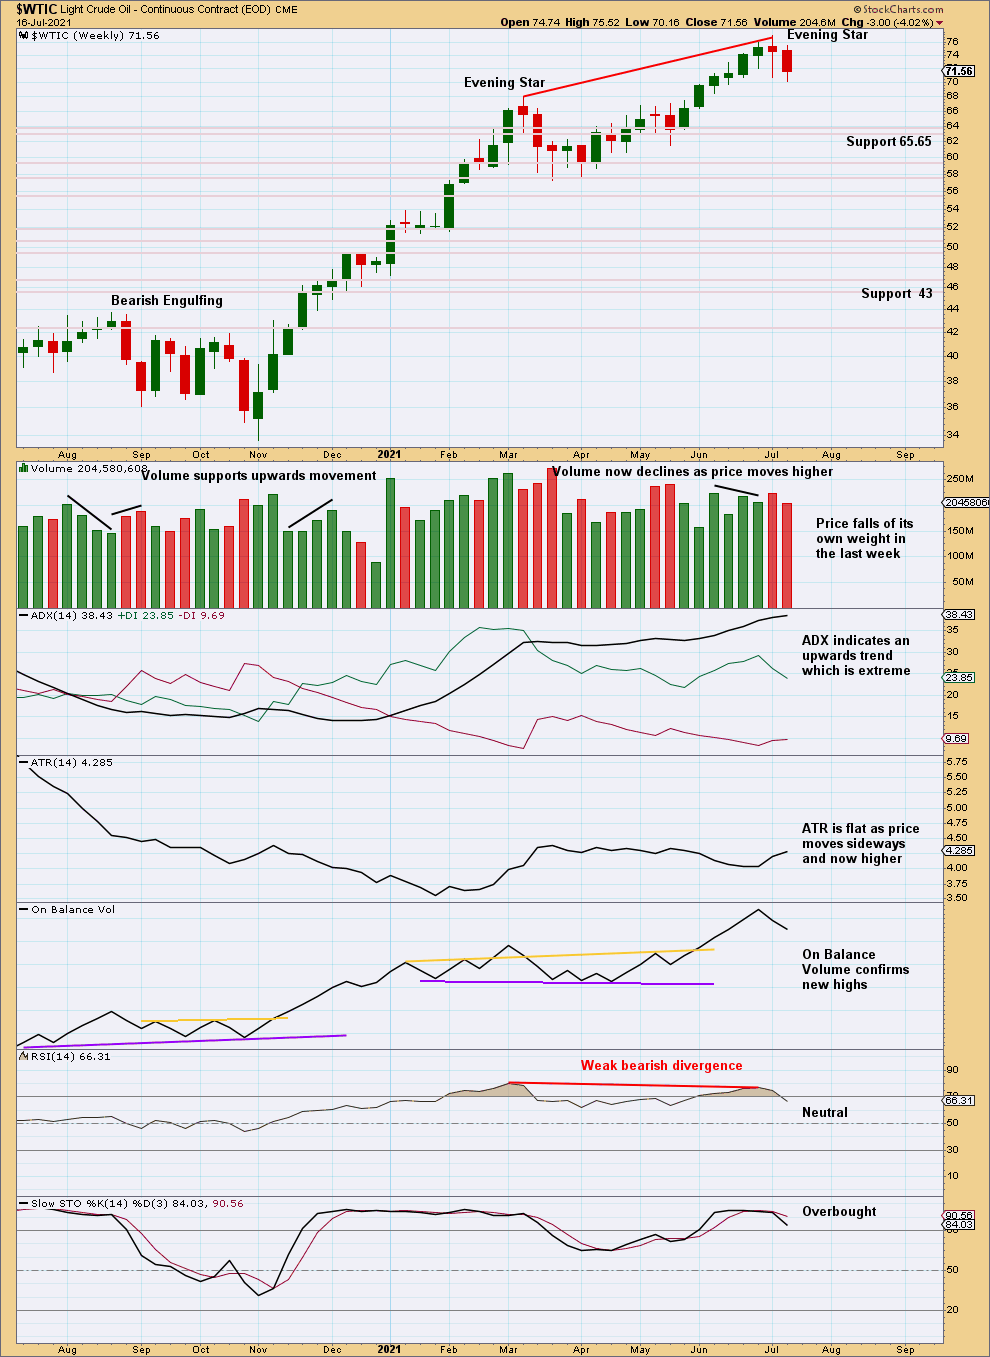
Click chart to enlarge. Chart courtesy of StockCharts.com.
This market can sustain extreme trends for a reasonable period of time.
Bearish divergence between price and RSI at the last two swing highs is weak. This may not be an indication of a major trend change.
DAILY CHART
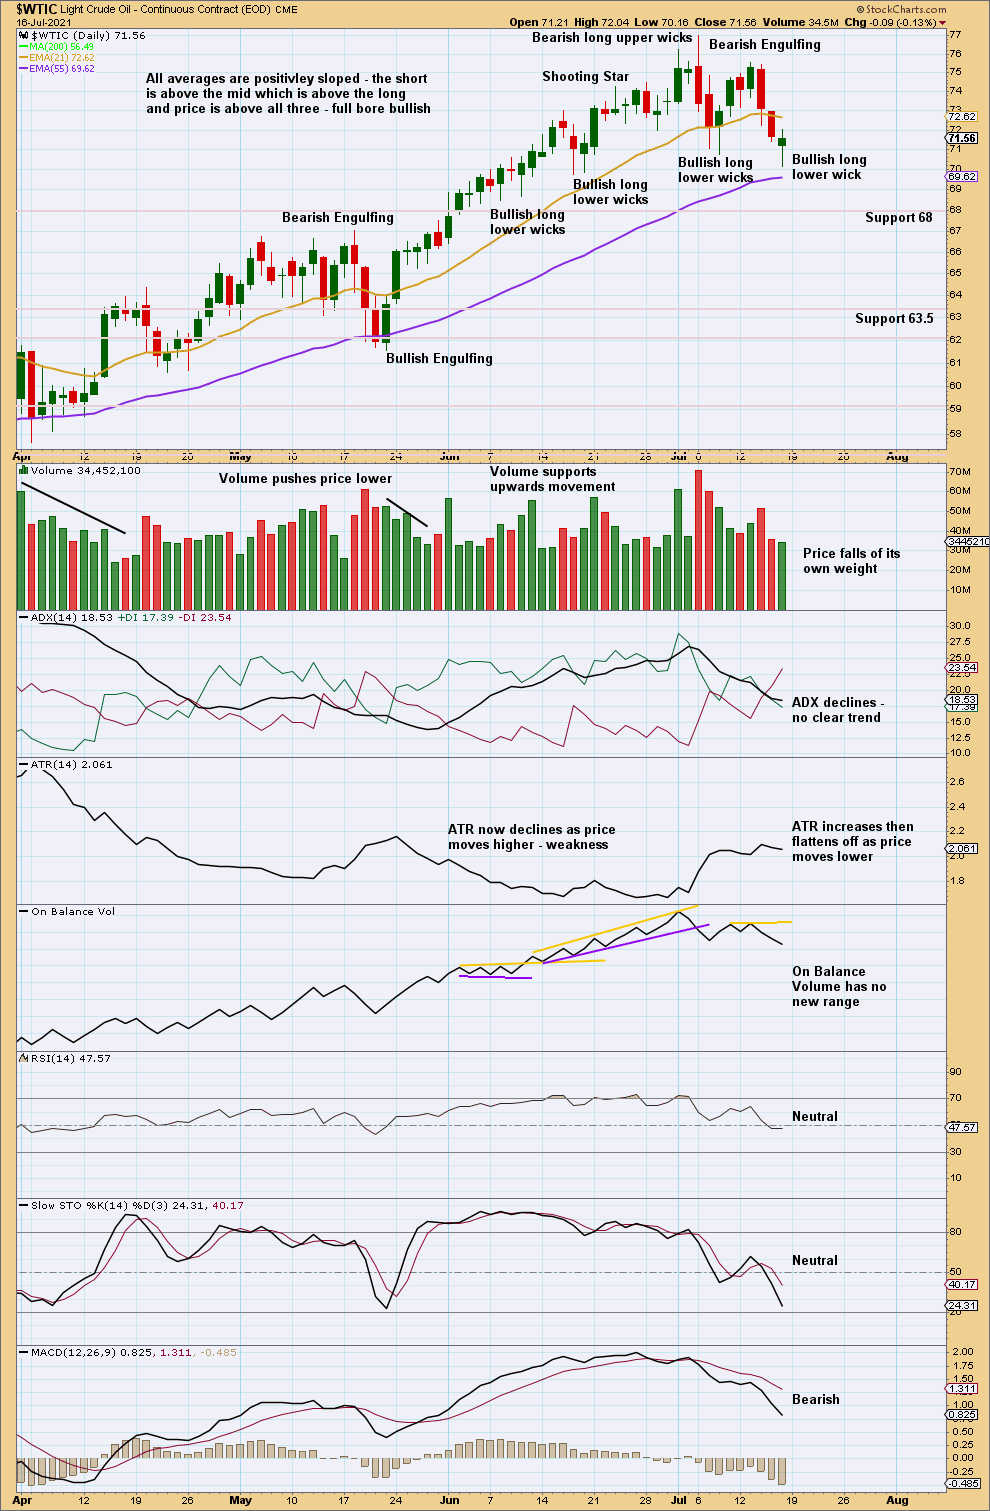
Click chart to enlarge. Chart courtesy of StockCharts.com.
A Bearish Engulfing candlestick pattern comes while the trend was not extreme and there was no clear bearish divergence between price and RSI. In these circumstances a larger trend change may not be the most likely result and may only indicate another short-term pullback.
This week the pullback has continued lower. It may be over here, or it may continue lower until Stochastics reaches oversold and price reaches support about 68.
Published @ 06:37 p.m. ET.
—
Careful risk management protects your trading account(s).
Follow my two Golden Rules:
1. Always trade with stops.
2. Risk only 1-5% of equity on any one trade.
—
New updates to this analysis are in bold.
—