
US OIL: Elliott Wave and Technical Analysis | Charts – July 30, 2021
Last week’s Elliott wave and technical analysis expected upwards movement to resume for US Oil. This week price has moved higher as expected.
Summary: The main Elliott wave count expects upwards movement to resume to the next target at 112.79.
An alternate Elliott wave count allows for more downwards movement to end at support at the lower edge of a channel on the daily chart.
Oil may have found a major sustainable low in April 2020.
ELLIOTT WAVE COUNT
MONTHLY CHART
Click chart to enlarge.
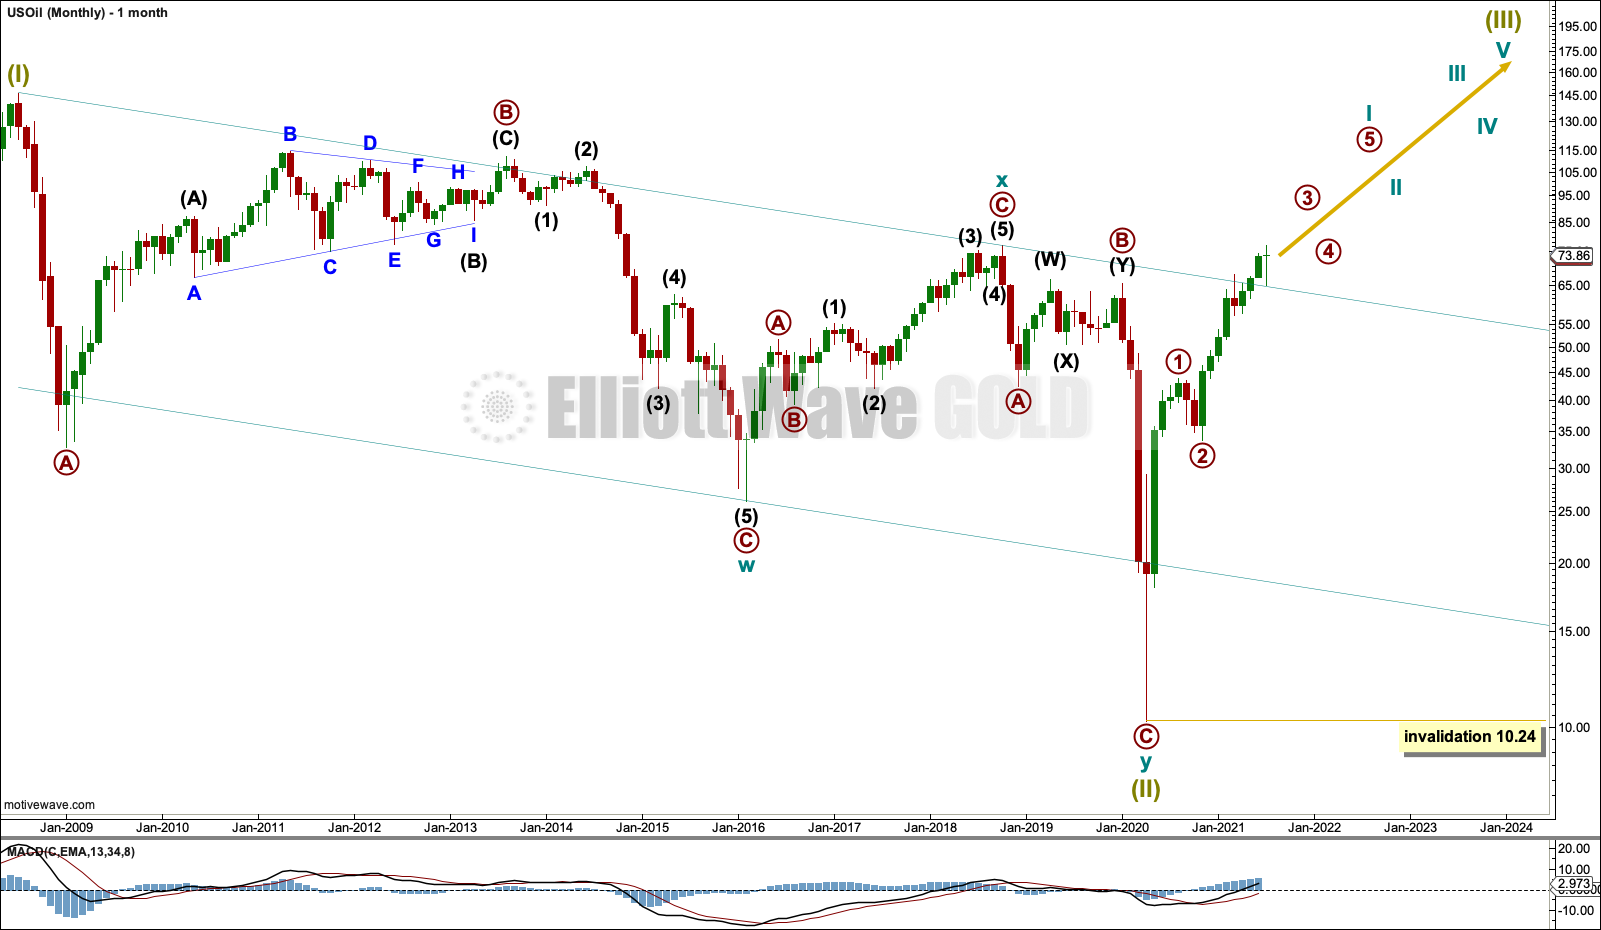
The basic Elliott wave structure is five steps forward and three steps back. This Elliott wave count expects that US Oil has completed a three steps back pattern, which began in July 2008. The Elliott wave count expects that the bear market for US Oil may now be over.
Following Super Cycle wave (II), which was a correction (three steps back), Super Cycle wave (III), which may have begun, should be five steps up when complete. Super Cycle wave (III) may last a generation and must make a new high above the end of Super Cycle wave (I) at 146.73.
A channel is drawn about Super Cycle wave (II): draw the first trend line from the start of cycle wave w to the end of cycle wave x, then place a parallel copy on the end of cycle wave w. This trend line is breached to the downside, which is a typical look for the end of a movement for a commodity.
The upper edge of the channel has now been breached by upwards movement. This trend line may now have provided support for the last pullback.
A new high above the high at 76.90 from October 2018 has been made. This is a significant new high and was expected from this wave count. Further confidence in a bull market for Oil may be had.
Super Cycle wave (III) may only subdivide as a five wave impulse. New trends for Oil usually start out very slowly with short first waves and deep time consuming second wave corrections. However, while this is a common tendency, it is not always seen and may not have been seen in this instance. The first reasonably sized pullback may be over already.
WEEKLY CHART
Click chart to enlarge.
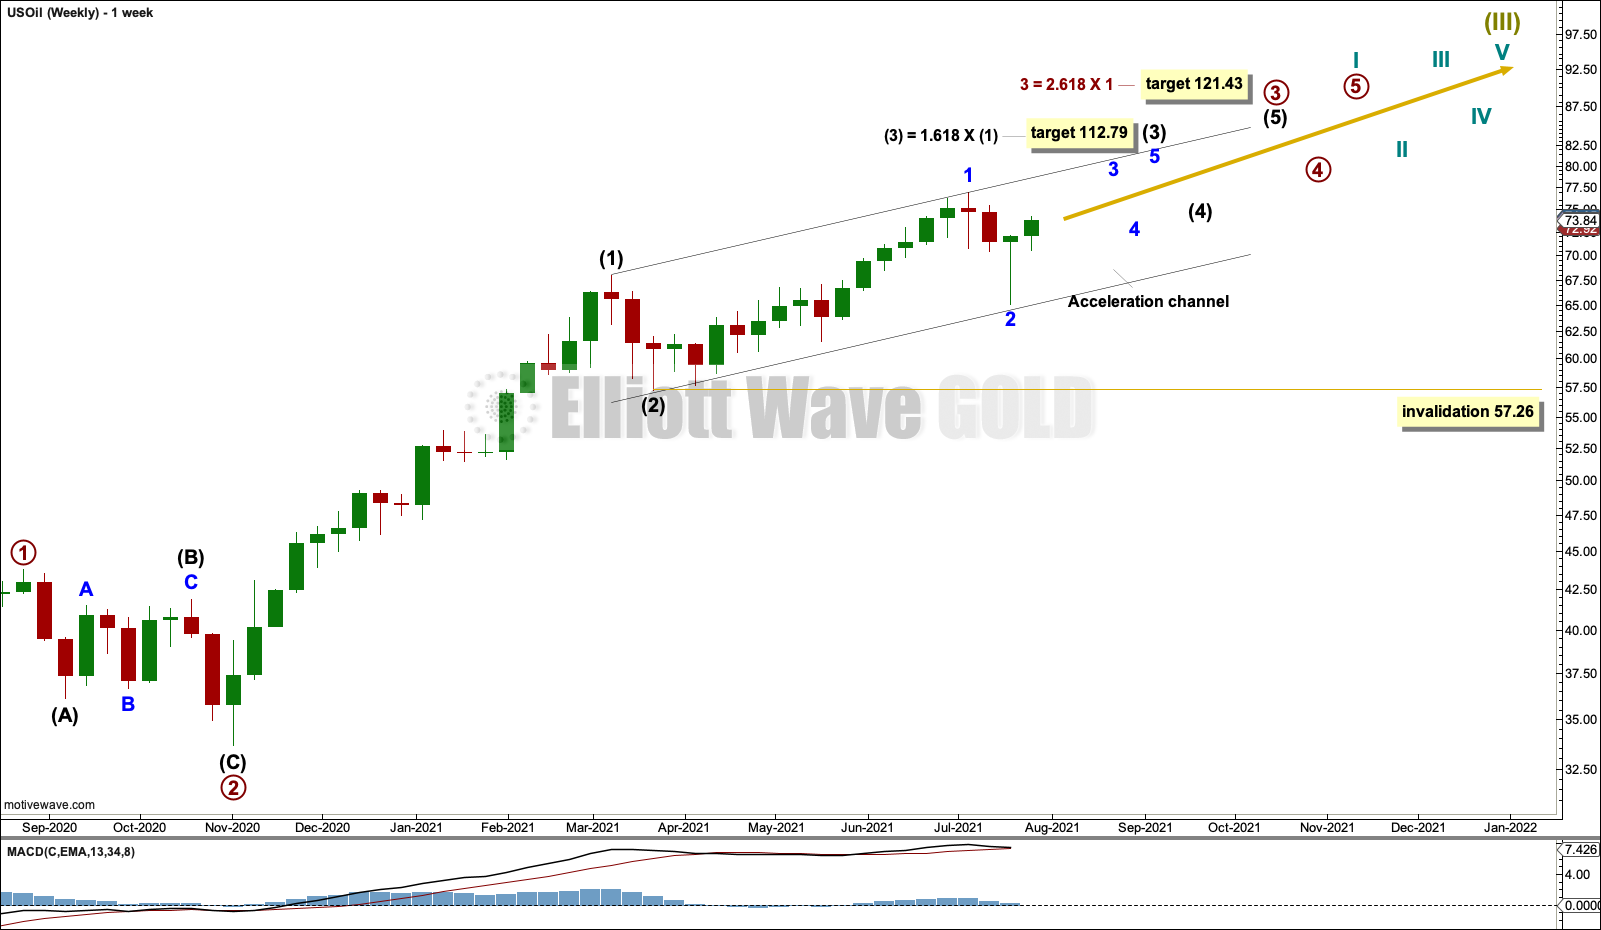
Super Cycle wave (III) must subdivide as an impulse.
Cycle wave I within Super Cycle wave (III) may be incomplete.
Within cycle wave I: Primary waves 1 and 2 may be complete, and primary wave 3 may only subdivide as an impulse.
Intermediate waves (1) and (2) within primary wave 3 may be complete. Minor wave 2 within intermediate wave (3) may not move beyond the start or minor wave 1 below 57.26.
DAILY CHART
Click chart to enlarge.
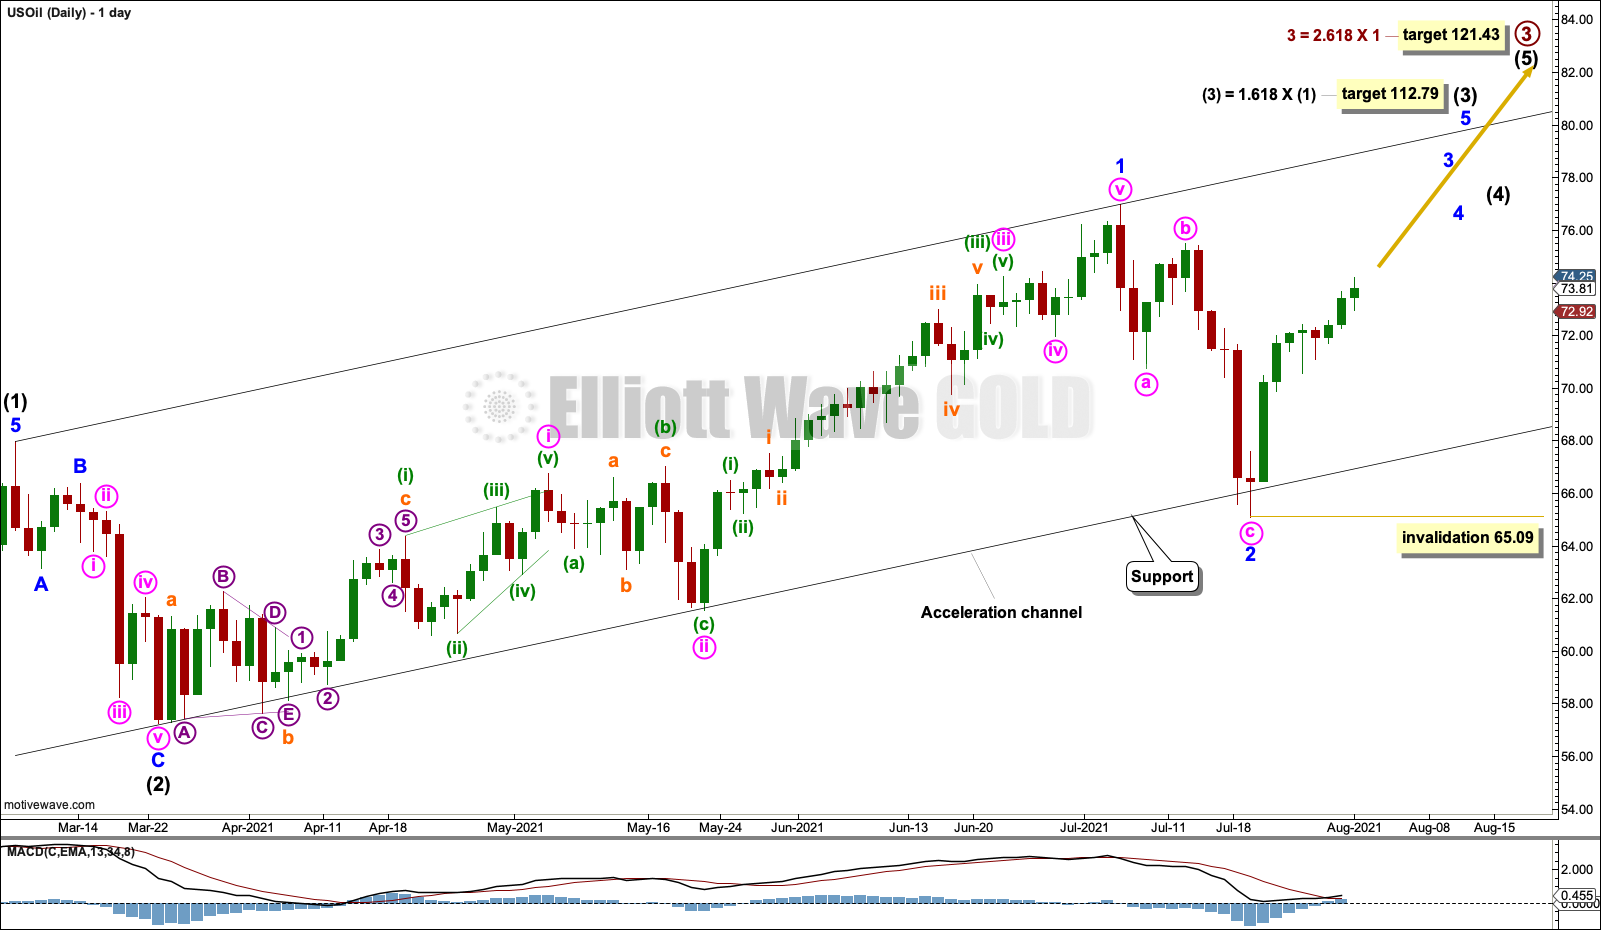
Minor wave 1 within intermediate wave (3) may be complete at the last high. The last pullback may be minor wave 2. Minor wave 2 may have ended about support at the lower edge of the acceleration channel.
Minor wave 3 may only subdivide as an impulse. Within the impulse, its second wave correction may not move beyond the start of its first wave below 65.09.
This wave count is very bullish. It expects a third wave at minor, intermediate and primary degree may have just begun. An increase in upwards momentum would be expected.
ALTERNATE WEEKLY CHART
Click chart to enlarge.
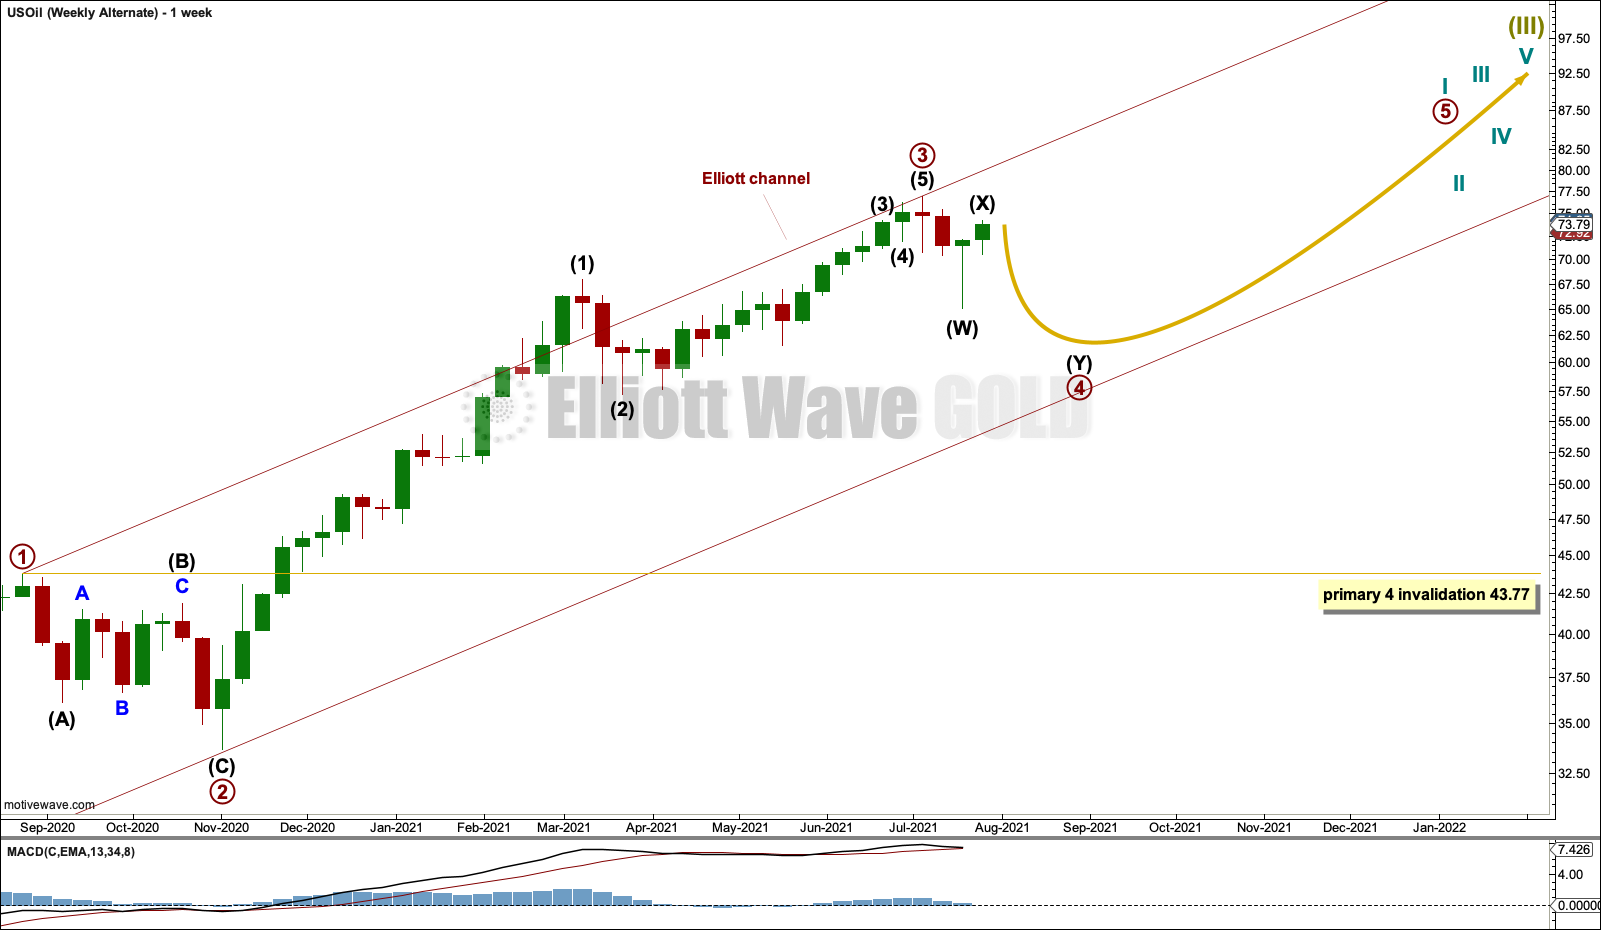
It is possible that primary waves 1, 2 and 3 within cycle wave I are complete. If primary wave 3 was complete at the last high, then the last pullback may have been the start of primary wave 4.
Primary wave 3 exhibits no Fibonacci ratio to primary wave 1. Primary wave 3 at 43.32 is longer than primary wave 1, which was 33.53.
Primary wave 2 lasted 10 weeks and subdivided as a single zigzag. Primary wave 4 may subdivide as any Elliott wave structure; so far it will be labelled as a possible double zigzag, but this labelling may need to change as it unfolds.
Primary wave 4 should last a few more weeks to be in better proportion to primary wave 2. Primary wave 4 may not move into primary wave 1 price territory below 43.77.
Draw an Elliott channel about the impulse. Draw the first trend line from the ends of primary waves 1 to 3, then place a parallel copy on the end of primary wave 2. Primary wave 4 may find support about the lower edge of this channel.
ALTERNATE DAILY CHART
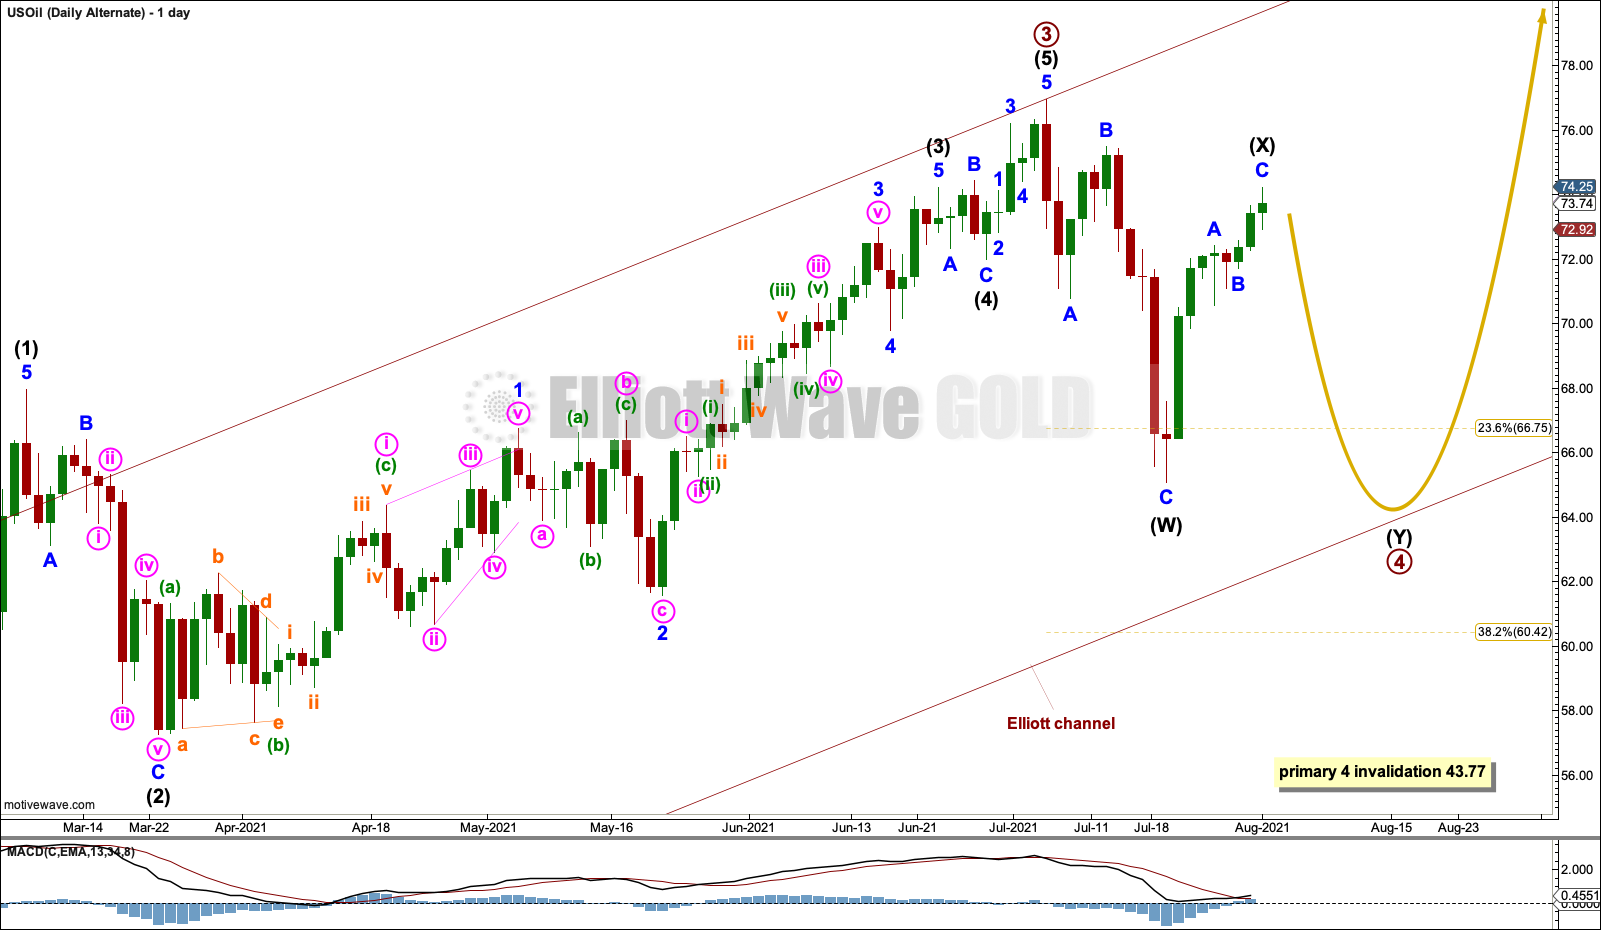
Click chart to enlarge.
Primary wave 4 may unfold as any one of more than 23 possible corrective Elliott wave structures. So far it will be labelled as a possible double zigzag to move lower to find support about the lower edge of the Elliott channel, but it may also continue sideways as a combination, flat or triangle.
It would be most likely that primary wave 4 would not be over at the last low. It would look too brief in comparison to primary wave 2.
TECHNICAL ANALYSIS
MONTHLY CHART
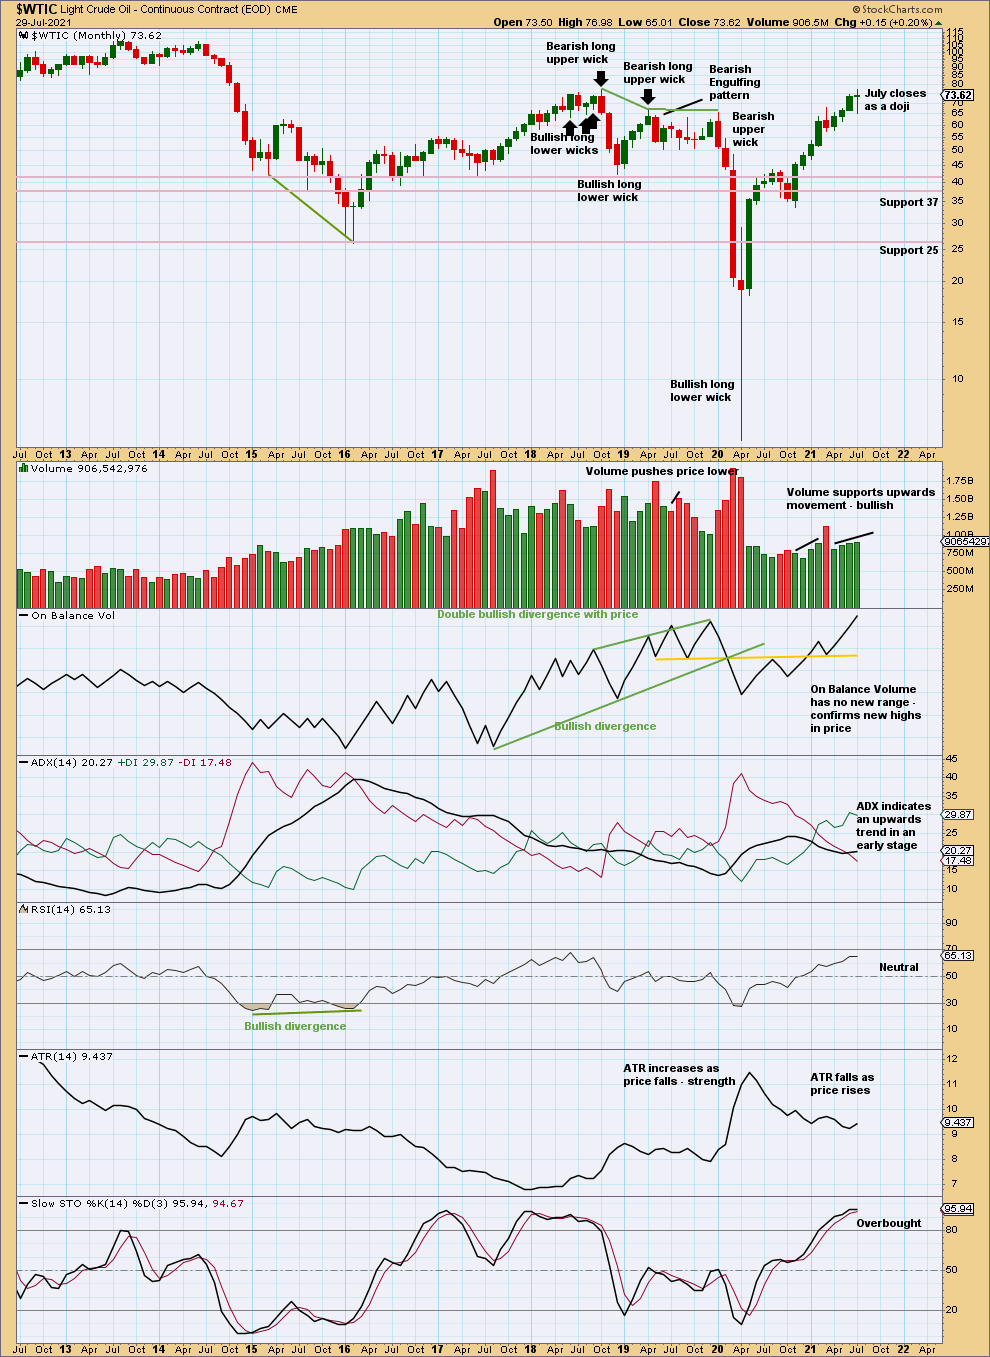
Click chart to enlarge. Chart courtesy of StockCharts.com.
It is time to step back and look at the monthly chart.
There is an upwards trend with room to continue; RSI is not yet overbought and volume supports the trend.
Closure of July as a doji is bearish for the short term, so a pullback may result. Doji in upwards trends are slightly bearish, but on their own are not reversal signals. The doji signals caution.
WEEKLY CHART
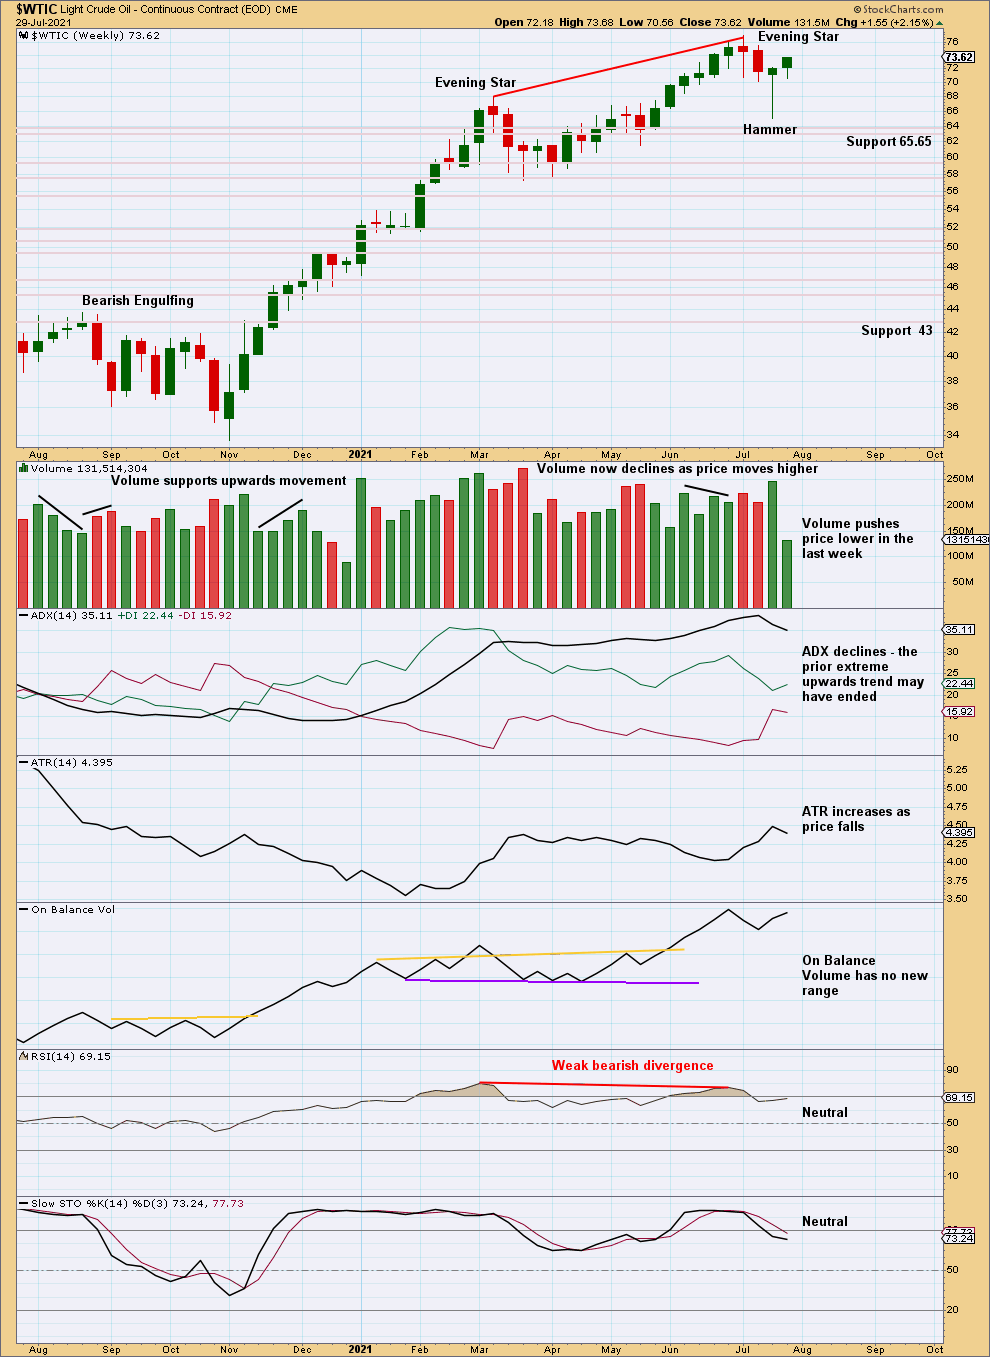
Click chart to enlarge. Chart courtesy of StockCharts.com.
At the last high, there was bearish divergence between price and RSI, ADX had reached extreme, and a bearish candlestick pattern in an Evening Star developed. Given these extreme conditions, some further pullback or consolidation may continue here to relieve extreme conditions to set up for the trend to continue. This favours the alternate Elliott wave count.
For the short term, a Hammer candlestick pattern suggests the pullback may be over; this favours the main Elliott wave count. When this market has a strong trend, then extreme conditions may be sustained for a reasonable period of time while price moves a great distance.
Volume for the final week (not shown on this chart) supports upwards movement, which favours the main Elliott wave count.
DAILY CHART
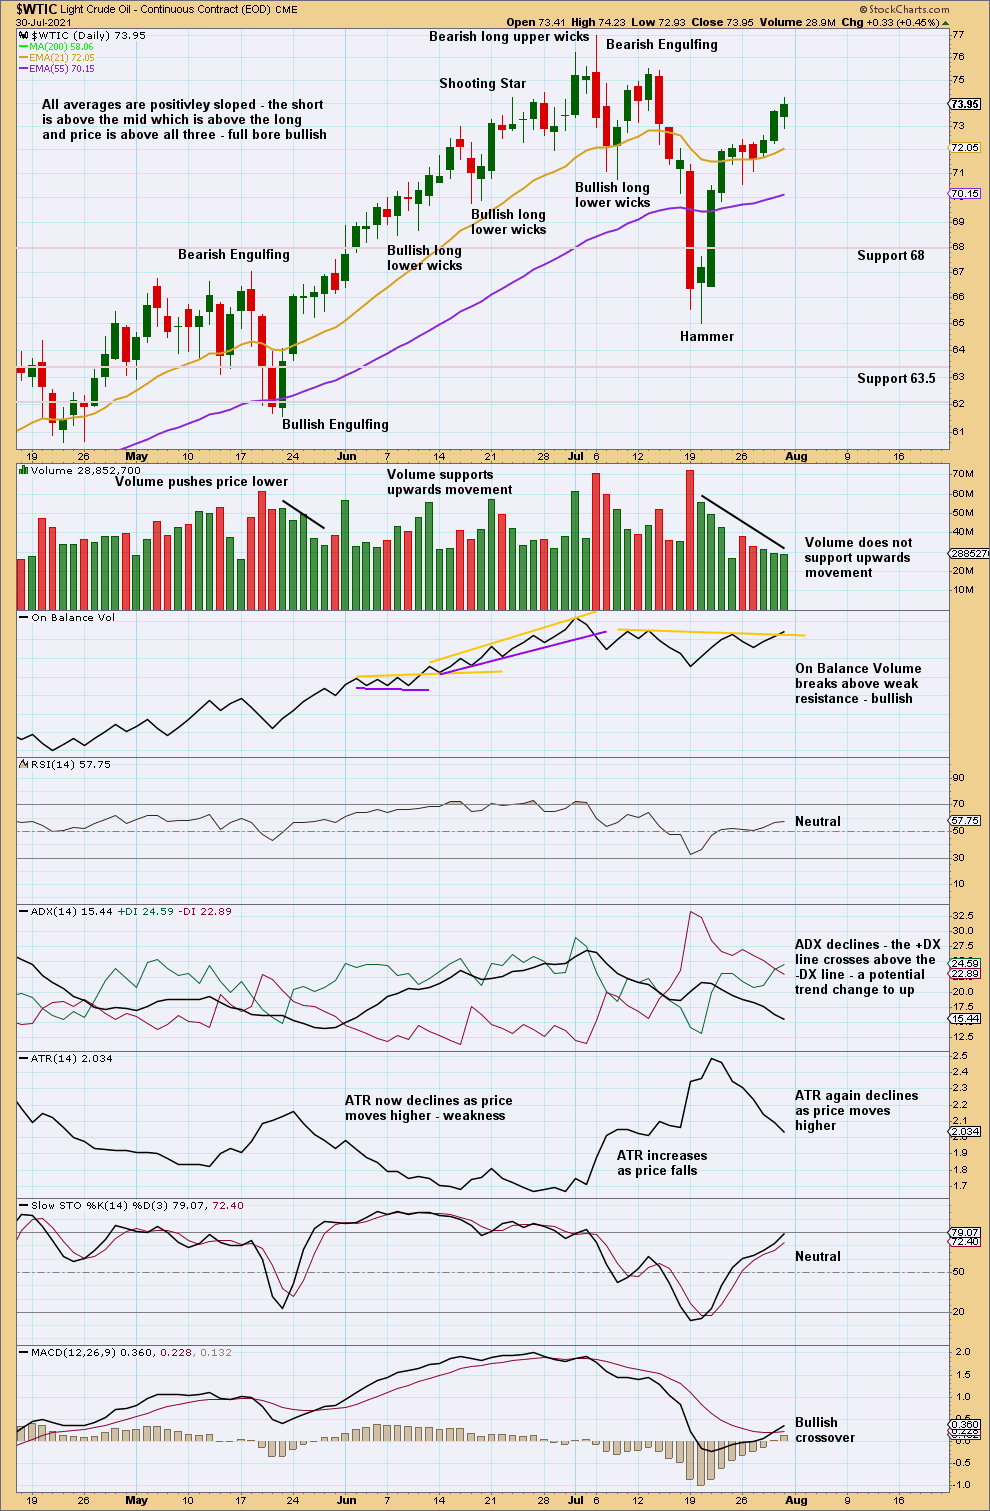
Click chart to enlarge. Chart courtesy of StockCharts.com.
The pullback continued until Stochastics reached oversold and price moved below support, to then turn up strongly. A Hammer candlestick pattern at the low suggests the pullback may be over. This supports the main Elliott wave count.
Neither ADX nor RSI are extreme. There is room for a trend to develop here in either direction.
Declining volume is a concern for the main Elliott wave count, but it must be noted that this has occurred previously in the early days of a sustained upwards trend. The low on the 21st of May was followed by five sessions of overall declining volume on upwards movement, yet price continued in an upwards trend for weeks, moving $15.42 from low to high.
Published @ 05:42 p.m. ET.
—
Careful risk management protects your trading account(s).
Follow my two Golden Rules:
1. Always trade with stops.
2. Risk only 1-5% of equity on any one trade.
—
New updates to this analysis are in bold.
—