
SILVER: Elliott Wave and Technical Analysis | Charts – August 13, 2021
Last week’s analysis of Silver expected more downwards movement for both bullish and bearish Elliott wave counts, which is what has happened over the week.
Summary: The first wave count is bearish for the mid and long term. A short-term target is at 18.92. A long-term target is at 7.45.
The second wave count is bearish for the mid-term, expecting a pullback to about 18.605 before the bull market resumes. The second wave count is overall bullish at the monthly chart level.
ELLIOTT WAVE COUNTS
FIRST ELLIOTT WAVE COUNT
MONTHLY CHART
Click chart to enlarge.
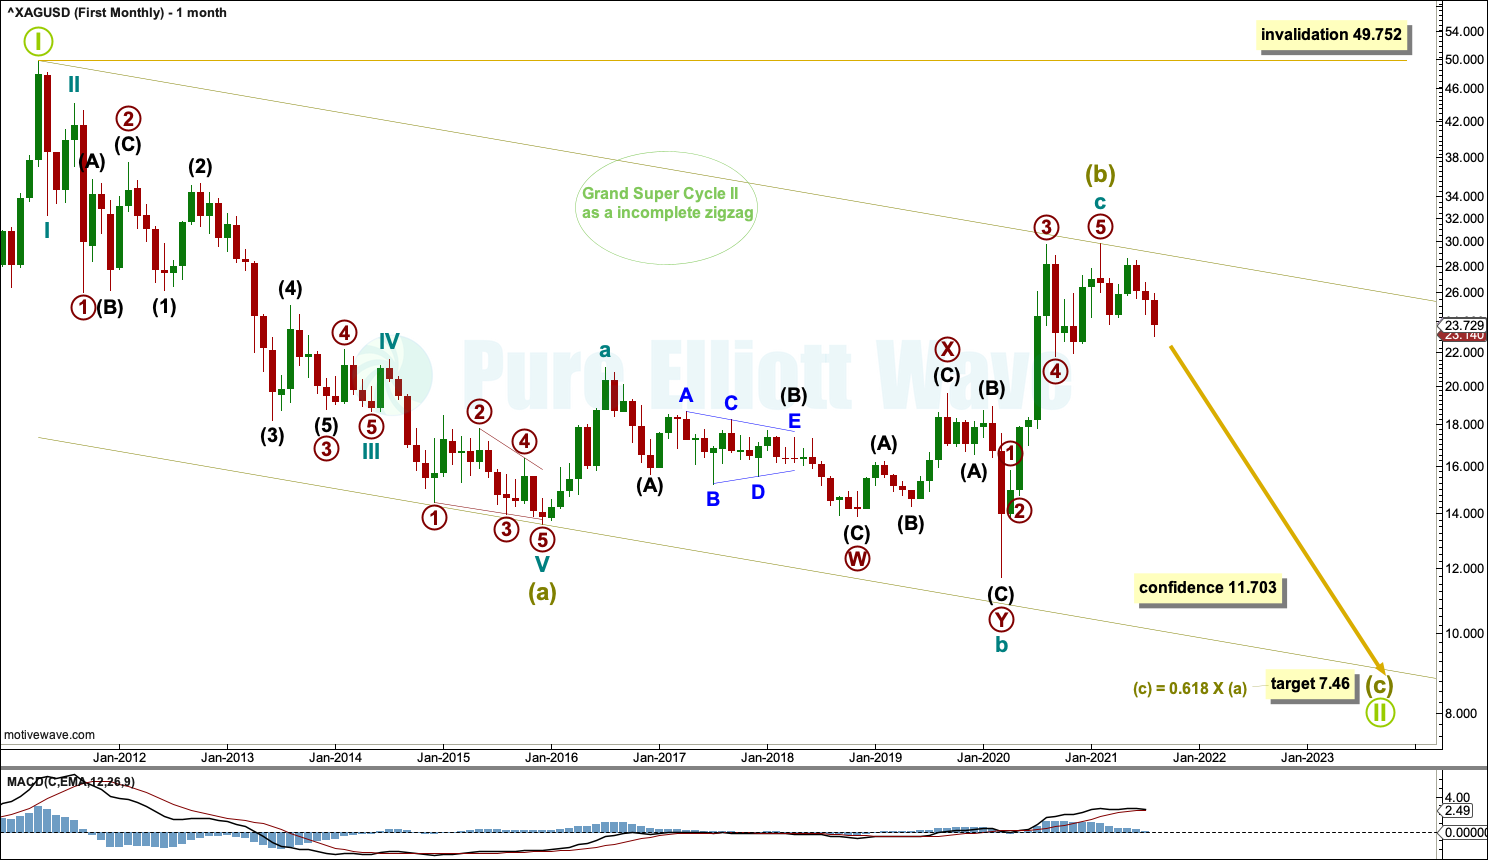
This first wave count has a better look in terms of Elliott wave structures.
It is possible that the zigzag for Grand Super Cycle wave II may be incomplete. Super Cycle wave (b) may be complete as an expanded flat correction.
Cycle wave b within the expanded flat of Super Cycle wave (b) is a 1.25 length of cycle wave a. This is within the most common range for B waves within flats of up to 1.38 times their counterpart A wave.
Cycle wave b within Super Cycle wave (b) subdivides as a double zigzag. This is a very common Elliott wave corrective structure, particularly in a B wave position. This part of the wave count has an excellent fit; all subdivisions are correct and the structures are common. This resolves the problem that the second wave count has of the triangle trend lines not being strictly adhered to.
If it continues further, then Super Cycle wave (b) may not move beyond the start of Super Cycle wave (a) above 49.752.
It is possible that Super Cycle wave (b) was complete at the last high and cycle wave c within it is a complete five wave impulse.
The disproportion between primary waves 2 and 4 within cycle wave c gives this part of the wave count the wrong look, but it should still be considered because Silver does not always exhibit good proportion.
WEEKLY CHART
Click chart to enlarge.
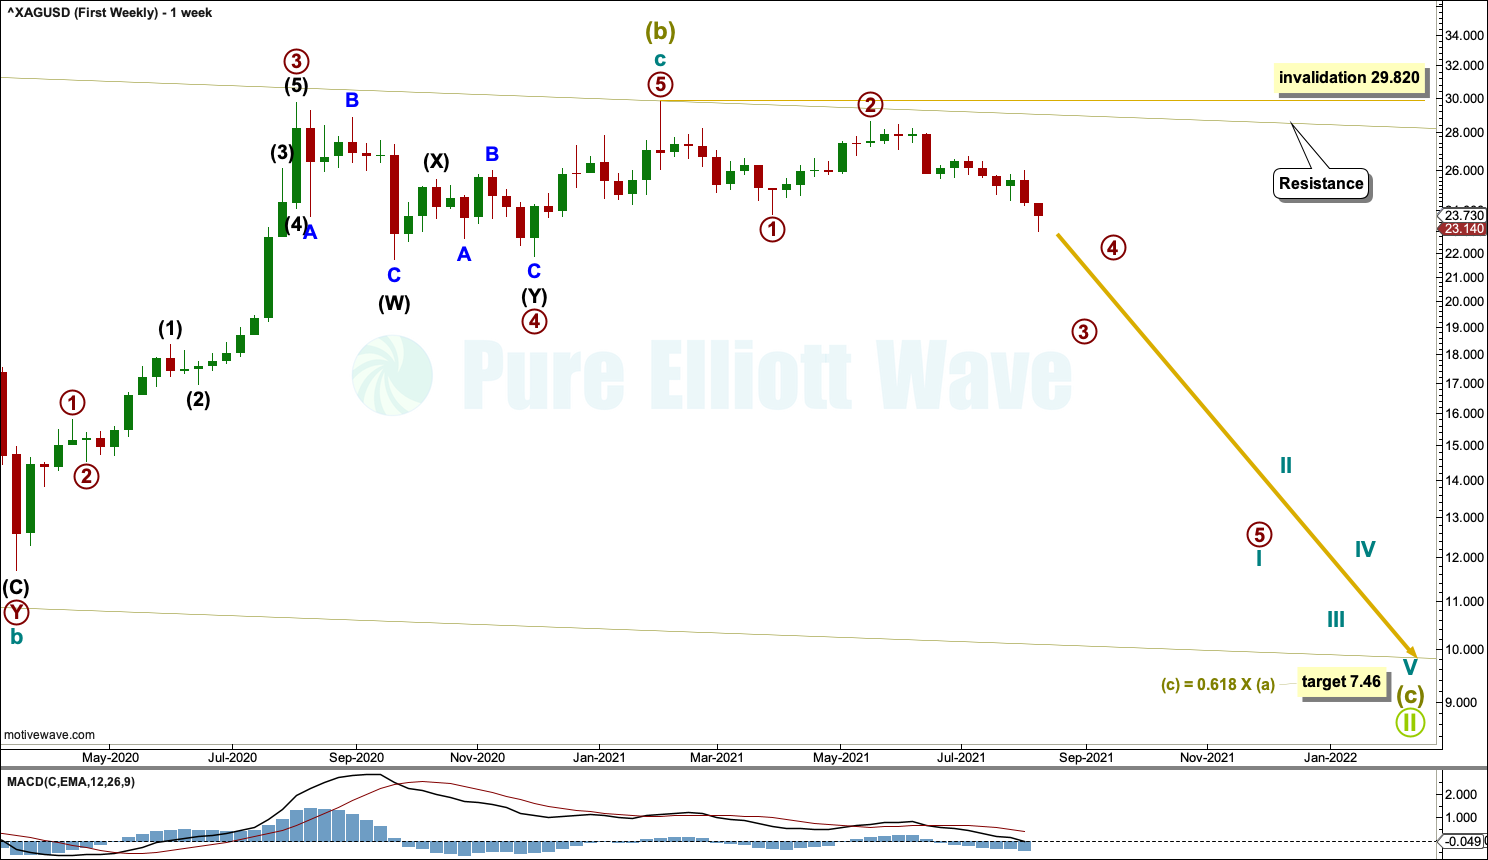
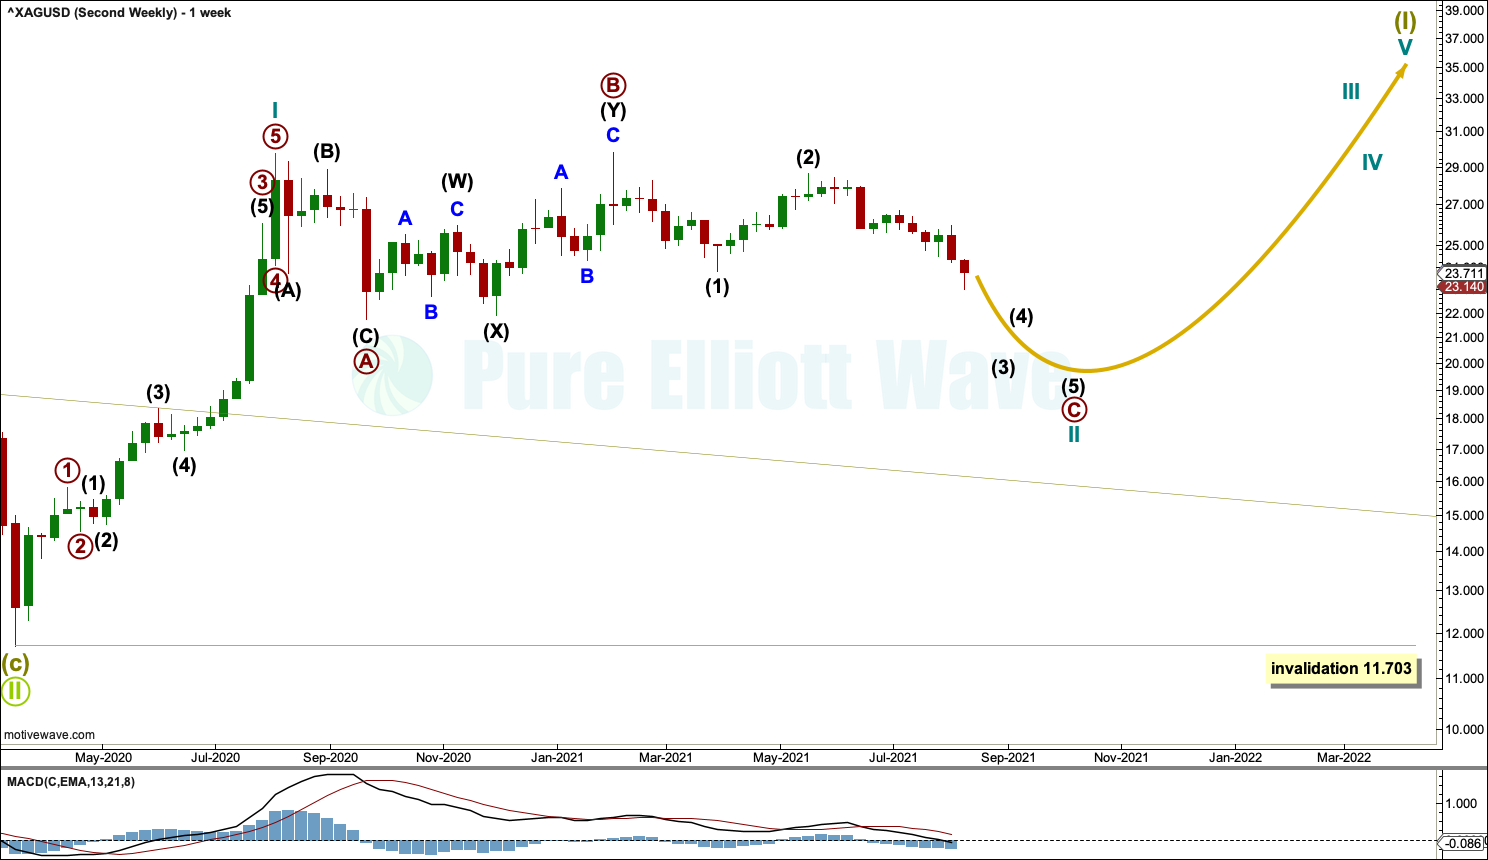
If Super Cycle wave (c) has begun, then it should move below the end of Super Cycle wave (a) at 13.569 to avoid a truncation. A target is calculated.
The large channel from the monthly chart is copied over to the weekly chart. Primary wave 2 may have found resistance just below the upper edge of this channel.
Primary wave 3 must move beyond the end of primary wave 1 below 23.808. It must move far enough below that point for primary wave 4 to then unfold and remain below primary wave 1 price territory. Primary wave 3 must continue lower from here.
DAILY CHART
Click chart to enlarge.
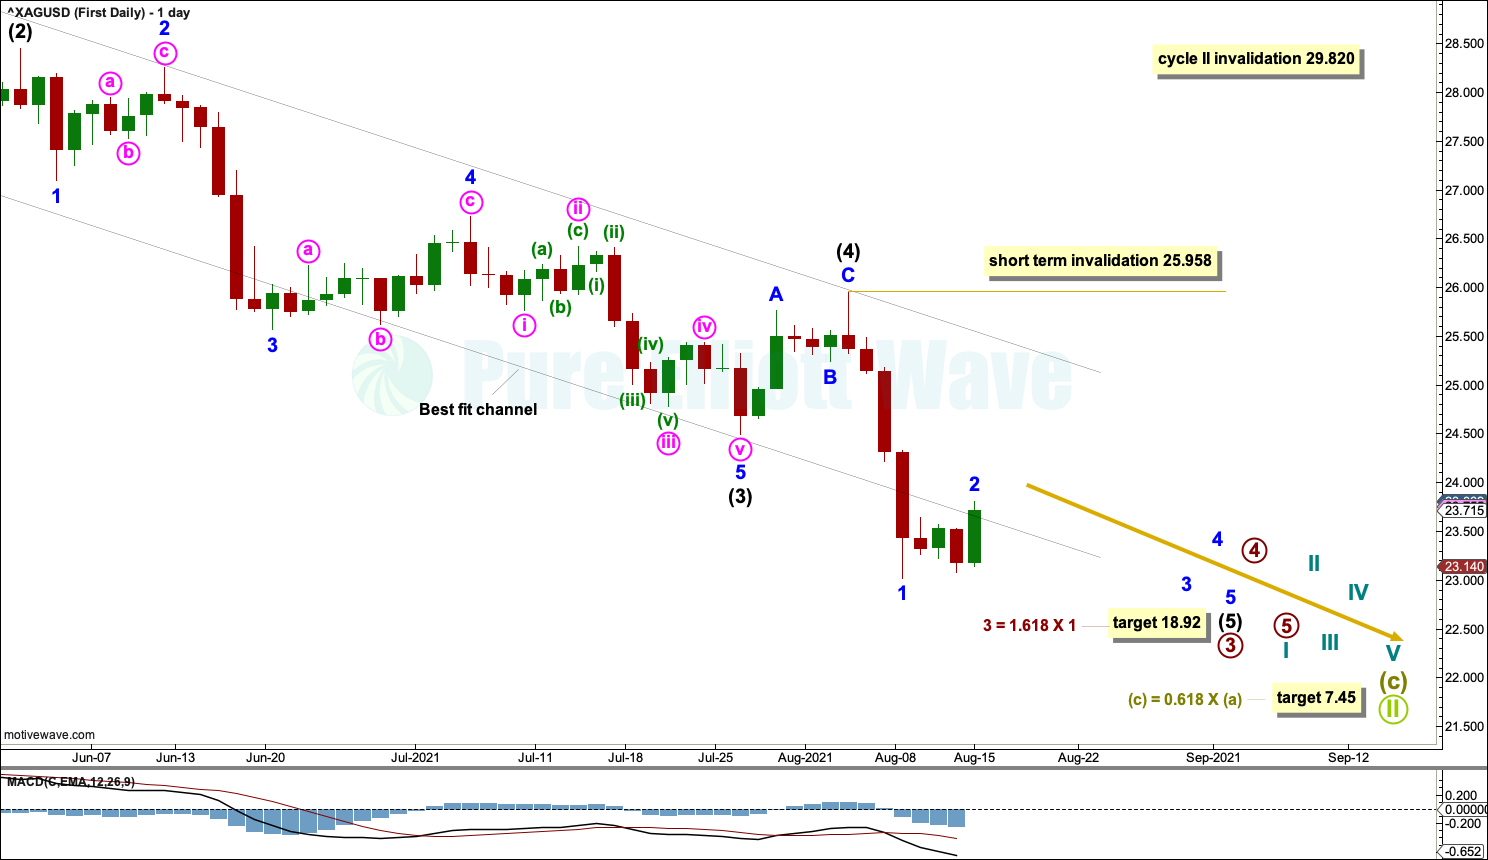
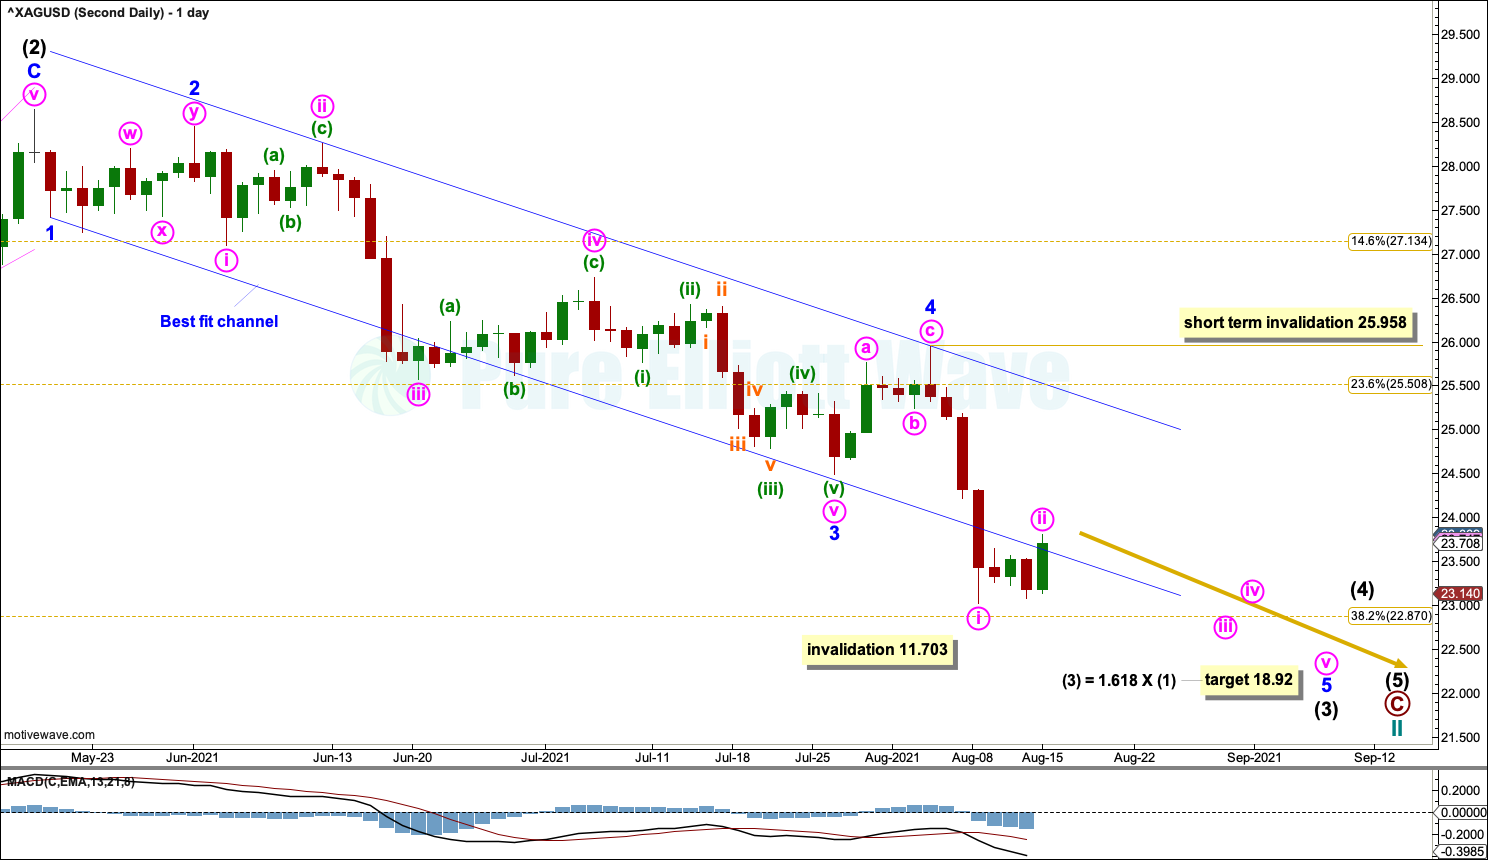
Super Cycle wave (c) downwards may be underway.
Primary wave 3 within cycle wave I may have begun at the high on May 19th.
Primary wave 3 may only subdivide as an impulse. Intermediate waves (1) through to (4) within the impulse may now be complete. Intermediate wave (4) may have ended perfectly at resistance at the upper edge of the best fit channel. Along the way down, expect any bounces within intermediate wave (5) to again find resistance at the upper edge of the channel.
No second wave correction within intermediate wave (5) may move beyond its start above 25.958.
Intermediate wave (5) may exhibit enough strength to break below the lower edge of the channel, which may then provide resistance.
Fifth waves to end third wave impulses one degree higher can end with strength for commodities. Look for the possibility that intermediate wave (5) may exhibit an increase in strength, particularly minor wave 3 within intermediate wave (5).
SECOND ELLIOTT WAVE COUNT
MONTHLY CHART
Click chart to enlarge.
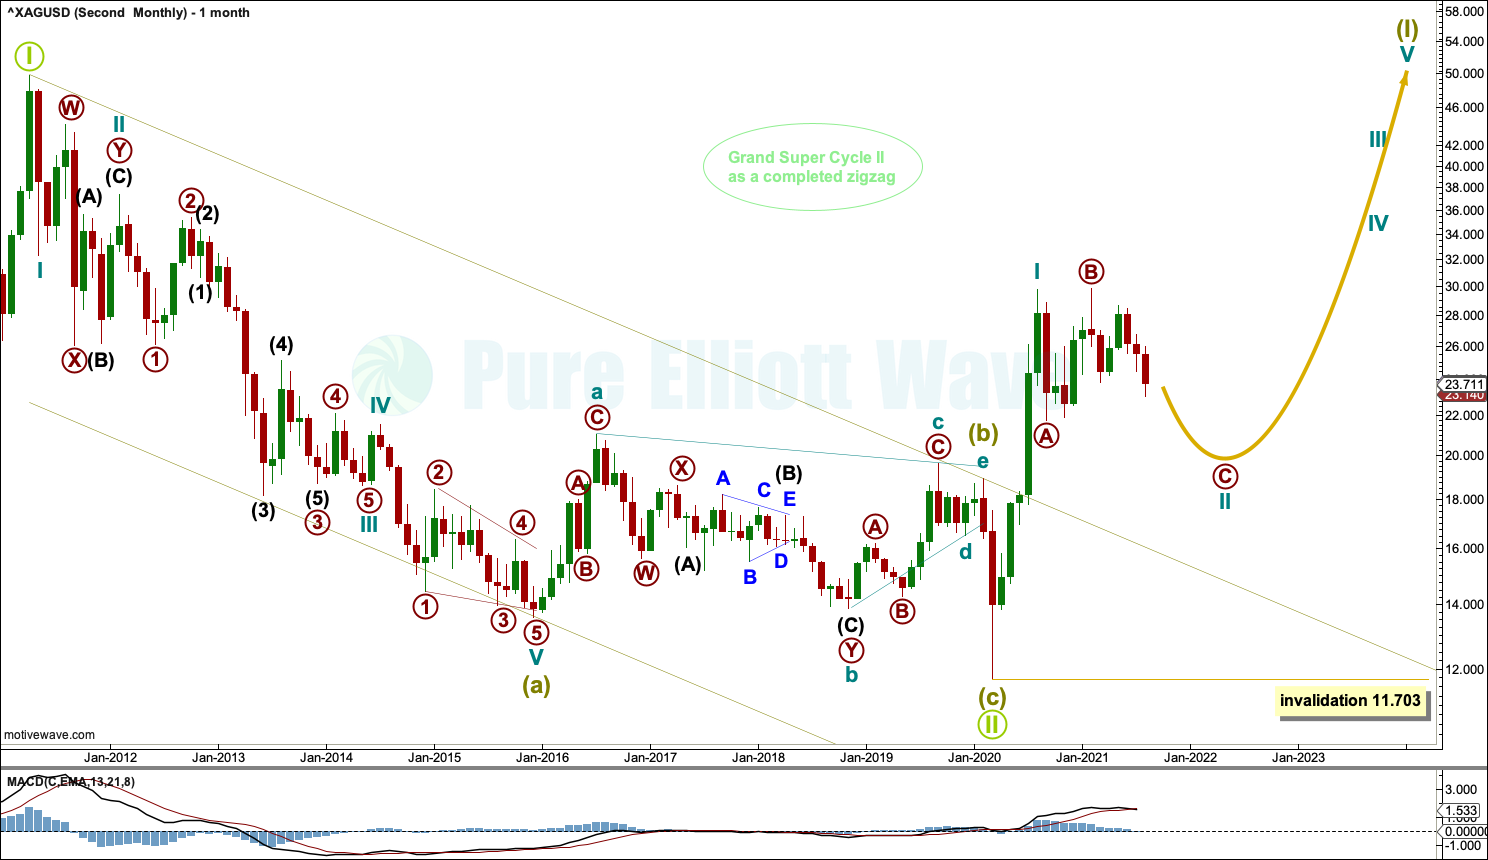
The bear market for Silver may be complete.
This Elliott wave structure for this bear market is labelled as a single zigzag for Grand Super Cycle wave II. Single zigzags are the most common Elliott wave corrective structure.
Within the zigzag: Super Cycle wave (a) subdivides as a five wave impulse, Super Cycle wave (b) subdivides as a complete regular contracting triangle, and Super Cycle wave (c) subdivides as a complete five wave impulse that is relatively brief and shallow.
Elliott wave triangles normally adhere strictly to their trend lines. The triangle for Super Cycle wave (b) does not; the lower b-d trend line is overshot, which reduces the probability of this wave count and is one reason for publication of the first wave count.
When charts are drawn on a semi-log scale, price has now breached the upper edge of the trend channel. Copy this channel over to weekly and daily charts. The upper edge of this channel may now provide support.
Grand Super Cycle wave III must subdivide as a five wave impulse at Super Cycle degree.
WEEKLY CHART
Click chart to enlarge.
The channel about Grand Super Cycle wave II is copied over from the monthly chart and extended outwards.
Cycle wave II may continue as a multi-month pullback. Cycle wave II may be subdividing as a regular flat. A likely point for cycle wave II to end may still be the 0.618 Fibonacci ratio of cycle wave I at 18.605. If this target is wrong, then it may not be low enough. The first major correction within a new trend is often very deep.
Primary wave B within the flat of cycle wave II is a 1.01 length of primary wave A. This is within the common range for B waves within flats of 1 to 1.38.
Primary wave C may now move lower for this wave count to at least make a slight new low below the end of primary wave A at 21.749 to avoid a truncation and a very rare running flat.
Cycle wave II may not move beyond the start of cycle wave I below 11.703.
Within primary wave C: Intermediate waves (1) and (2) may now be complete, and intermediate wave (3) may only subdivide as an impulse. Intermediate wave (3) must move beyond the end of intermediate wave (1) below 23.808. Intermediate wave (3) must move far enough below the end of intermediate wave (3) to allow intermediate wave (4) to then unfold and remain below intermediate wave (1) price territory.
DAILY CHART
Click chart to enlarge.
Within primary wave C: Intermediate waves (1) and (2) may now be complete, and intermediate wave (3) may only subdivide as an impulse.
Minor waves 1 through to 4 within intermediate wave (3) may now be complete. Minor wave 4 may have ended perfectly at the upper edge of the channel.
Minor wave 5 may now be underway. No second wave correction within minor wave 5 may move beyond its start above 25.958. Bounces within minor wave 5 may find resistance at the upper edge of the channel.
Minor wave 5 may have the power to break below support at the lower edge of the channel. The lower edge of the channel may then provide resistance.
TECHNICAL ANALYSIS
WEEKLY CHART
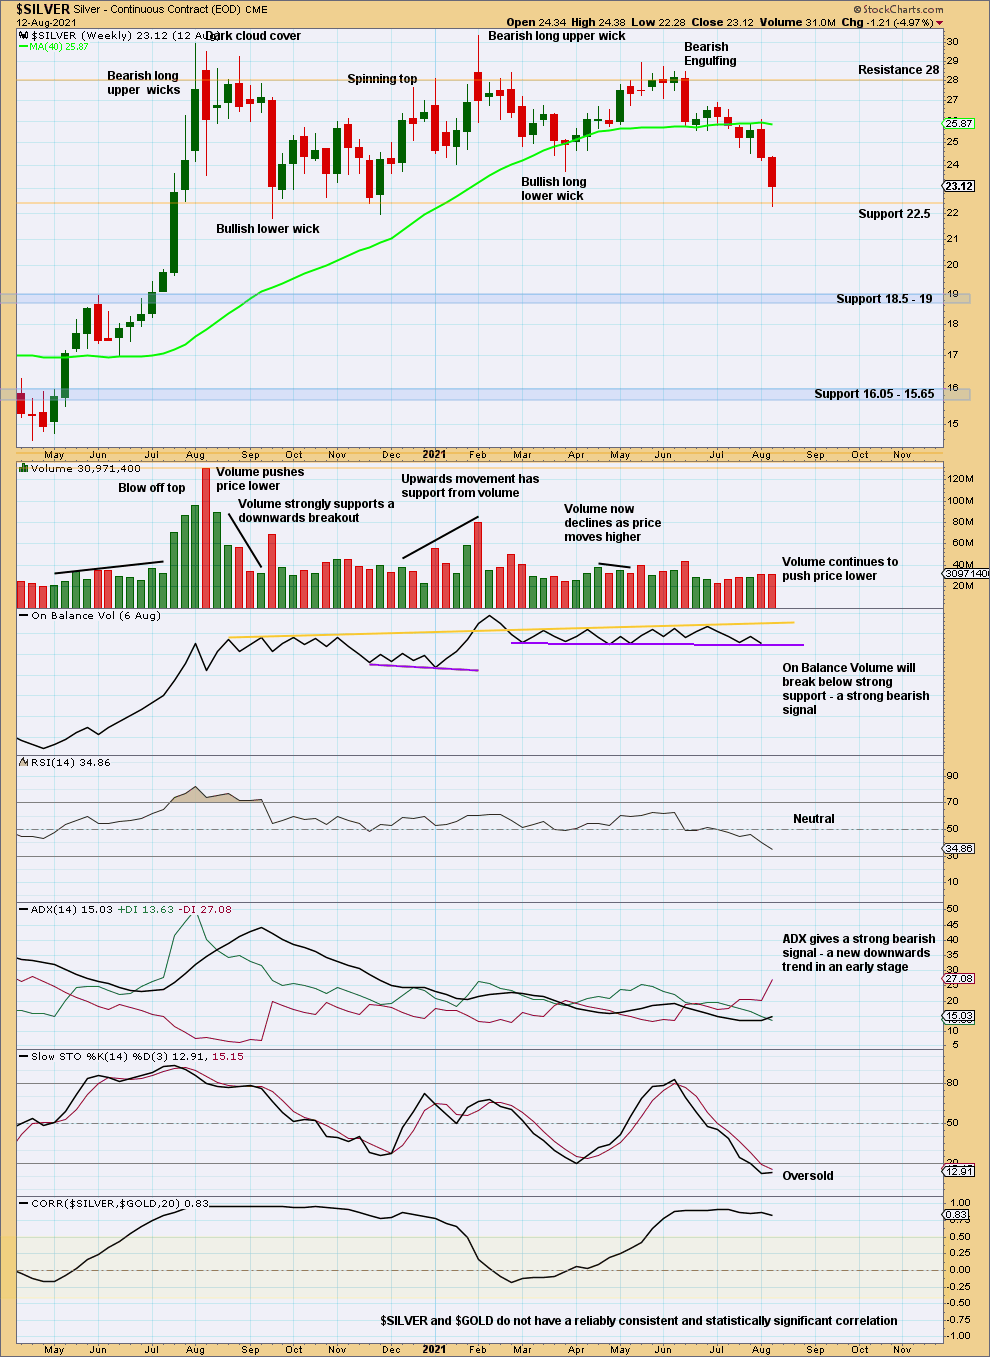
Click chart to enlarge. Chart courtesy of StockCharts.com.
This week price has found support and bounced up off 22.5. Push from volume and a bearish signal from On Balance Volume (which will show when Friday’s session is closed) suggests a downwards breakout may come now sooner rather than later.
DAILY CHART
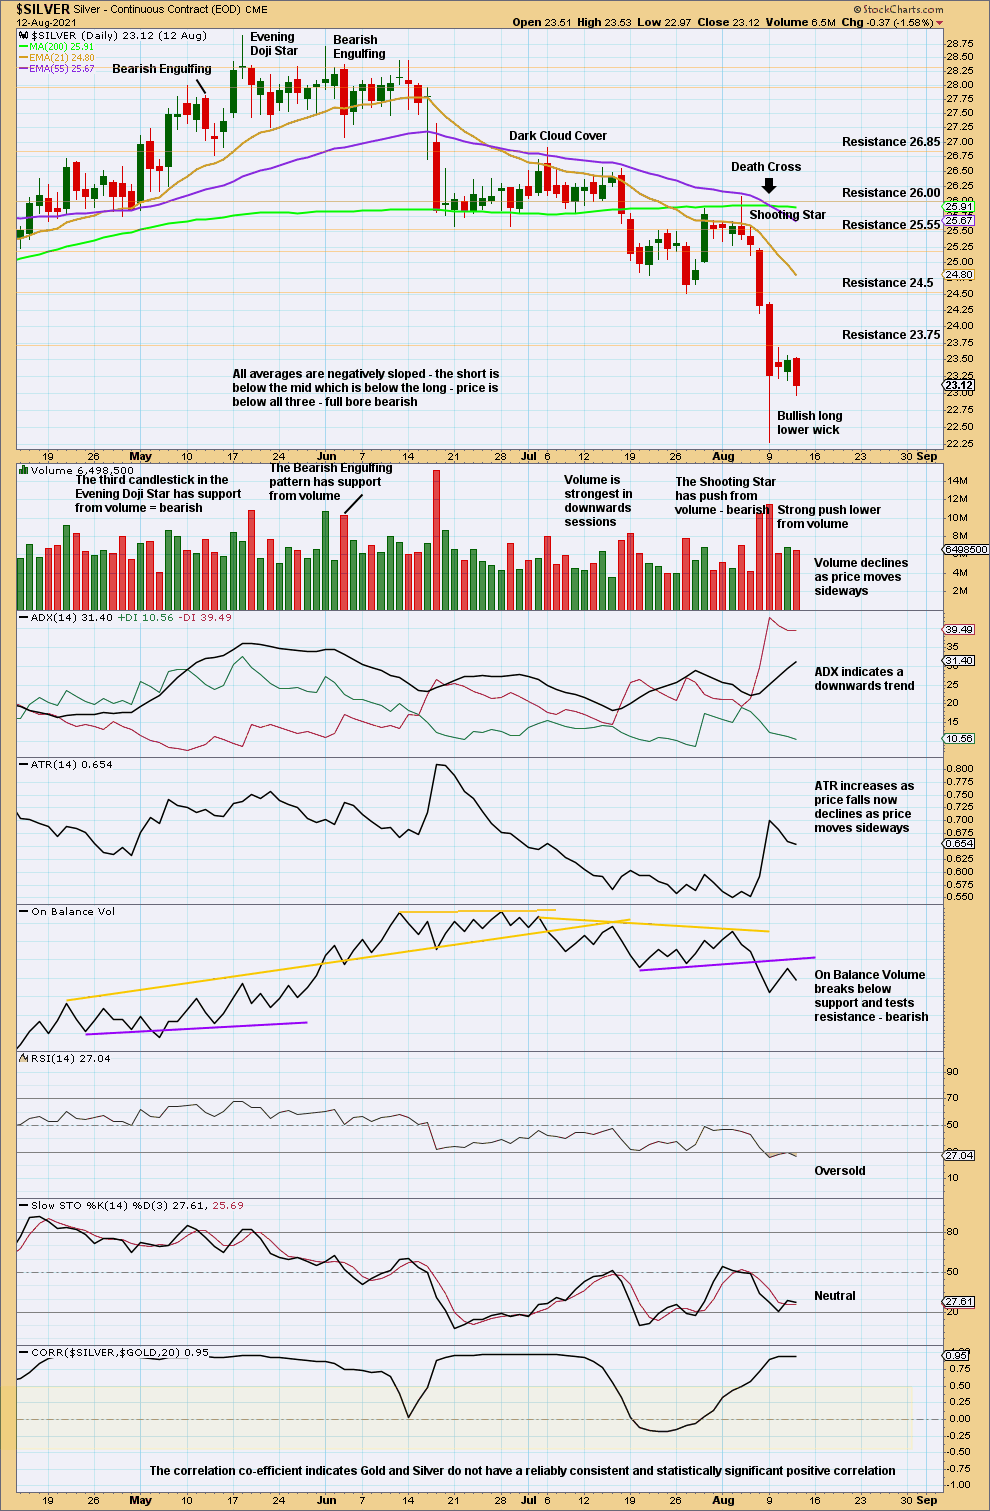
Click chart to enlarge. Chart courtesy of StockCharts.com.
Price has bounced up off important support (seen on the weekly chart). After a strong push lower, the last three sessions may have relieved pressure. There is a downwards trend that has plenty of room to run before conditions become extreme.
Published @ 03:56 p.m. ET.
—
Careful risk management protects your investing account(s).
Follow my two Golden Rules for investing:
1. Invest only funds you can afford to lose entirely.
2. Always have an exit plan for both directions; when or where to take profit, and when or where to exit an investment if it is losing.
—
New updates to this analysis are in bold.