
US OIL: Elliott Wave and Technical Analysis | Charts – August 13, 2021
The main Elliott wave count expected upwards movement for this week. Price has moved lower and looks like it may close as a doji, with the low for the week falling just short of the short-term invalidation point.
Summary: The main Elliott wave count expects upwards movement to resume to the next target at 112.79.
An alternate Elliott wave count allows for more downwards movement to end at support at the lower edge of a channel on the daily chart.
Oil may have found a major sustainable low in April 2020.
ELLIOTT WAVE COUNT
MONTHLY CHART
Click chart to enlarge.
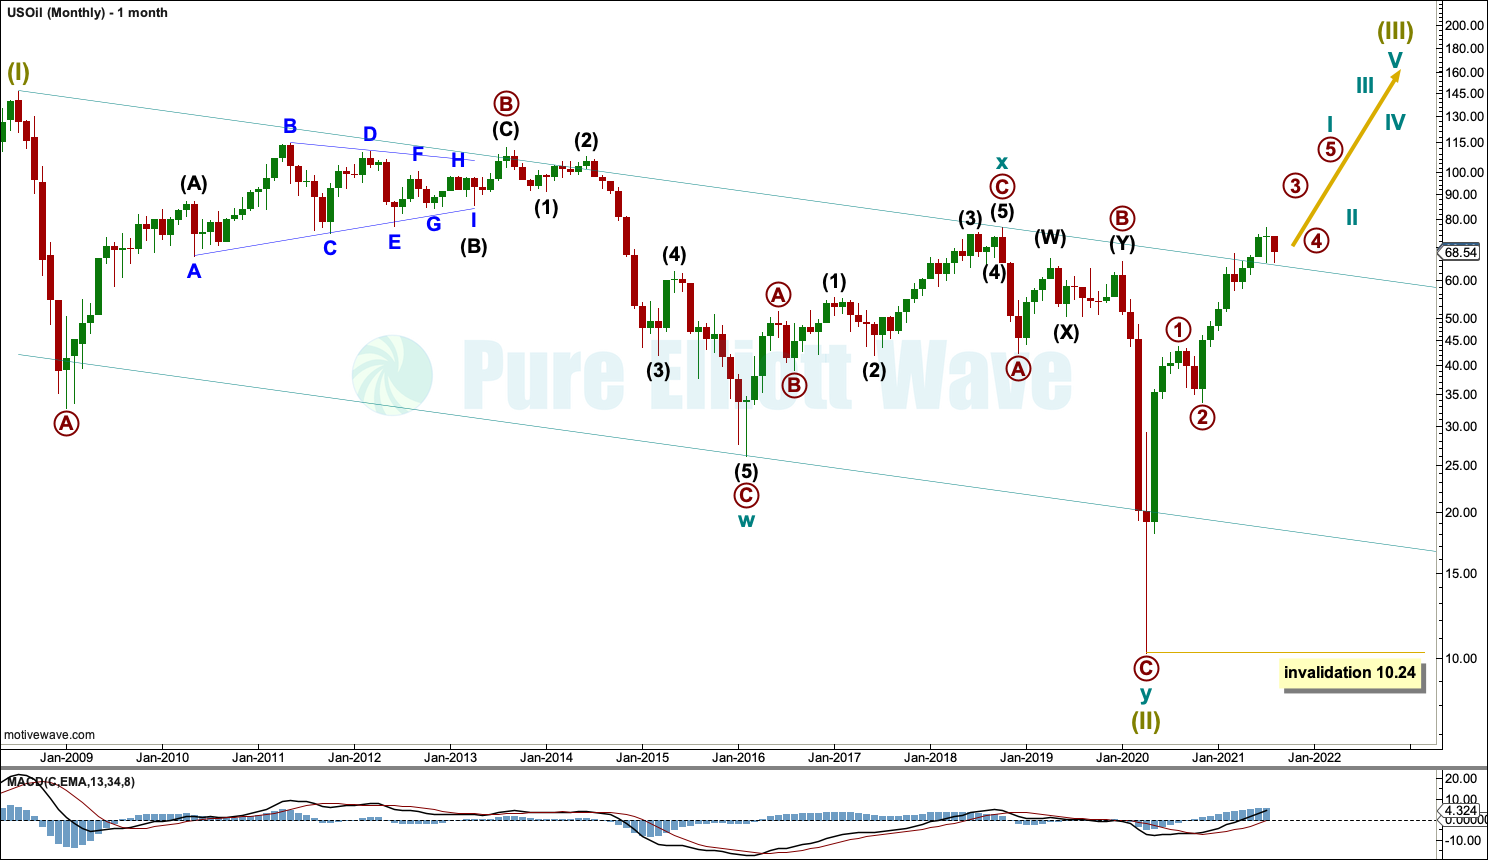
The basic Elliott wave structure is five steps forward and three steps back. This Elliott wave count expects that US Oil has completed a three steps back pattern, which began in July 2008. The Elliott wave count expects that the bear market for US Oil may now be over.
Following Super Cycle wave (II), which was a correction (three steps back), Super Cycle wave (III), which may have begun, should be five steps up when complete. Super Cycle wave (III) may last a generation and must make a new high above the end of Super Cycle wave (I) at 146.73.
A channel is drawn about Super Cycle wave (II): draw the first trend line from the start of cycle wave w to the end of cycle wave x, then place a parallel copy on the end of cycle wave w. This trend line is breached to the downside, which is a typical look for the end of a movement for a commodity.
The upper edge of the channel has now been breached by upwards movement. This trend line may now have provided support for the last pullback; the pullback this week looks to have again found support at the upper edge of this channel.
A new high above the high at 76.90 from October 2018 has been made. This is a significant new high and was expected from this wave count. Further confidence in a bull market for Oil may be had.
Super Cycle wave (III) may only subdivide as a five wave impulse. New trends for Oil usually start out very slowly with short first waves and deep time consuming second wave corrections. However, while this is a common tendency, it is not always seen and may not have been seen in this instance. The first reasonably sized pullback may be over already.
WEEKLY CHART
Click chart to enlarge.
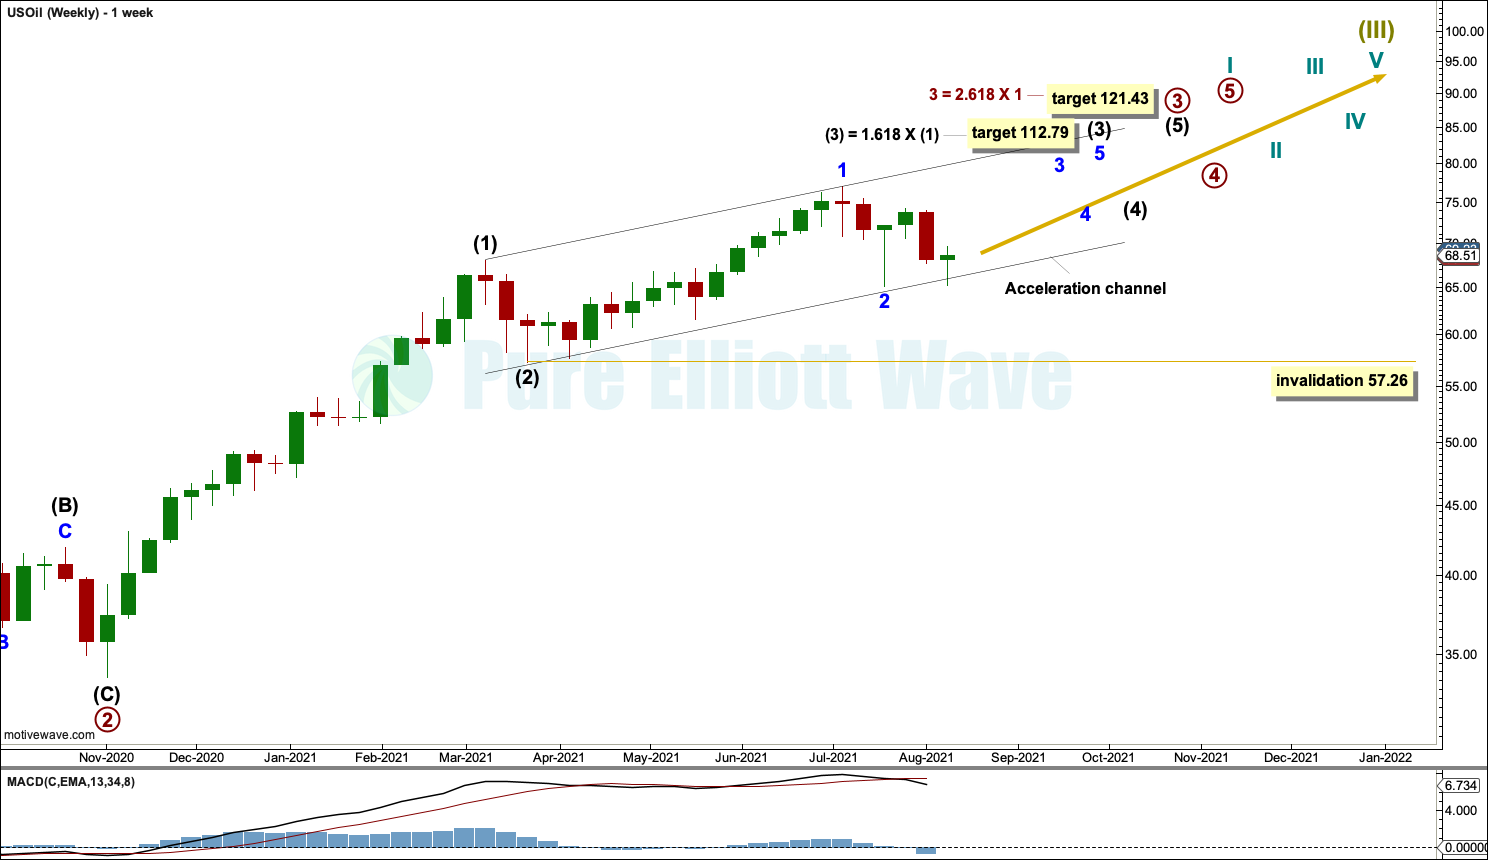
Super Cycle wave (III) must subdivide as an impulse.
Cycle wave I within Super Cycle wave (III) may be incomplete.
Within cycle wave I: Primary waves 1 and 2 may be complete, and primary wave 3 may only subdivide as an impulse.
Intermediate waves (1) and (2) within primary wave 3 may be complete. Minor wave 2 within intermediate wave (3) may not move beyond the start or minor wave 1 below 57.26.
Draw an acceleration channel about primary wave 3. Draw the first trend line from the end of intermediate wave (1) to the last high, then place a parallel copy on the end of intermediate wave (2). Keep redrawing the channel as price continues higher. The lower edge of the channel has this week provided some support for another pullback. On the weekly chart the channel is drawn on a semi-log scale, and on the daily chart below it is drawn on an arithmetic scale. Use the channel on both scales.
DAILY CHART
Click chart to enlarge.
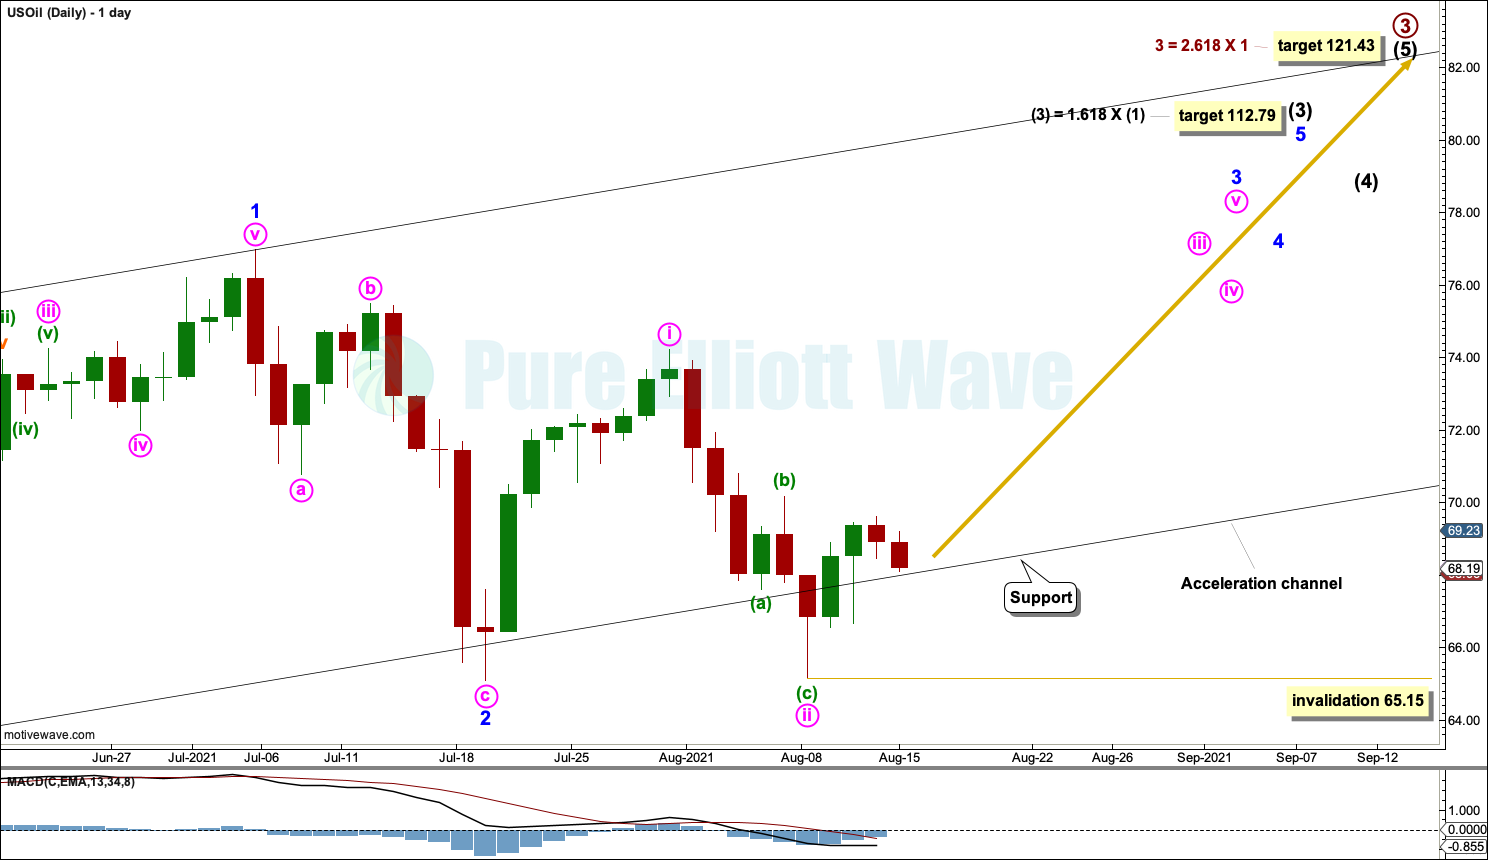
Minor wave 1 within intermediate wave (3) may be complete at the last high. The last pullback may be minor wave 2. Minor wave 2 may have ended about support at the lower edge of the acceleration channel.
Minor wave 3 may only subdivide as an impulse. Minute waves i and ii within minor wave 3 may now be complete.
Minute wave iii may only subdivide as an impulse. No second wave correction within minute wave iii may move beyond its start below 65.15.
This wave count is very bullish. It expects a third wave at minor, intermediate and primary degree may have just begun. An increase in upwards momentum would be expected.
When third waves extend their subdivisions are also extended and take more time. It is normal to see the middle of an extended third wave begin with a series of first and second waves.
ALTERNATE WEEKLY CHART
Click chart to enlarge.
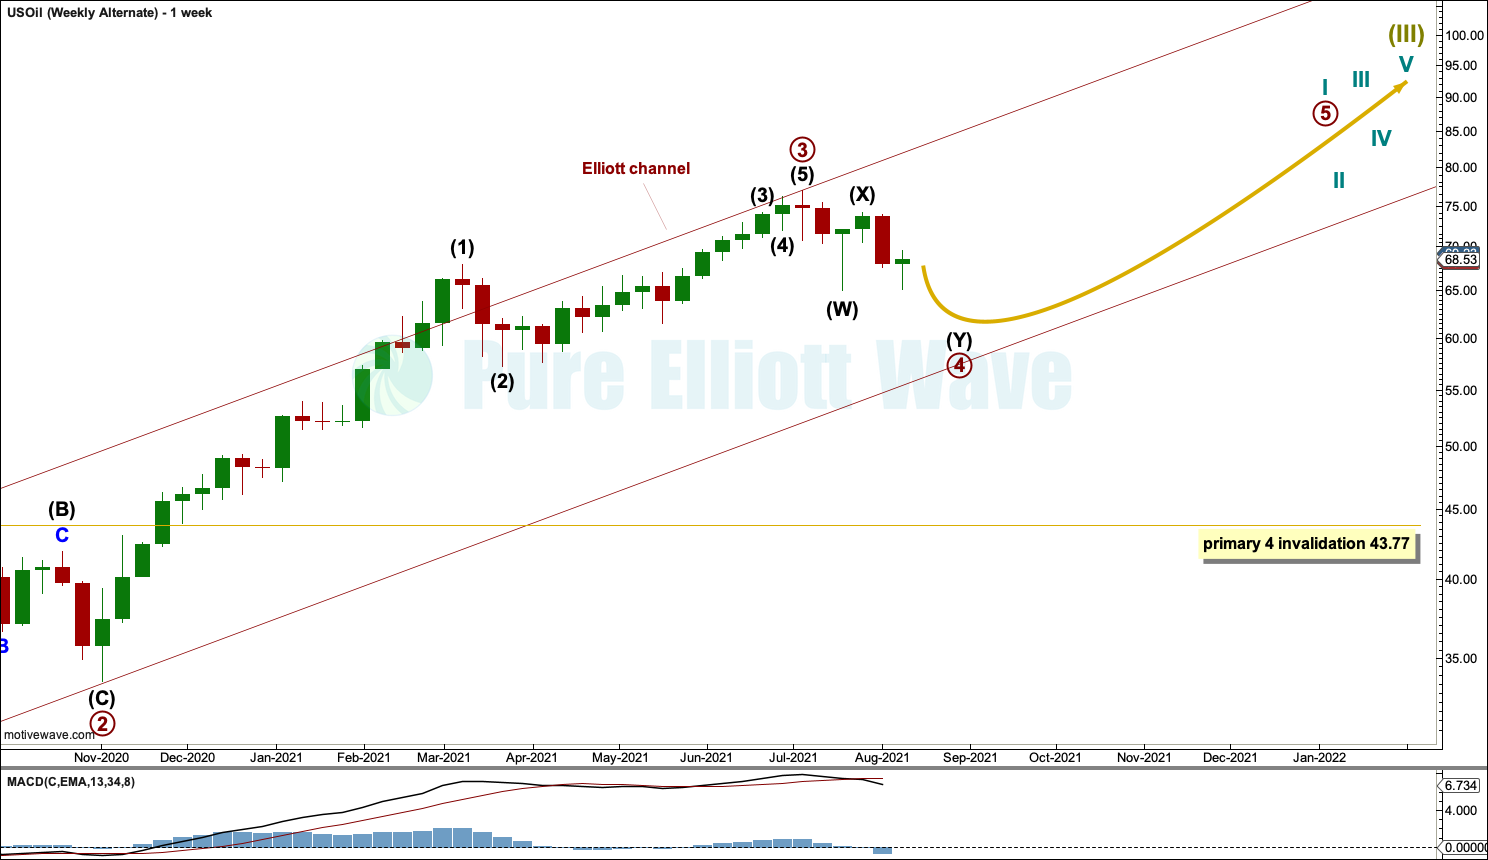
It is possible that primary waves 1, 2 and 3 within cycle wave I are complete. If primary wave 3 was complete at the last high, then the last pullback may have been the start of primary wave 4.
Primary wave 3 exhibits no Fibonacci ratio to primary wave 1. Primary wave 3 at 43.32 is longer than primary wave 1, which was 33.53.
Primary wave 2 lasted 10 weeks and subdivided as a single zigzag. Primary wave 4 may subdivide as any Elliott wave structure; so far it will be labelled as a possible double zigzag, but this labelling may need to change as it unfolds.
Primary wave 4 should last a few more weeks to be in better proportion to primary wave 2. Primary wave 4 may not move into primary wave 1 price territory below 43.77.
Draw an Elliott channel about the impulse of primary wave 3. Draw the first trend line from the ends of primary waves 1 to 3, then place a parallel copy on the end of primary wave 2. Primary wave 4 may find support about the lower edge of this channel.
When the channel is drawn about primary wave 3 there is an overshoot at the upper edge for intermediate wave (1). It is normal to see an overshoot of the trend channel on the side of the direction of the trend, but it is normally the third wave within the third wave as this is normally the strongest portion of a third wave impulse. This wave count does not have a normal look with the channel.
ALTERNATE DAILY CHART
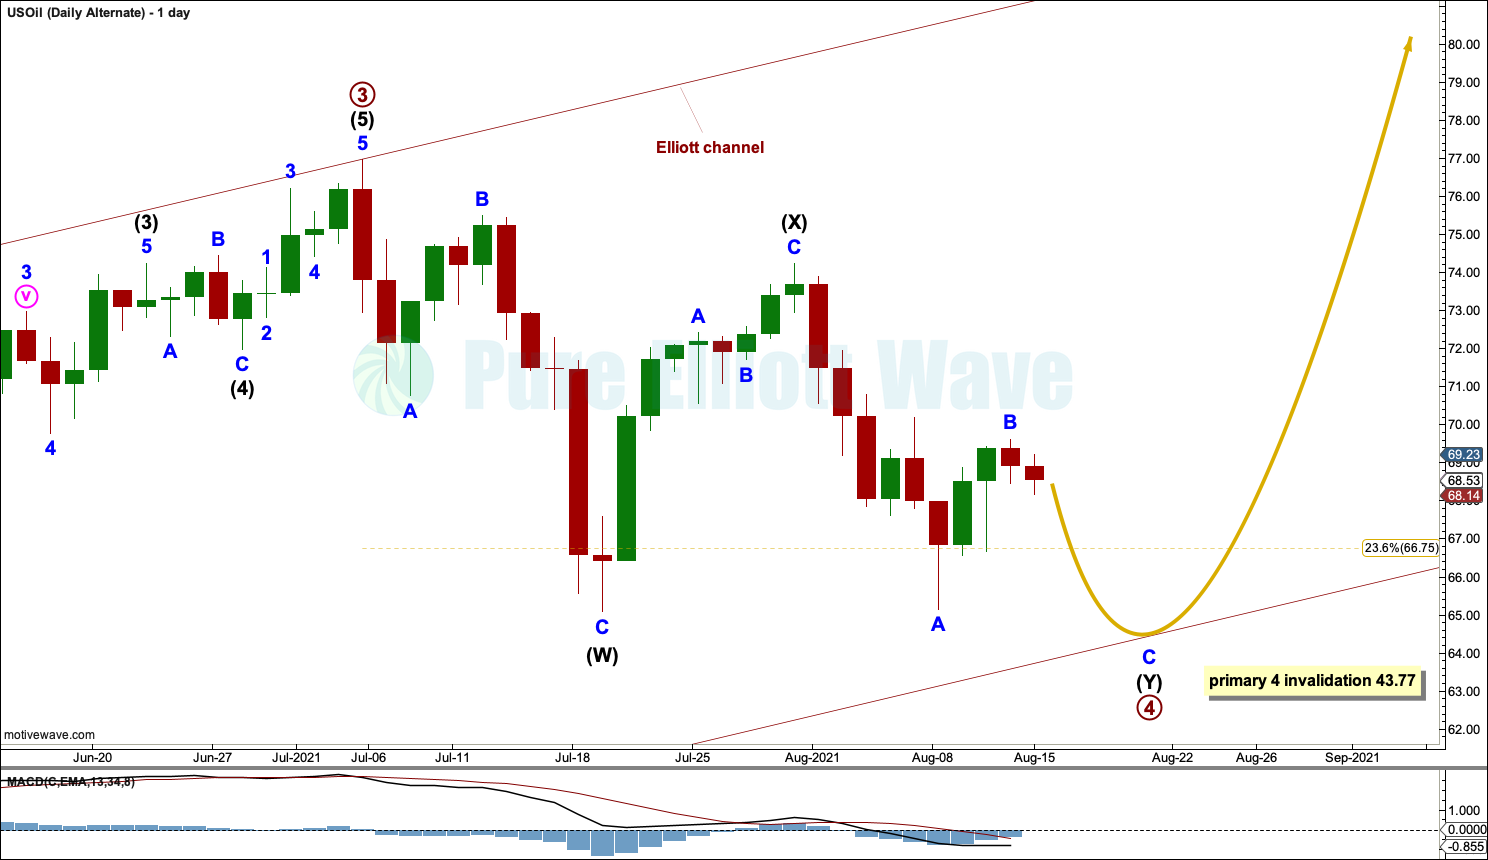
Click chart to enlarge.
Primary wave 4 may unfold as any one of more than 23 possible corrective Elliott wave structures. So far it will be labelled as a possible double zigzag to move lower to find support about the lower edge of the Elliott channel, but it may also continue sideways as a combination, flat or triangle.
It would be most likely that primary wave 4 would not be over at the last low. It would look too brief in comparison to primary wave 2.
If primary wave 4 unfolds as a double zigzag as labelled, then it may end about support at the lower edge of the channel, which may be about 64.25.
TECHNICAL ANALYSIS
WEEKLY CHART
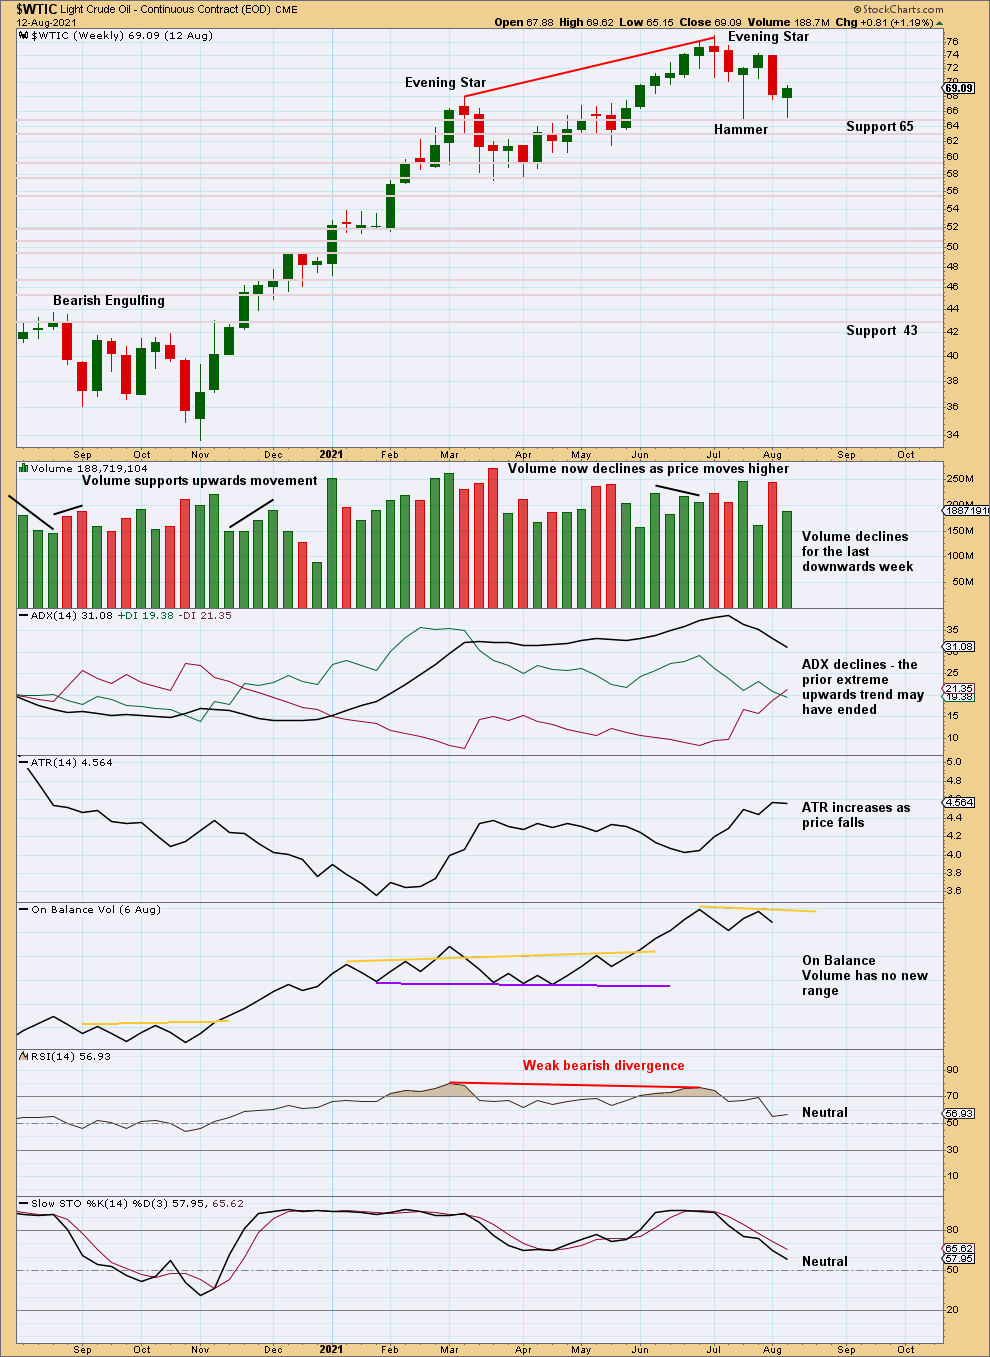
Click chart to enlarge. Chart courtesy of StockCharts.com.
A double bottom may have formed here at strong support about 65. The current weekly candlestick looks likely to close as another Hammer pattern. If so, then upwards movement would be likely next week.
DAILY CHART
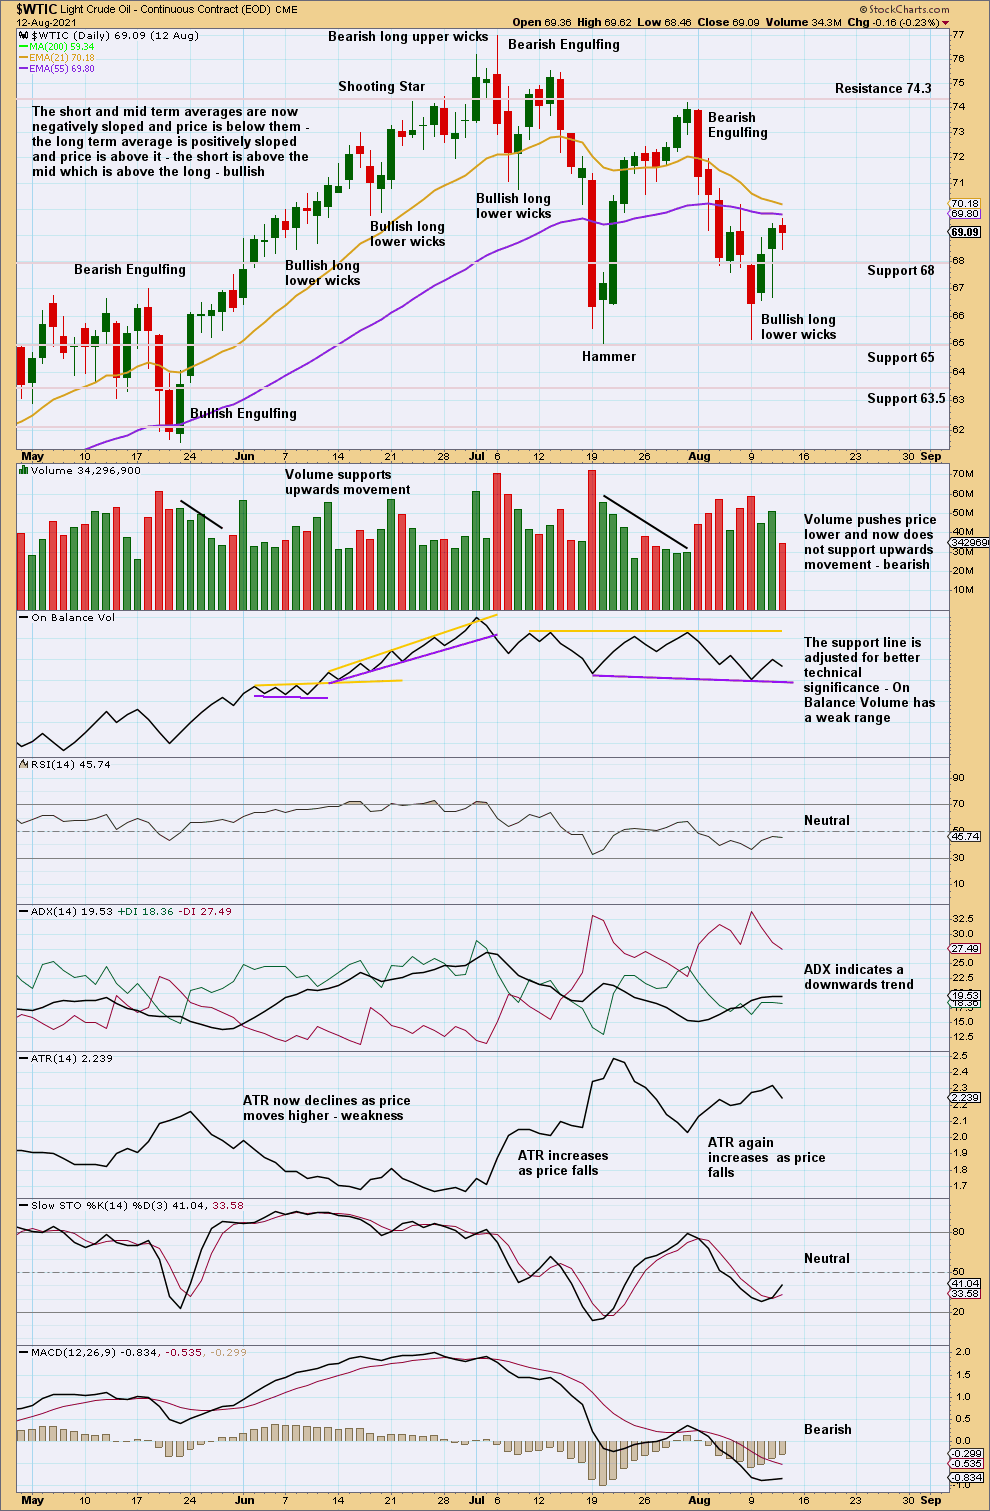
Click chart to enlarge. Chart courtesy of StockCharts.com.
Support at 65 has held, so technical strength there is increased. Bullish long lower wicks at the last low with support from volume for upwards movement suggest more upwards movement next week.
Published @ 03:42 p.m. ET.
—
Careful risk management protects your investment account(s).
Follow my two Golden Rules:
1. Invest only funds you are prepared to lose entirely.
2. Always have an exit strategy for both directions; when or where to take profit on a winning investment, and when or where to close a losing investment.
—
New updates to this analysis are in bold.
—