
US OIL: Elliott Wave and Technical Analysis | Charts – August 20, 2021
Downwards movement this week has invalidated the main daily Elliott wave count for the daily chart. That wave count is now discarded in favour of an alternate Elliott wave count.
Summary: The Elliott wave count now expects downwards movement may end about 60.42 with an overshoot of the lower edge of the channel on the daily chart. Thereafter, the upwards trend may resume. The invalidation point is at 43.77.
Oil may have found a major sustainable low in April 2020.
ELLIOTT WAVE COUNT
MONTHLY CHART
Click chart to enlarge.
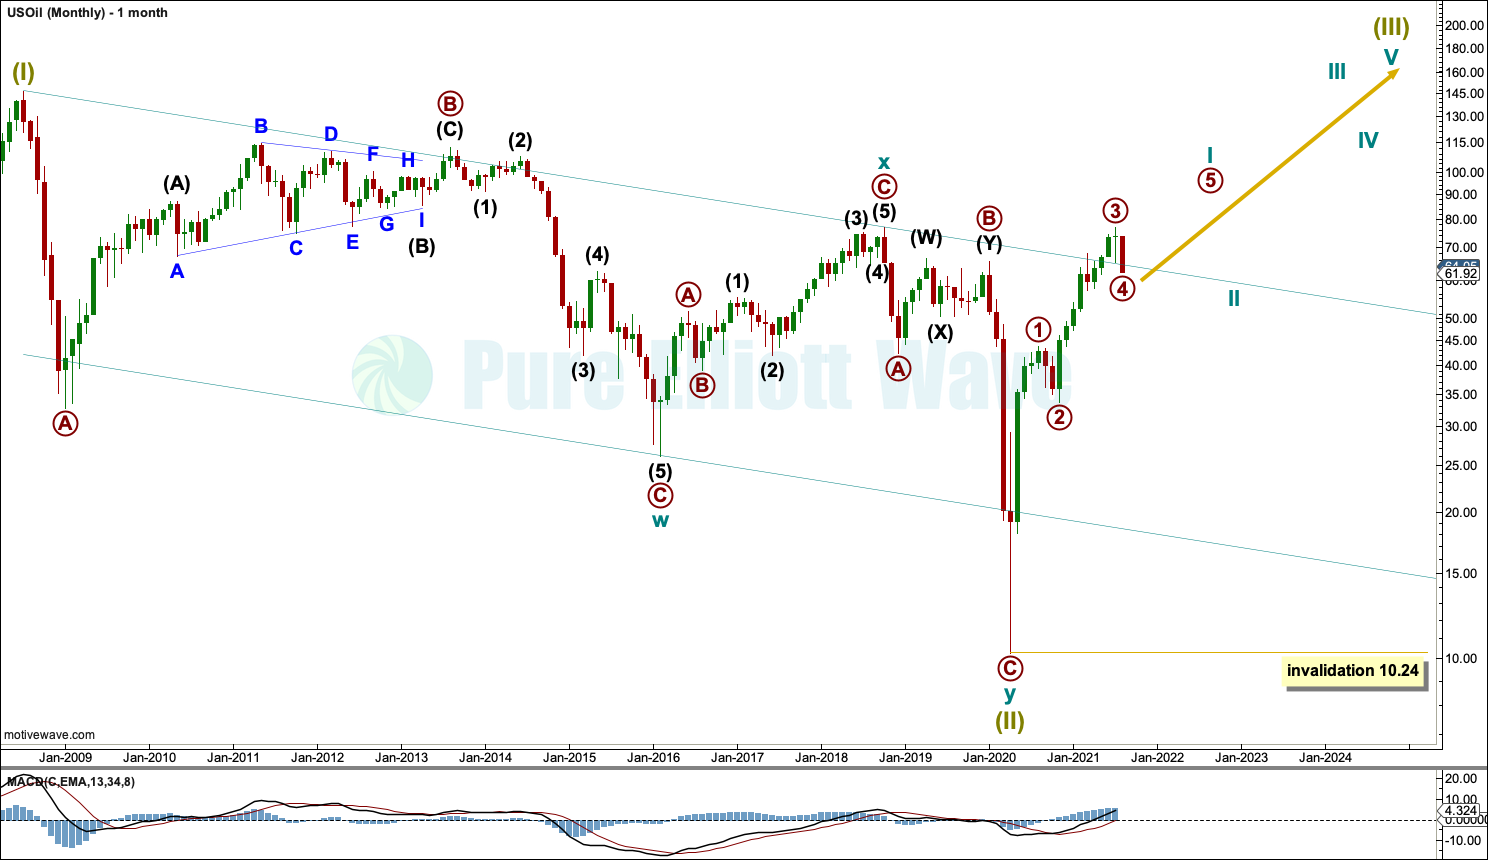
The basic Elliott wave structure is five steps forward and three steps back. This Elliott wave count expects that US Oil has completed a three steps back pattern, which began in July 2008. The Elliott wave count expects that the bear market for US Oil may now be over.
Following Super Cycle wave (II), which was a correction (three steps back), Super Cycle wave (III), which may have begun, should be five steps up when complete. Super Cycle wave (III) may last a generation and must make a new high above the end of Super Cycle wave (I) at 146.73.
A channel is drawn about Super Cycle wave (II): draw the first trend line from the start of cycle wave w to the end of cycle wave x, then place a parallel copy on the end of cycle wave w. This trend line is breached to the downside, which is a typical look for the end of a movement for a commodity.
The upper edge of the channel has now been breached by upwards movement. The current pullback has now moved back within the channel. The upper edge did not provide support as expected.
A new high above the high at 76.90 from October 2018 has been made. This is a significant new high and was expected from this wave count. Further confidence in a bull market for Oil may be had.
Super Cycle wave (III) may only subdivide as a five wave impulse. New trends for Oil usually start out very slowly with short first waves and deep time consuming second wave corrections. However, while this is a common tendency, it is not always seen and may not have been seen in this instance. The first reasonably sized pullback may be over already.
WEEKLY CHART
Click chart to enlarge.
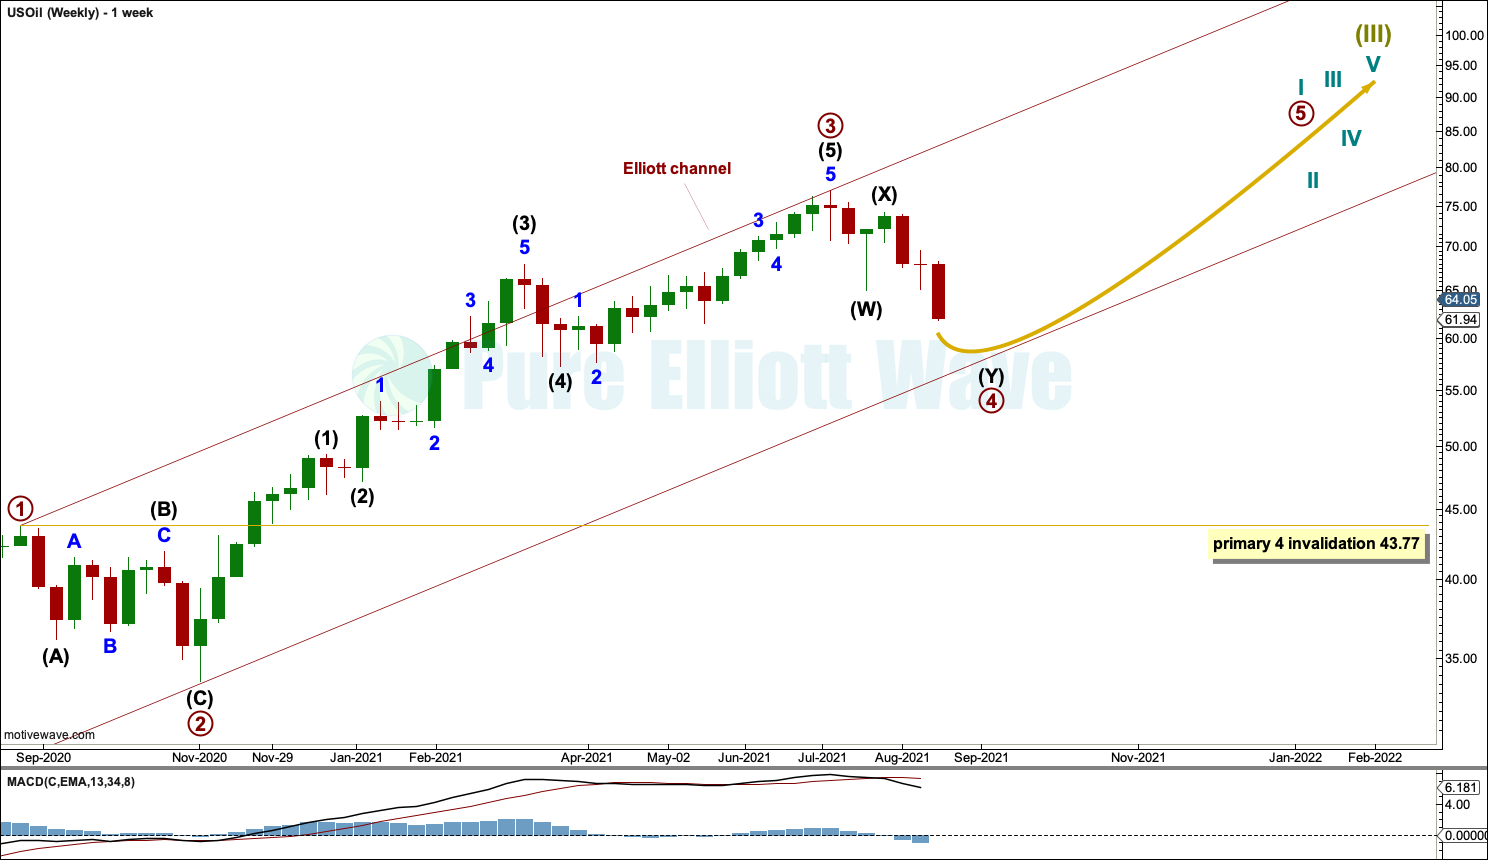
Super Cycle wave (III) must subdivide as an impulse.
Cycle wave I within Super Cycle wave (III) may be incomplete.
It is possible that primary waves 1, 2 and 3 within cycle wave I are complete. If primary wave 3 was complete at the last high, then the current pullback may be primary wave 4.
Primary wave 3 exhibits no Fibonacci ratio to primary wave 1. Primary wave 3 at 43.32 is longer than primary wave 1, which was 33.53.
Primary wave 2 lasted 10 weeks and subdivided as a single zigzag. Primary wave 4 may subdivide as any Elliott wave structure; so far it will be labelled as a possible double zigzag, but this labelling may need to change as it unfolds.
Primary wave 4 should last another one to very few weeks to be in better proportion to primary wave 2. Primary wave 4 may not move into primary wave 1 price territory below 43.77.
Draw an Elliott channel about the impulse of primary wave 3. Draw the first trend line from the ends of primary waves 1 to 3, then place a parallel copy on the end of primary wave 2. Primary wave 4 may find support about the lower edge of this channel when it is drawn on a semi-log scale.
Labelling within primary wave 3 is this week adjusted; this has a better fit. Now the overshoot of the upper edge of the channel is the end of intermediate wave (3) within primary wave 3.
DAILY CHART
Click chart to enlarge.
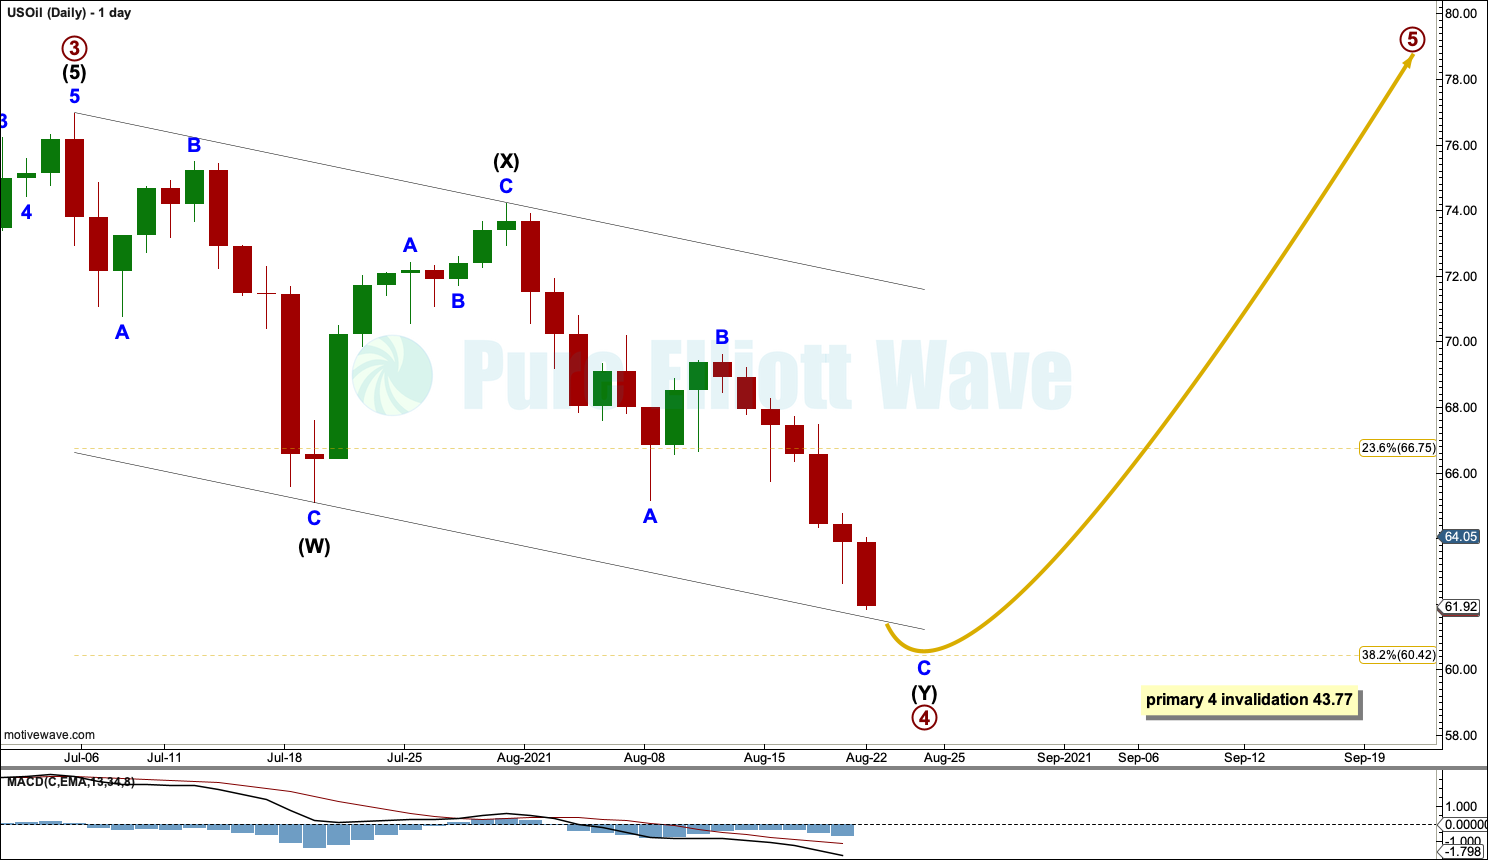
Primary wave 4 may unfold as any one of more than 23 possible corrective Elliott wave structures. So far it will be labelled as a possible double zigzag to move lower to find support about the lower edge of the Elliott channel, but it may also continue sideways as a combination, flat or triangle.
It would be most likely that primary wave 4 would not be over. It would look too brief in comparison to primary wave 2.
A channel is drawn about primary wave 4. Price is today almost at support at the lower edge of the channel. Primary wave 4 may end with a small overshoot of the lower edge of the channel, which may see it end about the 0.382 Fibonacci ratio of primary wave 3 at 60.42.
TECHNICAL ANALYSIS
WEEKLY CHART
Click chart to enlarge. Chart courtesy of StockCharts.com.
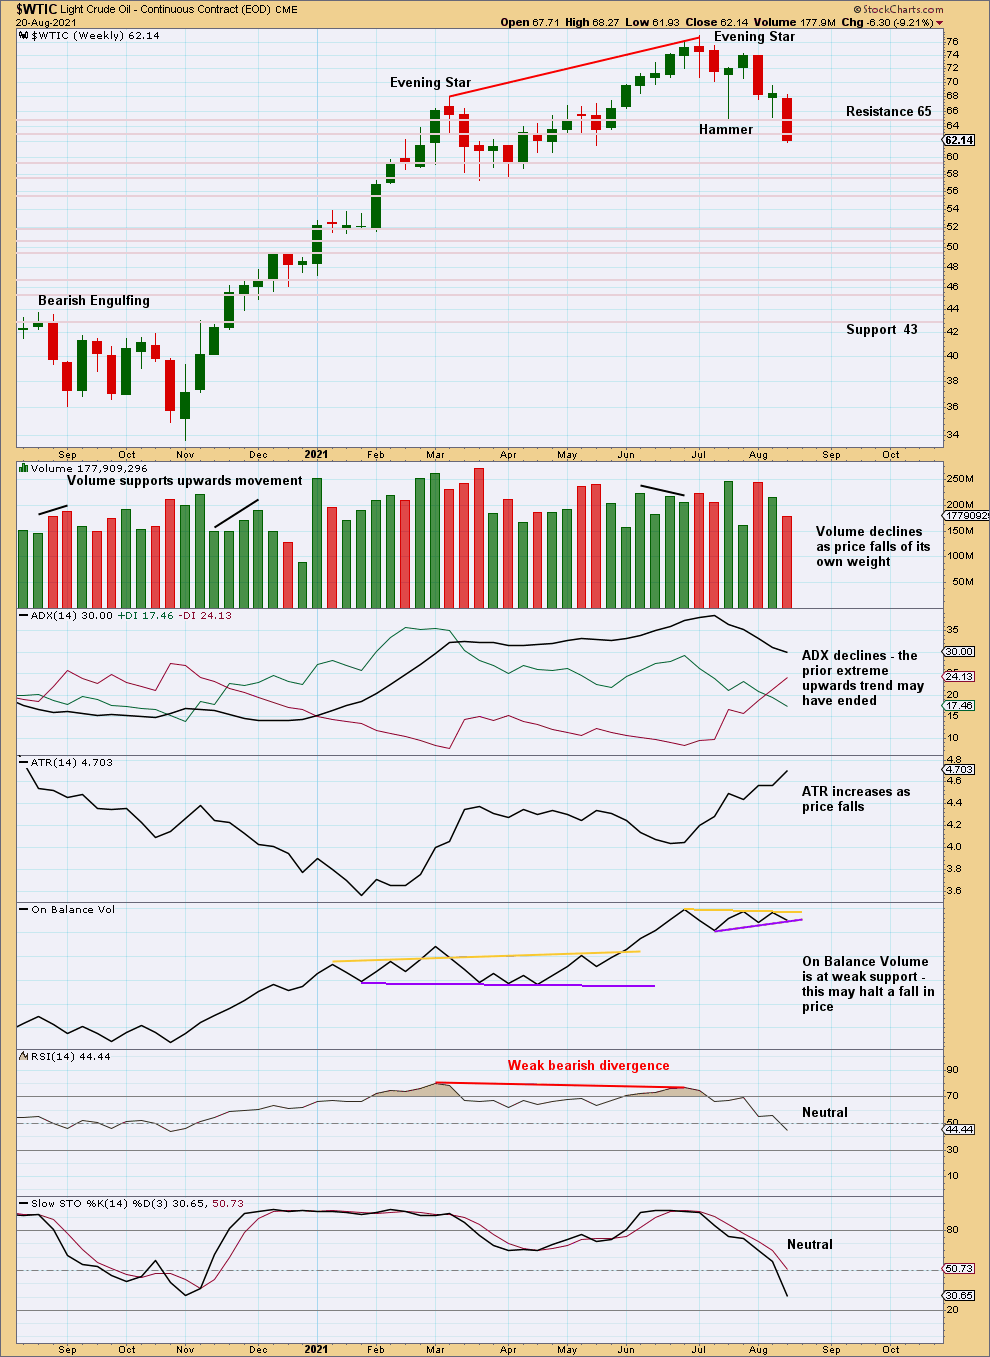
Price has closed below prior support about 65, which may now offer resistance. Price is now back within a strong cluster of support and resistance, which may slow it down. There is no clear trend at this time frame.
DAILY CHART
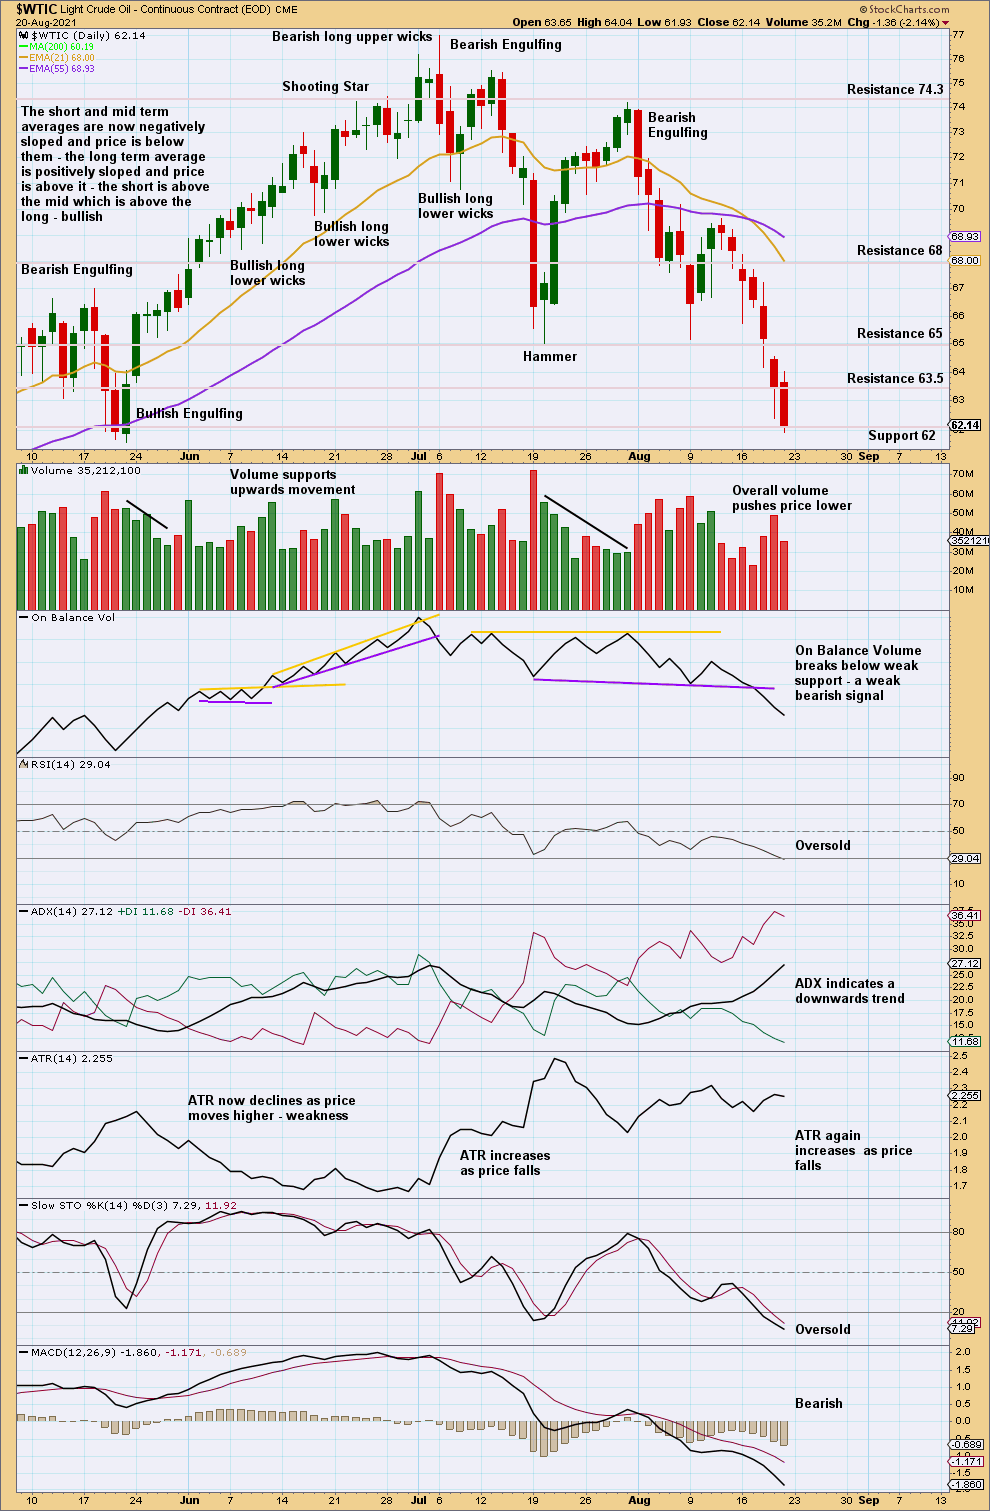
Click chart to enlarge. Chart courtesy of StockCharts.com.
There is a downwards trend, which is not yet extreme, and RSI is just now oversold. RSI can reach deeply oversold and remain there while price travels a considerable distance when this market has a strong downwards trend. Look for next support below about 60 and then about 58. If a bullish candlestick develops while conditions are extreme, then it may signal a trend change.
Published @ 06:05 p.m. ET.
—
Careful risk management protects your investment account(s).
Follow my two Golden Rules:
1. Invest only funds you are prepared to lose entirely.
2. Always have an exit strategy for both directions; when or where to take profit on a winning investment, and when or where to close a losing investment.
—
New updates to this analysis are in bold.
—