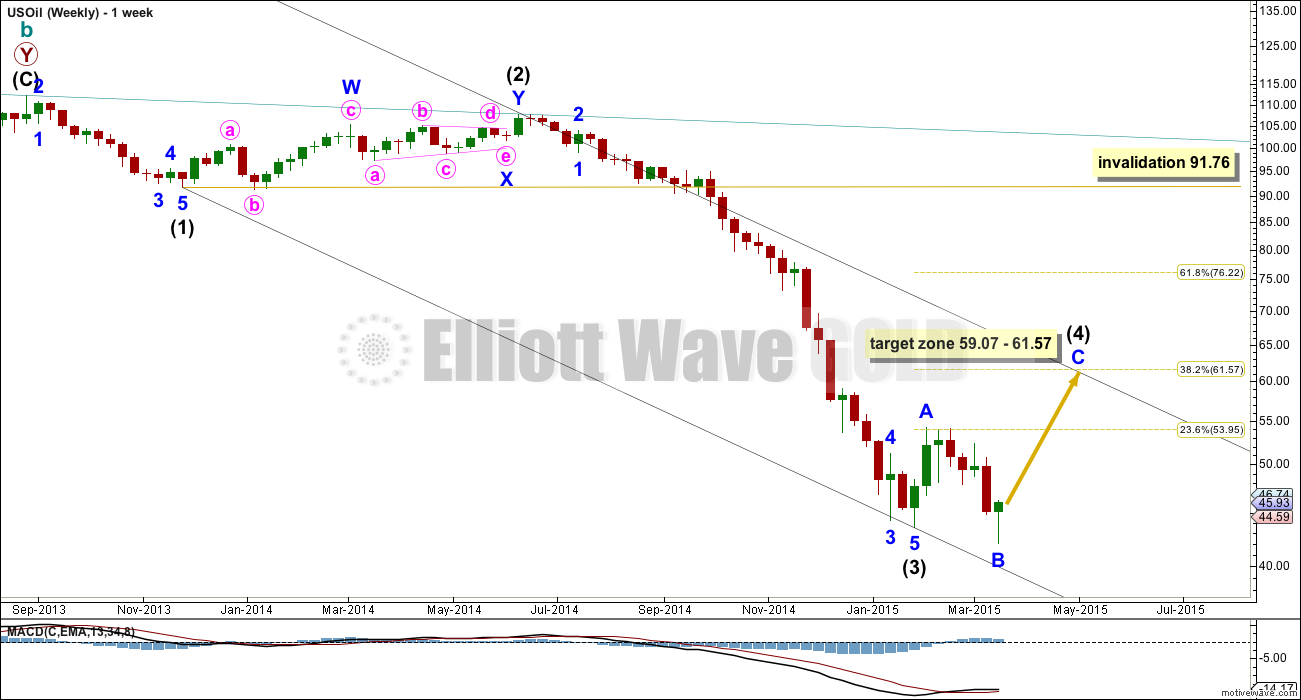
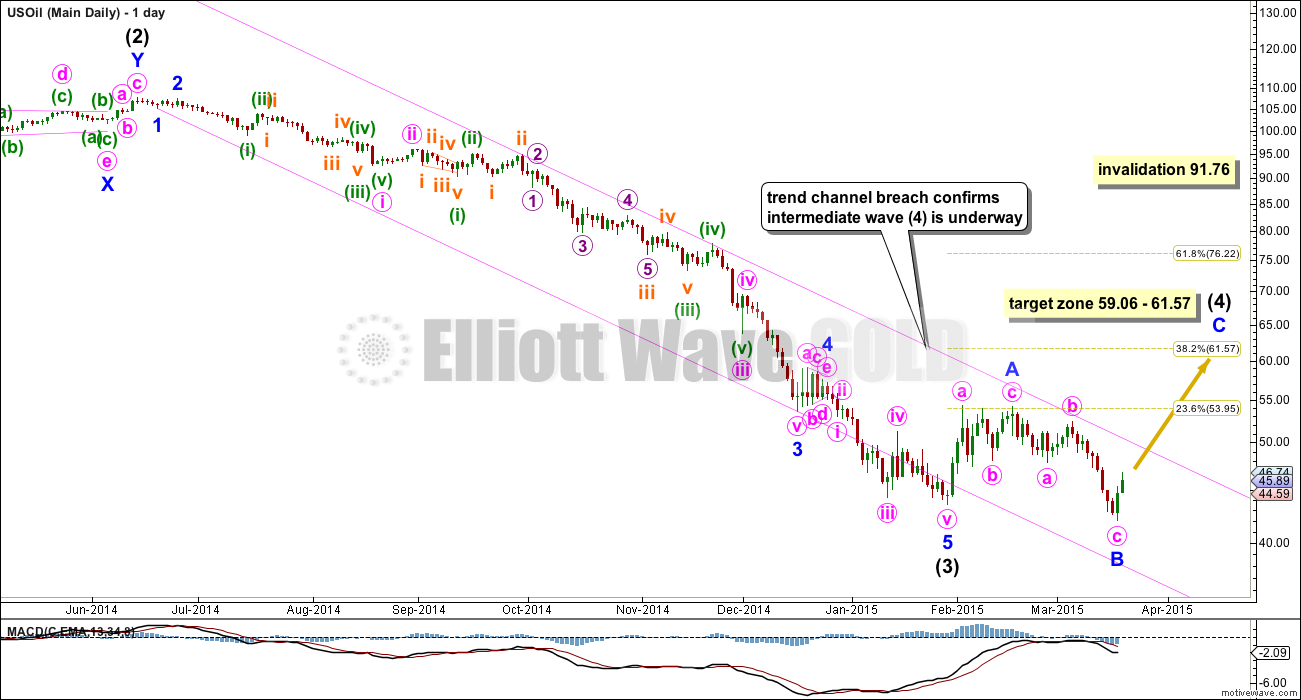
A big fourth wave correction is unfolding as expected from last Elliott wave analysis. Now there there is more structure to analyse a better target may be calculated.
Summary: I expect either some upwards movement to end 59.07 – 61.57 to be reached in about six weeks, or sideways movement for a big triangle which may last another 21 weeks. I do not expect US Oil to move above 91.76.
Click charts to enlarge.
Intermediate wave (4) may not move back into intermediate wave (1) price territory above 91.76.
Draw a channel about this downwards movement using Elliott’s first technique: draw the first trend line from the ends of intermediate waves (1) to (3), then place a parallel copy on the high of intermediate wave (2). I would expect intermediate wave (4) to find resistance at the upper edge of the channel, and it may end there.
Intermediate wave (2) was a deep 78% double combination. Given the guideline of alternation I would expect intermediate wave (4) to be more shallow. It may be a zigzag, flat or triangle most likely. If it is an expanded flat or running triangle it may include a new low below its start at 43.58.
Intermediate wave (4) would be most likely to end at either the 0.236 or 0.382 Fibonacci ratios of intermediate wave (3).
Intermediate wave (4) may be unfolding as a single flat, triangle, double flat or combination. A single flat or triangle are most likely to provide structural alternation with the double combination of intermediate wave (2).
If intermediate wave (4) is a flat correction then within it minor wave C is a 115% correction of minor wave A so this would be an expanded flat. Minor wave C would reach 1.618 the length of minor wave A at 59.07. A single flat correction may end more quickly, in maybe another six weeks for intermediate wave (4) to complete in a total Fibonacci 13 weeks.
If intermediate wave (4) is a triangle then it would be moving into minor wave C of a five wave regular contracting triangle. Minor wave C may not move beyond the end of minor wave A above 54.11. If we see movement above this price point in the next few weeks then intermediate wave (4) would most likely be a single flat. If price does not move above this point in the next few weeks then intermediate wave (4) may be a triangle which may be expected to be longer lasting with very choppy sideways movement in an ever decreasing range. It may end closer to the 0.236 Fibonacci ratio and it may take another 21 weeks to unfold.
Overall the consolidation phase for US Oil is not over. I expect more upwards and / or sideways movement. When it is done the breakout should be down for intermediate wave (5).


Lara, I believe oil is at an inflection point as there is a chance Int iv is complete. We are getting close to some key overlaps. Can you update today?
Hi Lara
Could update the oil count pls?
Thanks
Lara as oil approaches your target, it probably should be updated to zero in on a target. Unlike gold, this seems more straightforward.
Nice photo of a flower. You must have changed the photo above. Earlier there was no reflection of you off the glass window in the photo???
Lara: very nice report. Oil is better to trade and adheres to EW than gold.
Have wave A and wave B both met the rule of being 3-3 structure to meet flat requierment?
Oil has already made a new low below 43.58. Do you not expect another new low?
Above :” If it is an expanded flat or running triangle it may include a new low below its start at 43.58.”.