This Elliott wave count expects Gold is within a grand super cycle correction.
Historic Analysis.
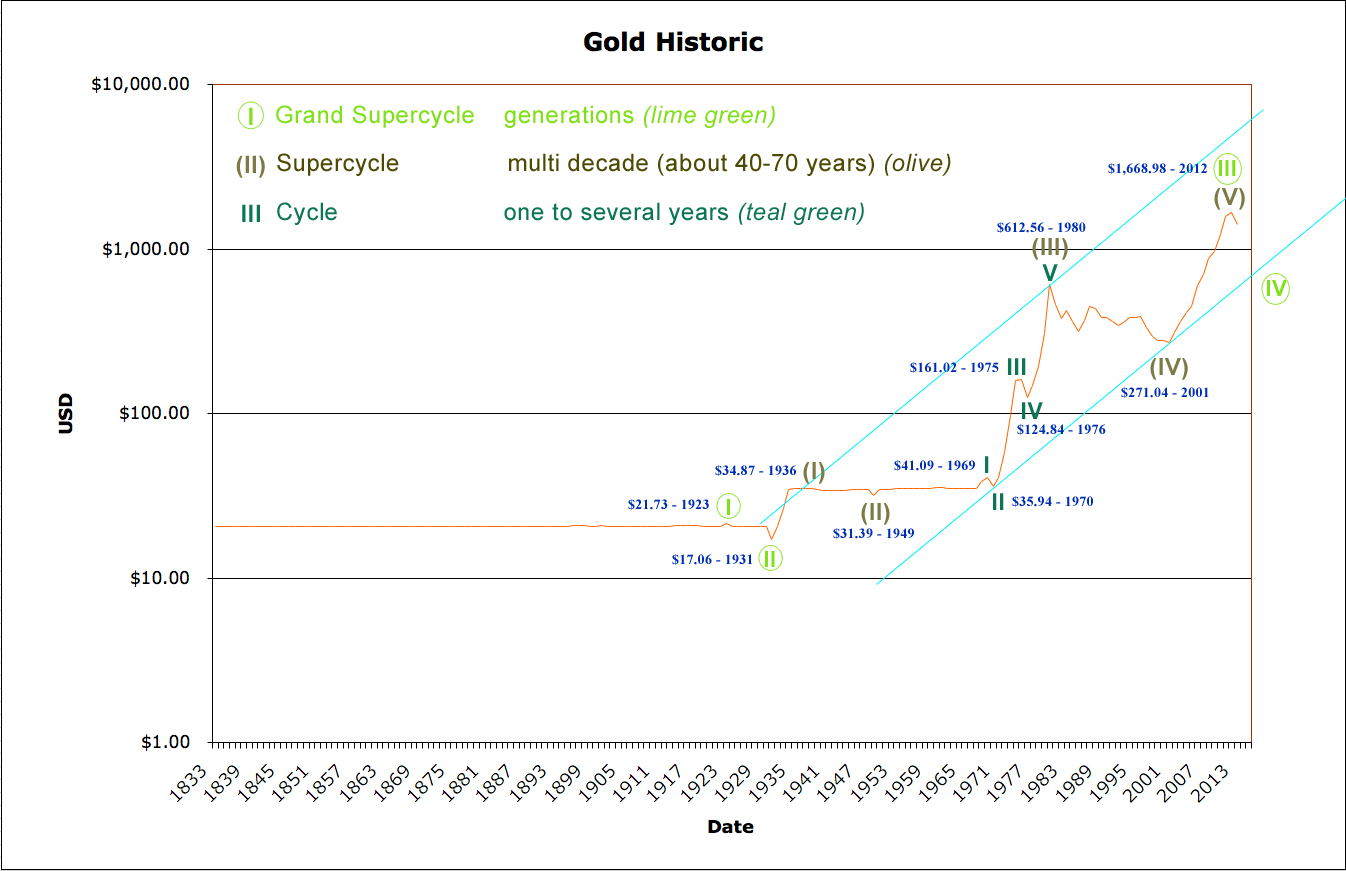
Data used for the chart above is averages for the year. It does not include high / low. Note the chart scale is a logarithmic scale. Data on this chart is only from 1833 to 2012. Subsequent price action is analysed on the monthly chart below.
This wave count expects Gold is within a grand super cycle fourth wave correction. Super cycle wave IV may not move into grand super cycle wave I price territory below 21.73.
Grand super cycle wave III lasted from 1931 to 2012, 81 years.
Ratios within grand super cycle wave III are: super cycle wave (I) (17.81 in length) has no Fibonacci ratio to super cycle wave (III) (581.17 in length), and super cycle wave (V) (1,397.94 in length) is 123.56 short of 2.618 the length of super cycle wave (III), an 8.8% variation (I consider less than 10% an acceptable ratio).
Within grand super cycle wave III, super cycle wave (I) lasted a Fibonacci 5 years, super cycle wave (II) lasted a Fibonacci 13 years, super cycle wave (III) lasted 31 years, super cycle wave (IV) lasted a Fibonacci 21 years, and super cycle wave (V) lasted 11 years.
Ratios within super cycle wave (III) are: cycle wave III (125.05 in length) has no adequate Fibonacci ratio cycle wave I (9.70 in length), and cycle wave V (487.72 in length) is 41.99 short of 4.236 the length of cycle wave III, an 8.6% variation.
Within super cycle wave (III), cycle wave I lasted twenty years (just one short of a Fibonacci twenty-one), cycle wave II lasted a Fibonacci one year, cycle wave III lasted a Fibonacci five years, cycle wave IV lasted a Fibonacci one year, and cycle wave V lasted four years.
The lower aqua blue trend line is drawn using a classic technical analysis approach, because an Elliott channel does not fit this data on a log scale. The trend line is drawn from the first two lows within the upwards trend. A parallel copy on the high of super cycle wave (III) gives a nice best fit channel.
I would expect to see grand super cycle wave IV to initially find support at this lower trend line, before breaking thorough this trend line to end below it.
If grand super cycle wave IV ends within the price territory of the fourth wave of one lesser degree, then it would reach down as low as 612.56 to 271.04. It would be most likely to end close to (a bit above) the end of the fourth wave of one lesser degree, so just above 271.04. This is most typical of fourth waves.
Monthly Bear Wave Count
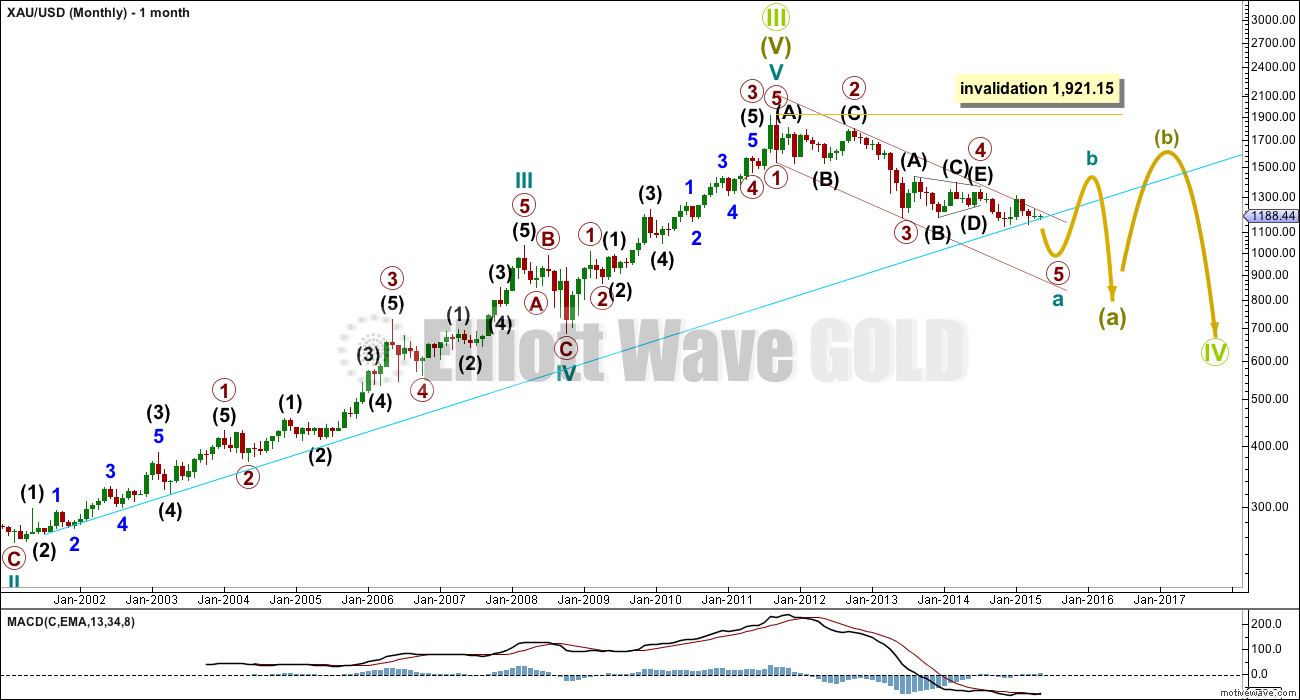
The bigger picture from 1833 looks like price is now within a grand super cycle fourth wave correction.
Within grand super cycle wave IV, super cycle wave (a) is most likely incomplete. I would not label super cycle wave (a) as close to completion because super cycle waves should last decades.
Within super cycle wave (a), only cycle wave a is nearly complete for this bear wave count.
Cycle wave b may not move beyond its start above 1,921.15, because cycle wave a is subdividing as a five wave impulse.
Monthly Bull Wave Count
The bull wave count expects that cycle wave a is complete and cycle wave b upwards has begun.
Cycle wave b may not move beyond its start above 1,921.15, because cycle wave a was a five wave structure.
Cycle wave b should last one to several years and must subdivide as a corrective structure. There are more than thirteen possible structures at this early stage, but is most likely to be a zigzag, triangle or combination.
When cycle wave b is complete, then another five down for cycle wave c may complete a zigzag for super cycle wave (a).
Alternatively, super cycle wave (a) may be unfolding as an impulse: instead of labelling it cycle waves a-b-c it may be relabelled cycle waves 1-2-3-4-5; the subdivisions would be the same. This idea does not diverge for several years yet.
If super cycle wave (a) is a three wave structure, then super cycle wave (b) may make a new price extreme beyond its start above 1,921.15 as in an expanded flat or running triangle.
If super cycle wave (a) subdivides as a five wave structure, then super cycle wave (b) may not make a new price extreme beyond its start above 1,921.15
This analysis is published about 09:22 p.m. EST.


Lara: Thanks for the update on Grand SuperCycle..
1) What will happen if in near future a reserve currency with gold stand emerges with a fixed price of gold? IMF is already contemplating SDR currency with some gold in it. This announcement is set for in October.
2) Gold is in corrective wave IV (bear) then why there are two monthly counts bear and Bull?
3) Elliott Wave Principle book pg 178 Analyses long term gold price. Once US abandoned the gold standard in 1971 the free market price rose from $35 to $197. What will the supercycle wave count looks like if only the free market price of gold to be used. All prior gold prices were fixed artificially by authorities.
Any currency that is backed, in part at least, by gold and not the empty promises of “faith in the government” will stand a bettter chance of emerging unscathed in a crisis. This is so if the national economy is given free hand to develop, and not controlled. That is the reason that the Singapore currency has a percentage of gold backing. That is also why China, and now Russia, has been feverishly accumulating gold in the recent past.
The abondonment of the gold standard by USA, and later Britain, has wreaked havoc on their economies. It has been estimated that the US dollar is worth only a tiny fraction of its value, something like 5%, compared to nearly half a century ago. And inflation could not have diminished the value by so much; mathematically the decay ought to be convergent, not exponential. The cause would most likely be the fact that the delinking of the currency with gold paved the way for producing paper money out of thin air with impunity. In Britain’s case, that was the turning point for the demise of the British empire. The pound has dropped by more than half since that event.
That said, rampant government manipulation in greatly suppressing the price of gold in favour of their currencies, a move favoured and staunchly supported by crooked financial institutions, have been able to stifle the gold market so far. To hoodwink the gullible masses, they have a catchphrase for this, calling gold a “barbaric relic”. This panders to the worldview of the millenials who welcome anything new but deem the old as fitting for the grave. It is my hope, for the sake of future generations, that this manipulation can be arrested. Slowly but surely, China has been taking the lead in chipping away at this bastion of power. They have positioned themselves by setting up the ADB as well as lobbying for inclusion of the yuan in the SDR. Determination, persistence and perseverance will bear fruit in the years to come when the move gathers momentum and more countries pitch in. History is rife with such examples of collapse of empires, to wit the Roman empire, and the once mighty Spanish, Portuguese and Dutch regimes.
I will leave it to Lara to expound on your (2) query.
2) The bull vs bear question, drilled down to the present, is whether or not the 5th wave of “a” of “IV” is complete or not. It’s just not clear yet.
Lara. Thank you for spending the time and effort in providing a timely big picture of the price action of gold. This is very useful for putting into prrspective where we were coming from, and facilitates a crystal ball gaze into the future. It provides a beacon illuminating the darkness to enable us to trade with greater confidence. It provides peace of mind to those who go for the long-term, especially those of us who put aside a certain amount of money in physical gold bullion and coins to hedge against the vagaries of fiat currency.
I agree and well said TKL.