Yesterday’s hourly Elliott wave chart expected an impulse down to end and be followed by another second wave correction to find resistance at the upper edge of a channel.
This is what happened, with the exception of a small fourth wave not moving higher first.
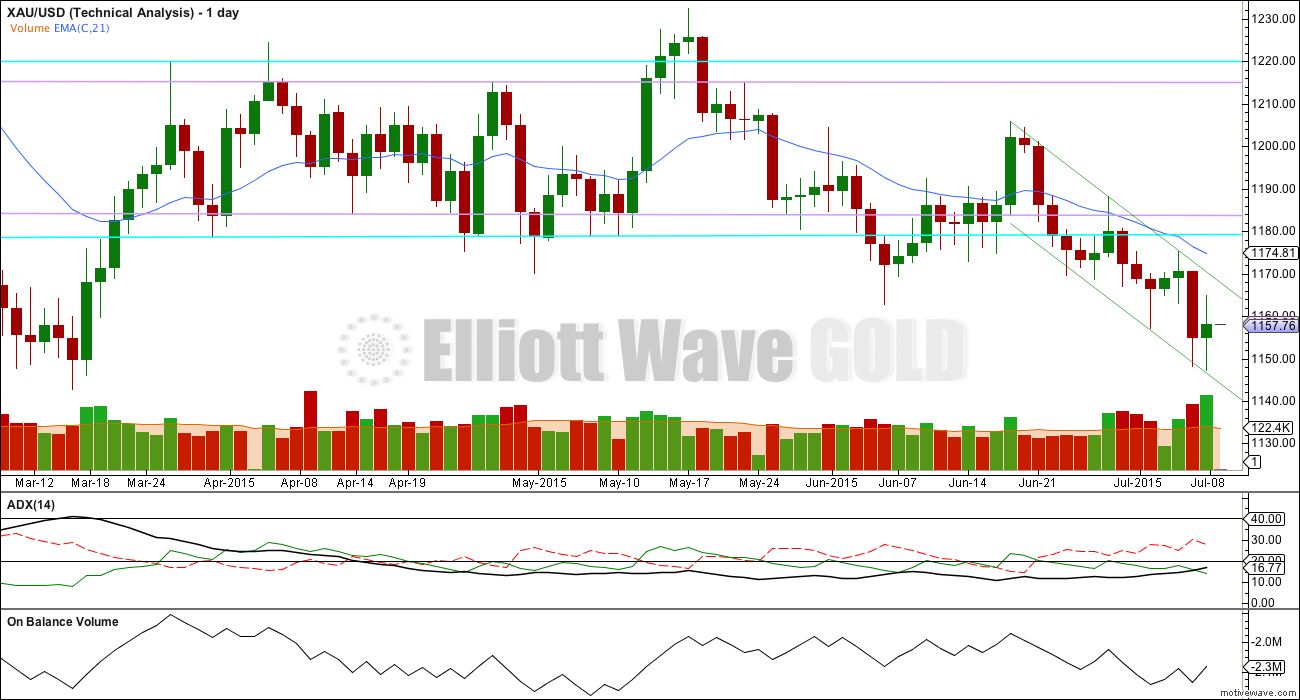
Summary: The middle of a strong third wave may now be ready to break through support lines. The next target for this downwards trend to be interrupted is now at 1,120.
To see weekly charts go here.
Changes to last analysis are bold.
BEAR ELLIOTT WAVE COUNT
The bear wave count expects that cycle wave a is an incomplete impulse.
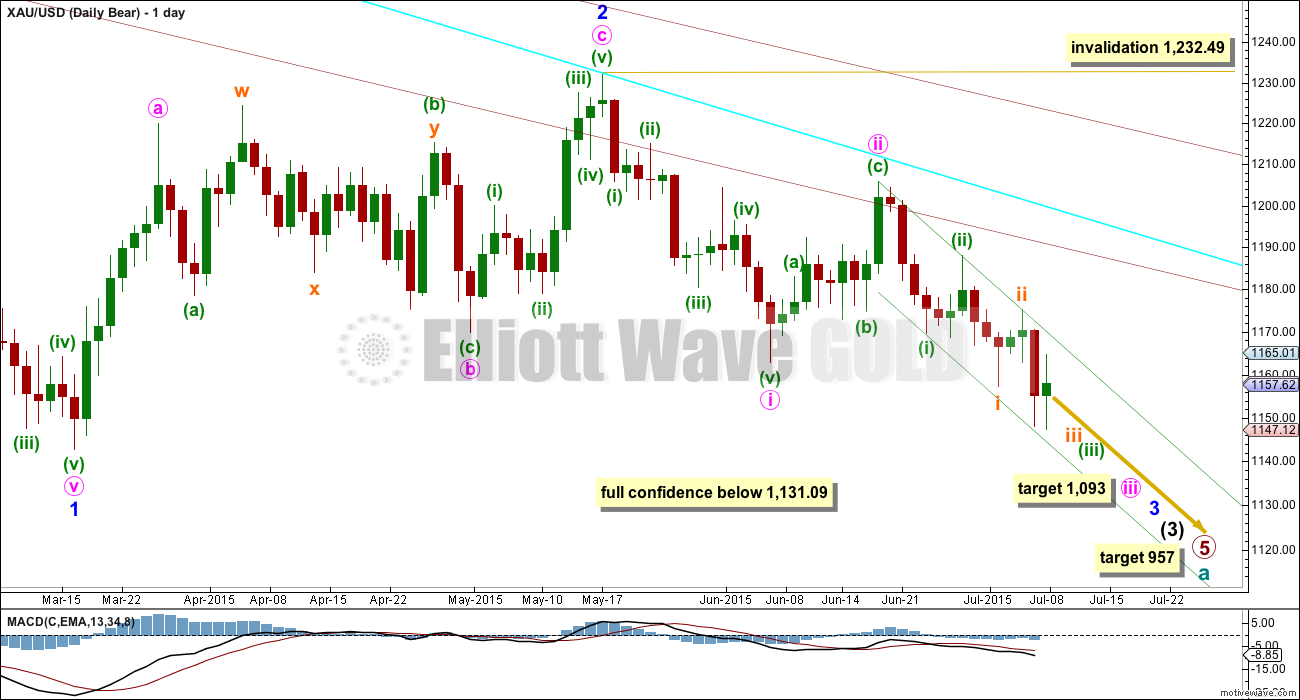
Within primary wave 5, the daily chart focuses on the middle of intermediate wave (3). Intermediate wave (3) has yet to show an increase in downwards momentum beyond that seen for intermediate wave (1).
The bear wave count has increased in probability with a new low below 1,162.80. Full confidence may be had in this wave count with a new low below 1,131.09.
Pros:
1. Intermediate wave (1) (to the left of this chart) subdivides perfectly as a five wave impulse with good Fibonacci ratios in price and time. There is perfect alternation and proportion between minor waves 2 and 4. For this piece of movement, the bear wave count has a much better fit than the bull wave count.
2. Intermediate wave (2) (to the left of this chart) is a very common expanded flat correction. This sees minor wave C an ending expanding diagonal which is more common than a leading expanding diagonal.
3. Minor wave B (to the left of this chart) within the expanded flat subdivides perfectly as a zigzag.
4. Volume at the weekly and daily chart continues to favour the bear wave count. Since price entered the sideways movement on 27th March, it is a downwards week which has strongest volume and the downwards day of 9th April which still has strongest volume.
5. On Balance Volume on the weekly chart breached a trend line from back to December 2013. This is another bearish indicator.
Cons:
1. Intermediate wave (2) (to the left of this chart) looks too big on the weekly chart.
2. Intermediate wave (2) (to the left of this chart) has breached the channel from the weekly chart which contains cycle wave a.
3. Within minor wave 1 down, there is gross disproportion between minute waves iv and ii: minute wave iv is more than 13 times the duration of minute wave i, giving this downwards wave a three wave look.
4. Minor wave 2 is much longer in duration than a minor degree correction within an intermediate impulse normally is for Gold. Normally a minor degree second wave within a third wave should last only about 20 days maximum. This one is 44 days long.
Minor waves 1 and 2 are complete. Minute waves i and ii are also complete. Gold may be ready to move to the strongest middle of intermediate wave (3).
Minute wave ii may not move beyond the start of minute wave i above 1,232.49.
Minute wave ii is now very likely to be over here. If it moves any higher, then it should find strong resistance at the blue trend line.
At 1,093 minute wave iii would reach 1.618 the length of minute wave i. If minute wave iii ends in a total Fibonacci twenty one days, then this target may be reached in another seven days time.
Draw a base channel about minuette waves (i) and (ii) as shown (green trend lines). Look for upwards corrections along the way down to continue to find resistance at the upper edge of that channel. When the strongest part of downwards movement arrives, then it may have the power to break through support at the lower edge of the channel. For now this channel is perfectly showing where price is finding support and resistance.
HOURLY BEAR ELLIOTT WAVE COUNT
This hourly chart, and the alternate hourly below, work in exactly the same way for the bull wave count. The only difference for the bull wave count is the degree of labelling would be one degree lower.
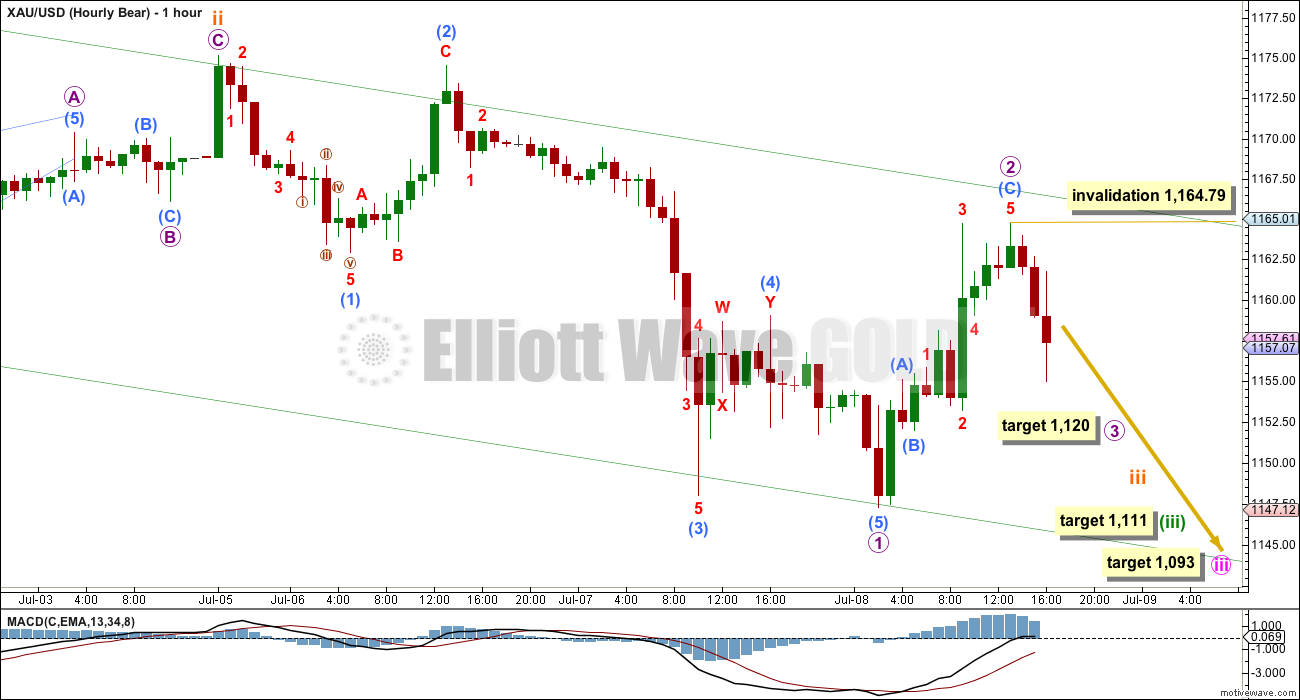
Micro wave 1 finished with a slight new low for submicro wave (5). Submicro wave (5) is just 0.48 short of equality in length with submicro wave (1).
I have spent some time today on the five minute chart to see how submicro waves (4) and (5) subdivide. I am not certain exactly how submicro wave (4) subdivides nor exactly where it ends, but at this stage I think it is more important to see if micro wave 2 subdivides as a completed three or not, so any more time spent to see how submicro waves (4) and (5) subdivide is not necessary (there are multiple possibilities, all which meet Elliott wave rules).
At the five minute and hourly chart level, micro wave 2 fits perfectly as a completed three. With downwards movement now back in submicro wave (A) territory, this cannot be a five up continuing as a fourth wave would be in first wave price territory. Downwards movement is now deep enough to confirm that micro wave 2 is a completed three wave structure, and should be over there as a deep zigzag.
At 1,120 micro wave 3 would reach 1.618 the length of micro wave 1. Because micro wave 2 shows on the daily chart as a red candlestick, it should be expected that its counterpart micro wave 4 will also do so. The end of micro wave 3 may be the next place where the downward trend is interrupted by an upwards day.
Micro wave 3 may have the power to break through support at the lower edge of the green base channel.
At 1,111 minuette wave (iii) would reach 2.618 the length of minuette wave (i). If minuette wave (iii) lasts a total Fibonacci thirteen days, then this target would be eight days away.
BULL ELLIOTT WAVE COUNT
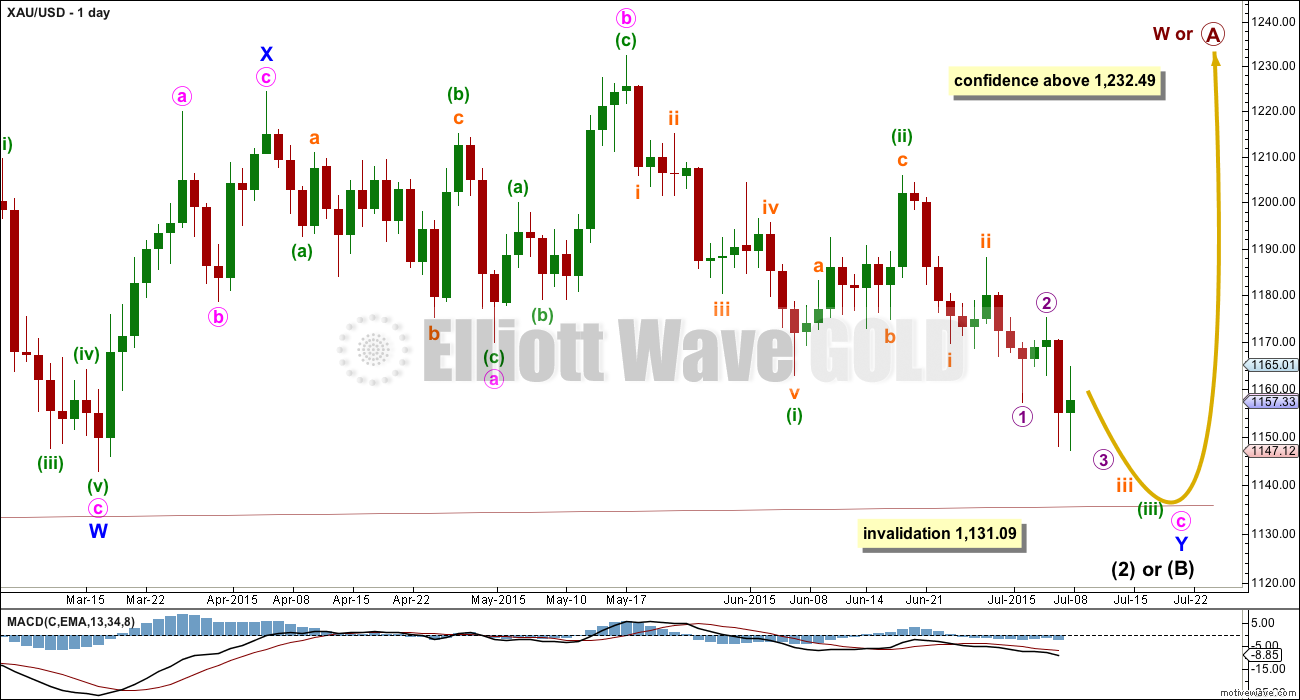
This bull wave count looks at the possibility that cycle wave a is a complete impulse and that cycle wave b began back at 1,131.09. Within cycle wave b, primary wave A is incomplete and subdividing either as a zigzag or an impulse.
Pros:
1. The size of the upwards move labelled here intermediate wave (A) (to the left of this chart) looks right for a new bull trend at the weekly chart level.
2. The downwards wave labelled minor wave W looks best as a three.
3. The small breach of the channel about cycle wave a on the weekly chart would be the first indication that cycle wave a is over and cycle wave b has begun.
Cons:
1. Within intermediate wave (3) of primary wave 5 (to the left of this chart), to see this as a five wave impulse requires either gross disproportion and lack of alternation between minor waves 2 and 4 or a very rare running flat which does not subdivide well. I have tried to see a solution for this movement, and no matter what variation I try it always has a problem which substantially reduces its probability.
2. Intermediate wave (5) of primary wave 5 (to the left of this chart) has a count of seven which means either minor wave 3 or 5 looks like a three on the daily chart.
3. Expanding leading diagonals (of which intermediate wave (A) or (1) is) are are not very common (the contracting variety is more common). There is also now a second expanding leading diagonal for minute wave i.
4. Volume does not support this bull wave count.
5. Intermediate wave (B) or (2) may only be continuing as a double combination. Minor wave X is shallow, and X waves within double combinations are normally very deep. This one looks wrong.
Volume for 8th July shows a strong increase for an up day at 218.9K. It is stronger than all the prior down days since Gold entered the sideways consolidation back on 27th March except for one, that of 9th April at 230.3K.
Intermediate wave (A) (to the left of this chart) subdivides only as a five. I cannot see a solution where this movement subdivides as a three and meets all Elliott wave rules (with the sole exception of a very rare triple zigzag which does not look right). This means that intermediate wave (B) may not move beyond the start of intermediate wave (A) below 1,131.09. That is why 1,131.09 is final confirmation for the bear wave count at the daily and weekly chart level.
The only option now for the bull wave count is to see intermediate wave (B) or (2) continuing sideways as a double combination. The first structure in the double is a zigzag labelled minor wave W. The double is joined by a brief three in the opposite direction labelled minor wave X, a zigzag. The second structure in the combination is an expanded flat labelled minor wave Y which is incomplete.
Within minor wave Y, minute wave b is a 1.15 times the length of minute wave a indicating an expanded flat. Both minute waves a and b are three wave structures.
Minute wave c downwards must subdivide as a five, and because the first wave within it is an impulse and not a zigzag minute wave c may only be unfolding as an impulse.
Within minute wave c downwards, the third wave is incomplete for minuette wave (iii). At the hourly chart level, this bull wave count sees the subdivisions in exactly the same way as the bear (the bull sees everything one degree lower) so the hourly charts are the same. For this reason I will publish only hourly charts for the bear because they work in exactly the same way for the bull.
There does not look to be enough room for minute wave c to complete as a five wave impulse and remain above the invalidation point at 1,131.09. This is now the biggest problem with the bull wave count.
TECHNICAL ANALYSIS
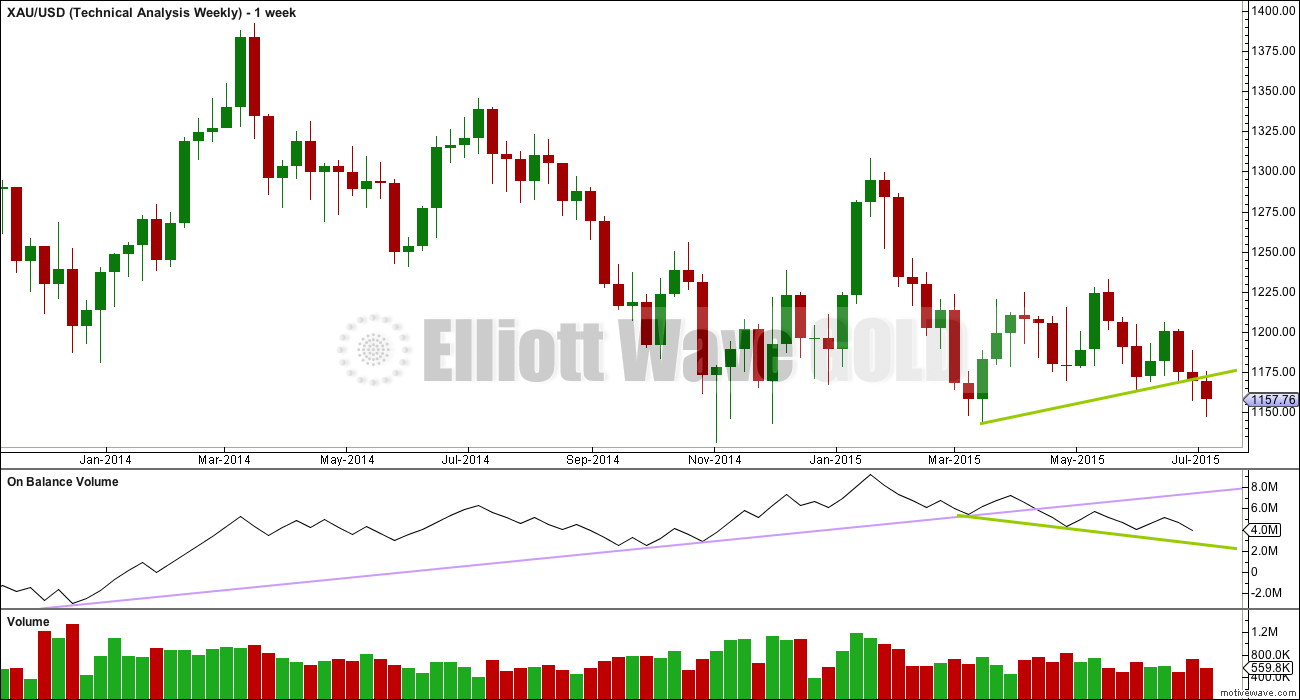
Weekly Chart: Overall volume still favours a downwards breakout which may now be underway. During this sideways movement, it is still one down day and a down week which have higher volume. On Balance Volume breaches a trend line (lilac line) which began in December 2013, and the breach is significant.
While price has made higher lows, On Balance Volume has made lower lows (green trend lines). This small rise in price is not supported by volume, and it is suspicious. Price is now breaking below support at the green trend line, which is another bearish indicator.
At the weekly chart level, volume is strongest in a down week. Overall volume up until last week was declining, typical of a maturing consolidation. Each series of down weeks includes a week with stronger volume than the following series of up weeks.
Daily Chart: ADX is slightly above 15 for Wednesday at 16.77. This may finally be the indication of the early stages of a new downwards trend. Upwards movement is finding resistance just below the upper green trend line, which is now drawn as a channel in the same way as the main wave count.
My only concern for today is the strong volume for an up day. Today’s volume at 218.9K is stronger than all prior down days except for one, that of 9th April which is still the strongest down day at 230.3K. That today’s up day is stronger than more recent down days indicates we may yet see more upwards movement before the downwards trend continues. If price does move higher, then it should still find strong resistance and end at the upper green trend line.
The candlestick for Wednesday, although it is green, still exhibits a reasonable balance between bulls and bears. The upper and lower wicks are long and about even, indicating a balance and indecision, not necessarily the start of a new upwards trend. This fits with the Elliott wave count as seeing this day as a correction against the trend.
The last low in price for 7th July was not matched by On Balance Volume, which did not quite manage to make a new low. This was slight bullish divergence which may be resolved now by Wednesday’s green candlestick.
This analysis is published about 06:04 p.m. EST.

Wave[4] of Major III
http://upic.me/i/9l/2screenshot_1.png
Wave(5)/A : Ending Diagonal
http://upic.me/i/us/1screenshot_1.png
Wave(e) : Triangle
Wave(5) : Zigzag 5-3-5
http://upic.me/i/ct/3screenshot_1.png
Those screenshots are so small… I cannot see the wave count on them. You can upload images directly to this site to share with other members. Click on the “choose file” button right above the comment box.
Your comment was automatically placed in moderation because it had more than two links. Released now.
Matt, I like your alternative.
Looking at GDX options, there are 75,000 put contracts at $18.50 strike or lower. I look at this 2 ways – 1) The writer wants to collect the premium, so look for a rise into the $17.75 to $18.50 range between now and Friday. or 2) The writer WANTS to have 7.5 million shares PUT to them at those strikes, if that’s the case, that is some pretty significant accumulation above current levels.
If we are about to drop into the 3’s, I would assume scenario 1 is what will play out, and that aligns with your diagonal possibility I think.
Alternatively, if gold starts a series of 3-4’s here, these contracts are going to be wildly in the money.
Thanks. Interesting thoughts! Also, something simpler to ponder – on why gold may move back up into the 1180s – could be related to the location of the 50 day moving average and the downtrend line connecting 1232 and 1205.
Hope I’m wrong. This is exhausting. 🙂
I agree, exhausting is right, but still having a blast.
Looking at the GDX/GDXJ charts, I think they both may have completed the (iii) wave or very close, so the gold move you describe would coincide with a wave (iv) for the miner indexes. GDXJ went for the throat with the impulse move down to $13.86 where GDX looks like it may be another structure. ….Or, maybe (iii) isn’t quite done yet.
I believe gold just completed a small 5 down from today’s high, which speaks for Lara’s original count. Let’s see if a tiny ABC correction happens during Asian trading hours. If so, the downtrend could continue in the European or U.S. sessions.
…. with 1159-57 holding, Gold price looks bottomy here just above pivot headed back up to likely test 1165-69 again….. ouch
Yes. Agee
Do t like the looks of this action here
Looks to be a tricky trade at this stage and I would look for sell short signals under 20dma (1176-77) should break above 1168-69 occur…
Lara,
I still have to check the subdivisions on this idea, but could gold have formed a contracting diagonal down from 1205 to the low of 1147? The proportions of the five waves down seem correct and wave 4 moves into wave 1’s territory.
The diagonal would have been preceded by a 1-2 and the diagonal itself would be part of the next 1-2. This implies that gold would be in the process of forming a deep 2nd wave back into the 1180s or higher.
I would much prefer that gold get on with it and drop right now, but its current sluggish movement is making me suspicious.
Ideally gold is now just forming one last tiny 2nd wave to the lower 1160s, before the party gets started.
I’ve checked the wave lengths and trend lines of that idea, and yes, a leading diagonal would fit from the high at 1,205 to the last low.
The trend lines don’t converge very well. And the second and fourth waves shallower than they normally are within diagonals.
It’s possible.
But I still think a series of 1-2, 1-2, 1-2 is more likely. That’s how third waves start when they extend. It’s so common.
I’ve charted that idea Matt and looked at it closely.
It’s not a valid wave count, it violates a rule for a contracting diagonal.
Specifically, the trend lines are very slightly diverging. While the wave lengths all meet the rules for a contracting diagonal, the trend lines do not.
The rule states the trend lines of a contracting diagonal must converge. This one has lines which don’t, so the rule is not met. The wave count is invalid. I cannot publish a wave count which violates an EW rule.
So my conclusion is the only valid wave count now is the overlapping series of 1-2, 1-2, 1-2 waves.
I am actually very glad to hear this! Would prefer that gold keeps moving down.
Think gold just completed a small 5 down, which speaks for your count.
Lara (Oh Wise One)
Gold and the miners are in very oversold status.
It looked like gold may have went above the hourly channel.
Gold invalidated the hourly chart and appears to be in an extended micro 2 movement or a slow to start micro 3.
Gold seems to be on the fence today in a tug of war between the bulls and bears.
Has something changed today or is gold still on track for big drops in the next few days.
Perfect question, Richard.
Thanks Matt.
The only thing that’s changed is micro wave 2 moved higher as a double zigzag. Which I hadn’t expected it to do.
The channel on the daily chart (that’s on a semi log scale) is perfectly touched.
The channel on my hourly chart copied over (is on an arithmetic scale) is slightly overshot. I’m not concerned about that.
I will be considering alternates though, and Matt’s idea of a leading diagonal is a really good one. Thanks Matt!
I’ll check the subdivisions of that one and if it works (it should) it can be an alternate which may explain more upwards movement first above 1,164.79.
I do still think that is less likely.
I still see the more common scenario of a series of overlapping first and second waves. This is how third wave extensions begin, and this is psychologically difficult to rationalise. Many traders see the overlapping and are convinced a big move won’t happen, right before it does.
Thank you Lara. Like I said, I would prefer your suggested scenario. One big red flag to me though is that this last 2nd wave correction far exceeded 0.618. Is that not a problem?
It is slightly a problem, yes. It’s possible, sometimes it happens, but it’s not the normal scenario no.
No rules are violated by this wave count, and with upwards movement finding resistance so far perfectly at the trend channel (daily chart is better to see this) it’s entirely possible.
BTW I replied to your diagonal idea above; it isn’t valid, it violates an EW rule so I won’t publish it. So I’m concluding this wave count here is the only valid one I can see at this stage for this move.
Ben, lots of data on the charts you are posting, but data can be interpreted many different ways.
When you post a chart would you provide a comment on what the chart data means to you?
Sure, in the case of the two below, the ratio charts have hit extremes, today’s action could be pointing to a turn, which is why I am adding to my longs.
Gold:Silver ratio – MACD histo and Stochs- negative divergence, RSI hit 70 and turned down
Gold:GDXJ – Out of BB, now back in and RSI over 70 and turned back down.
I will be looking for a decent close on the miners today. If we don’t get it, maybe we open lower in the morning, but the dip is bought.
Look at any DUST chart right now, negative divergences on the 60min/daily starting to show up.
A VIEW: With upside risk $1180-85 (subject to a break above $1168-69) a trade through $1149-45 would be required and this may take a little longer than expected to drop through $1142/$1130 for objective $112x….dang~! Currently need to see a break below $1159-56…. Oh well, time is of essence, just got to walk the trail….
Added NUGT at 6.83.
Anyone notice good intraday trading opportunity in miners to avoid losses?
I noticed good DUST intraday trading opportunity the last 3 mornings.
Tuesday 9:30 am to 10:32 am 7.6%
Wednesday 9:52 am to 10:42 am 4.7%
Thursday today 9:32 am to 10:36 am 6.5%
Plenty of profits in an hour.
I didn’t trade those but will look for more to trade.
Another ratio I am watching.
Chart I am watching.
Gold went from looking bullish to looking bearish pretty fast .
US dollar turned up at 9:45 am EST
DUST went up 6.5% in 1 hour.
Should of bought a lot at the low just after the open.
ditto! It’s rough getting back on that horse.
Yes and now gold moved up $1.50 and DUST lost half of it’s gains since low after open. These 3 X ETF’s react fast and furious. Prosperous trading everyone.
Lara, price appears to be honoring upper trend li ne. Do you have any upper price target beyond this? (should’ve guessed, anytime Lara is REALLY bearish the price will do about face– I think they call that Murphey’s law. lol)
If 1,164.79 is breached then the target would be 1,183.33 and the invalidation point would be 1,205.89.
But while price remains below 1,164.79 and is touching the upper trend line on the daily chart (overshot on the hourly, they’re on different scales) a third wave down would be more likely.
I know that second wave corrections test our patience. I didn’t expect this one to continue for so long. Second waves convince us there is no big movement and no trend in the expected direction, and they do it right before a third wave takes off.
This scenario of overlapping first and second waves is still the most common scenario and so will still be the main wave count.
I think you meant to say “if 1167.84 is breached.”
Could be wrong but I sense a lot resistance here at the upper trend line, looks like nothing but downhill from here! Loading up on JDST!
This really does not seem to have the characteristics of a wave 3…
Nope
Silver making a nice move. Added some JNUG in premarket, stop at yesterday’s low.
JNUG held the fib retrace, moving stops up to today’s low.
Lara, the wave ‘2’ of the this potential 3rd wave have ALL been VERY sting, is this typical?
Yes. Go back on the daily chart to the high in October 2012 at 1,796. That was the end of primary wave 2 and the start of primary wave 3.
Look at the overlapping right up to April 2013. Now look at my daily chart for Gold here. A big move was expected, those targets were pretty low. The reason why I expected it to happen was momentum. A third wave should be really strong, stronger than a first wave. At that stage it was slightly stronger, but not enough.
We have a similar situation again. This third wave must increase momentum beyond that seen for the first wave. It hasn’t so far. So the strongest downwards move is ahead of us, if the bear count is correct.
We will have corrections along the way down, and I may not get them all exactly right. But the overall trend is down: ADX still is indicating a downward trend today. Volume for today is slightly lower, indicating that this upwards move is not being supported by volume. Look at the long upper wick on today’s candlestick, and the long wicks on yesterdays candlestick. They both look quite corrective.
Potential GDXJ target of approx 15 could mean over 20 for JDST.
http://www.tischendorf.com/2015/07/08/gdxj-gdx-gold-mining-stocks-downtrend-high-odds-technical-set-up-for-vicious-sell-off/
Lara, with the hourly bear count invalidation point reached, would you now see micro wave 2 as likely being over at the recent high of 1166.6, or is there now more serious doubt in immediate downward movement?
hi Lara, can primary wave 5 be an ending structure..5-3-5-3-5?
If yes, then is there a possibility that Gold has completed 5-3-5- and a Flat correction is going on at present in the form of next 3?
Yes, but if that’s how it subdivides then it must meet the rules for an impulse. Specifically, that 4 does not enter price territory of 1 and that 3 is not the shortest.
If you have the idea on a chart that would be so much easier to answer the question.
Bear Hrly Invalidation point reached, but per 7-7-15 analysis regarding the micro 2 correction:
“When a final fifth wave down completes an impulse for micro wave 1, then the following correction for micro wave 2 may not move beyond its start above 1,175.18.” So we’re still good, right?
On 5-min. this upmove to 7/8 23:25 pm looks impulsive.
Are we still good with more down moves to come?
Tham//anybody awake?
Looks like micro 2 continued. The high at 1164.79 could be the end of submicro A, then looks like submicro B is a triangle, and now we are in submicro C. We are likely in wave 4 of submicro C, so if this is correct, we just need a slight new high above the most recent high at 1165.70 to complete micro 2, then down we go. Let’s hope this is correct! We should know in the next few hours. And yes, you are correct that the invalidation point is now up at 1175.18.
This is wonderful news. Thank you.
Figured we were in submicro C. Waited so long to trade this down trend don’t want anything to blow up the pathway.
Now I’m off to bed.
Great questions you have put to Lara by the way on Danerics wave counts.
The hourly bear was invalidated when gold moved above 1164.79 and up to 1166.68 at 2:08 am as per pmbull.com
Now the invalidation point moves up to 1175.18.
Not the way I like ti see a wave 3 kick off
Tham is on vacation
Hi. Just managed to come on for a while.
Yes, Dreamer is spot on. For the bear count, the 3-wave structure issue is resolved. There is now a beautiful 3-wave structure for micro 2. Yesterday’s high of 1164.79, a 5-wave structure, is submicro A and not micro 2 in its entirety. After a brief submicro B, a 3-wave structure, price moved up in submicro C to 1167.84 which most likely ended micro 2 since there is a 5-wave structure.
The moment to short has most likely finally come. Good luck to you all guys.
Tham thanks for the wave count and bearish confirmation.
If this count is correct, the downside targets are:
Micro 3 = 1133 (This gives a beautiful $35 drop)
Subminuette 3 = 1125
Minuette 3 = 1111
Minute 3 = 1093
Also, the bull is almost out of the woods now. Minute C being > 1131.09 is achievable. It doesn’t matter for the near term as both counts call for a downwards movement.
I will come on again if there is deviation from this outlook.
Lara, are you in contact with Daneric? His current count is similar to your bull count, but he sees the possibility of a lower low as he sees the up move from the 1131 Nov 14′ low as a 3, suggesting that a flat/expanded flat may be in progress at the intermediate level. Any way that you could reconcile with him as to how he counts it as a 3 vs. 5 to see if he has a valid option? Thanks, Bob
http://danericselliottwaves.blogspot.com/2015/07/elliott-wave-update-8-july-2015.html
I can’t see the subdivisions for how he sees that A wave.
So I don’t know how he’s reconciled that. And I’m not in regular communication with him to be able to know how he’s counted that.
I’ve been over that piece of movement with a fine toothed comb, if you will. And I’ve concluded it’s a five. I can’t see it as a three meeting all EW rules.