Yesterday two scenarios were presented on the hourly charts for the short term. The second less likely scenario has played out.
Both Elliott wave counts expect the same direction next.
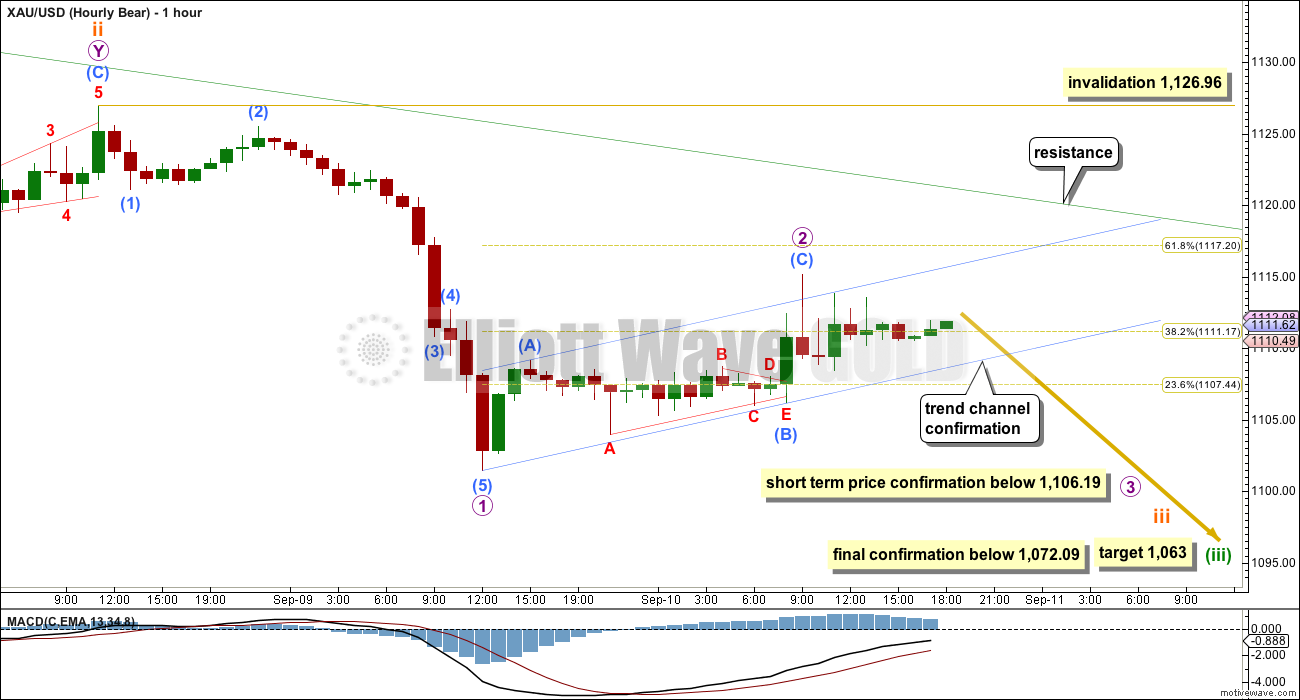
Summary: Both wave counts will expect downwards movement to resume. In the short term, use a small channel on the hourly chart to provide trend channel confirmation that the correction is over and the next wave down has begun. A new low below 1,106.19 would provide price confirmation. Targets remain the same; for the bull 1,096 is where downwards movement is expected to end, but the bear target is at 1,063. Expect any surprises to be to the downside. The bear is very bearish indeed.
Changes to last analysis are bold.
To see weekly charts and the three different options for cycle wave b (bull wave count) click here.
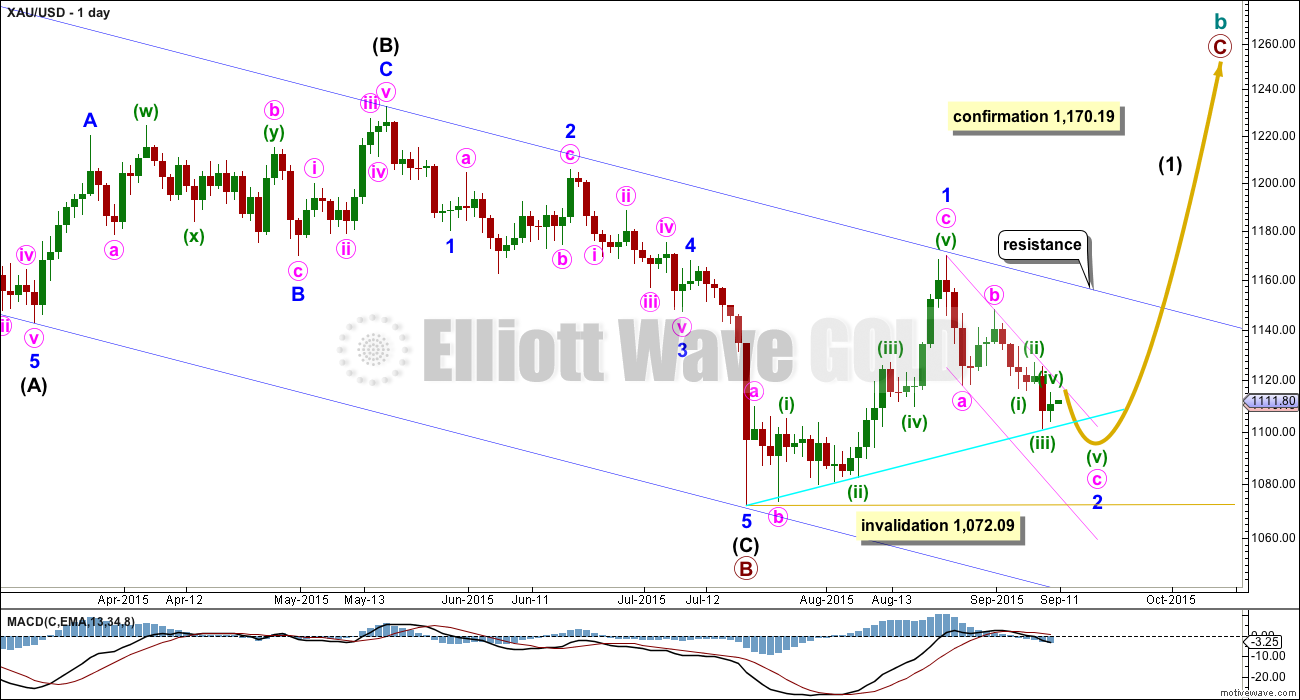
BULL WAVE COUNT – DAILY
The bigger picture at super cycle degree is still bearish. A large zigzag is unfolding downwards. Along the way down, within the zigzag, cycle wave b must unfold as a corrective structure.
At this stage, there are three possible structures for cycle wave b: an expanded flat, a running triangle, or a combination.
This daily chart works for all three ideas at the weekly chart level.
For all three ideas, a five up should unfold at the daily chart level. This is so far incomplete. With the first wave up being a complete zigzag the only structure left now for intermediate wave (1) would be a leading diagonal. While leading diagonals are not rare they are not very common either. This reduces the probability of this bull wave count now to about even with the bear wave count.
A leading diagonal requires the second and fourth waves to subdivide as zigzags. The first, third and fifth waves are most commonly zigzags, the but sometimes may appear to be impulses. So far minor wave 1 fits well as a zigzag.
Minor wave 2 may not move beyond the start of minor wave 1 below 1,072.09. If this invalidation point is breached, then it would be very difficult to see how primary wave B could continue yet lower. It would still be technically possible that primary wave B could be continuing as a double zigzag, but it is already 1.88 times the length of primary wave A (longer than the maximum common length of 1.38 times), so if it were to continue to be even deeper, then that idea has a very low probability. If 1,072.09 is breached, then I may cease to publish any bullish wave count because it would be fairly clear that Gold would be in a bear market for cycle wave a to complete.
To the upside, a new high above 1,170.19 would invalidate the bear wave count below and provide strong confirmation for this bull wave count.
Upwards movement is finding resistance at the upper edge of the blue channel and may continue to do so. Use that trend line for resistance, and if it is breached, then expect a throwback to find support there.
In the short term, use the smaller pink channel drawn about the zigzag of minor wave 2 using Elliott’s technique for a correction as shown. Copy this channel over to the hourly chart. This channel is also drawn in the same way for the bear wave count, and there it is correctly termed a base channel. Both wave counts should expect upwards corrections for the short term to find resistance at the upper edge of this smaller channel.
I added a bright aqua blue trend line to this chart to be the same as the trend line on the technical analysis chart. Price has found support there and is bouncing up. I expect this trend line to be breached, and if that happens, then look for a throwback to it. Throwbacks to trend lines can provide perfect entry points when you are confident of the trend, and they also provide some confirmation of an expected trend.
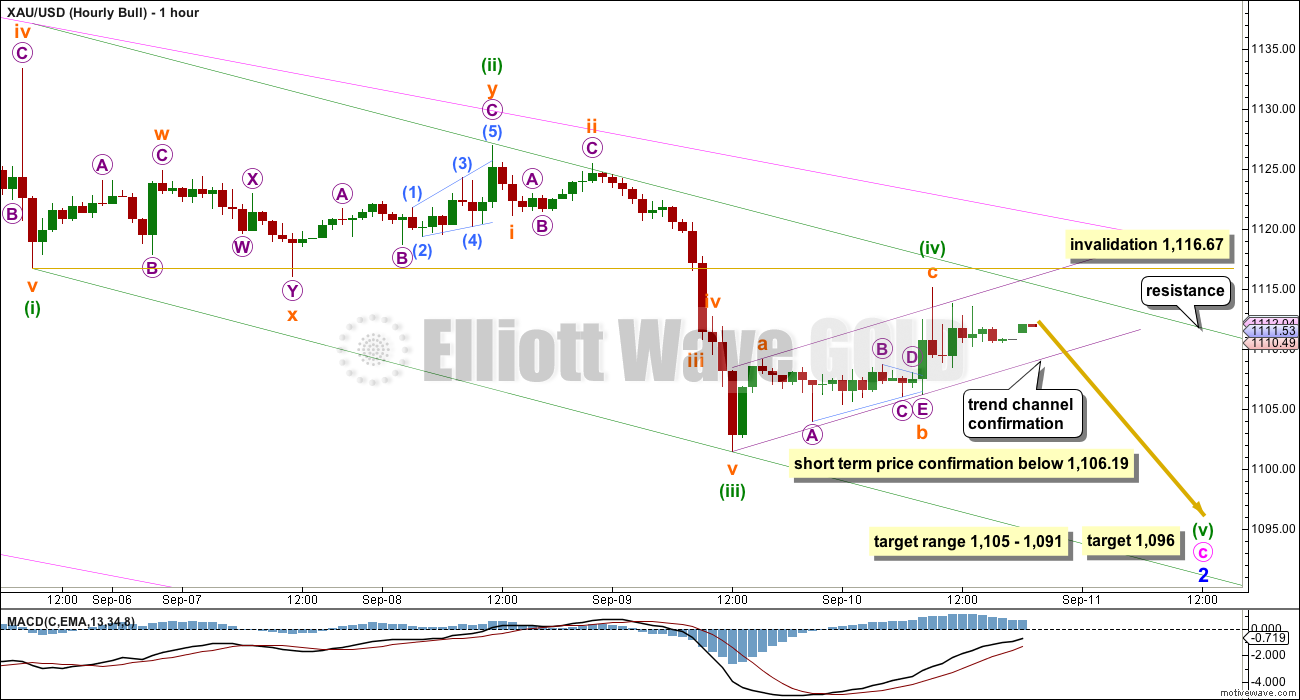
Today subdivisions at the hourly chart level will be exactly the same, with the exception of the degree of labelling. Minute wave c is subdividing as a five wave impulse. I am moving the degree of labelling within this last wave down up one degree for the bull wave count; this would be most likely minuette wave (iv). Only a final fifth wave down may be required to complete the five wave impulse of minute wave c.
Minuette wave (iv), if it continues, may not move into minuette wave (i) price territory above 1,116.67.
There is little alternation in structure: minuette wave (ii) was a double zigzag and here minuette wave (iv) fits as a single zigzag. There is some alternation in depth: minuette wave (ii) was a shallow 0.328 correction and minuette wave (iv) was a deeper 0.538 correction.
Draw a channel about this downwards movement using Elliott’s first technique. Draw the first trend line from the lows labelled minuette waves (i) and (iii), then place a parallel copy on the high labelled minuette wave (ii). Minuette wave (iv) so far is contained within this channel. For this bull wave count minuette wave (v) may end midway within the channel.
Minuette wave (iii) is shorter than minuette wave (i). Because a third wave may never be the shortest, this limits the fifth wave to no longer than equality with the third. This limit is at 1,090.
There is no Fibonacci ratio between minuette waves (i) and (iii). At 1,096 minuette wave (v) would reach 0.618 the length of minuette wave (i). This target is now calculated at two wave degrees, so it has a higher probability for this wave count.
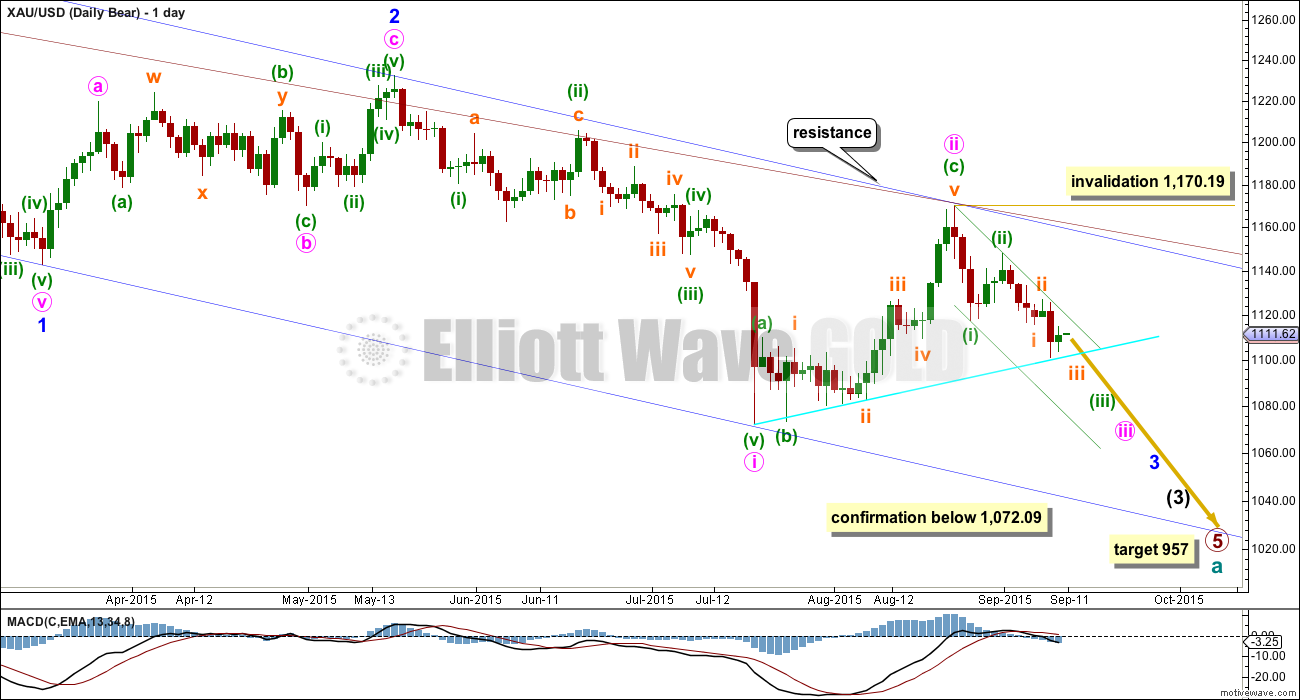
BEAR ELLIOTT WAVE COUNT
At this stage, the reduction of probability for the bull wave count sees this bear wave count about even now in probability.
This wave count now sees a series of six overlapping first and second waves: intermediate waves (1) and (2), minor waves 1 and 2, minute waves i and ii, minuette waves (i) and (ii), subminuette waves i and ii, and now micro waves 1 and 2 (on the hourly chart). Minute wave iii should show a strong increase in downwards momentum beyond that seen for minute wave i. If price moves higher, then it should find very strong resistance at the blue trend line. If that line is breached, then a bear wave count should be discarded.
The blue channel is drawn in the same way on both wave counts. The upper edge will be critical. Here the blue channel is a base channel drawn about minor waves 1 and 2. A lower degree second wave correction for minute wave ii should not breach a base channel drawn about a first and second wave one or more degrees higher. If this blue line is breached by one full daily candlestick above it and not touching it, then this wave count will substantially reduce in probability.
Minuette wave (ii), if it were to continue, may not move beyond the start of minuette wave (i) above 1,170.19. A breach of that price point should see this wave count discarded as it would also now necessitate a clear breach of the blue channel and the maroon channel from the weekly chart.
Full and final confirmation of this wave count would come with a new low below 1,072.09.
If primary wave 5 reaches equality with primary wave 1, then it would end at 957. With three big overlapping first and second waves, now this target may not be low enough.
The subdivisions here are the same because 1-2-3-4 subdivides 5-3-5-3, as does 1-2, 1-2.
Use the channel and confirmation price point at 1,106.19 in the same way.
There are now potentially six overlapping first and second waves for this bear wave count. This indicates a strong increase in downwards momentum ahead. Within Gold’s third waves, the strongest piece of movement is very commonly seen in the fifth wave, which is typical of commodities. When price moves towards subminuette wave v downwards movement may be explosive. If targets are wrong, then they may be too low. Expect any surprises to be to the downside and a price shock may even be seen when the fifth wave arrives.
While there is zero confirmation that micro wave 2 is over the invalidation point for the bear wave count must remain at 1,126.96. Micro wave 2 could yet move higher as a double zigzag and may not move beyond the start of micro wave 1.
If price reaches up higher, then it should find strong resistance at the upper edge of the green channel which is copied over from the daily chart. A lower degree second wave correction should not breach a base channel drawn about a first and second wave one or more degrees higher.
The target for minuette wave (iii) remains the same at 1,063 where it would reach 1.618 the length of minuette wave (i).
Confirmation at the daily chart level that Gold remains within a bear market would come with a new low below 1,072.09.
TECHNICAL ANALYSIS
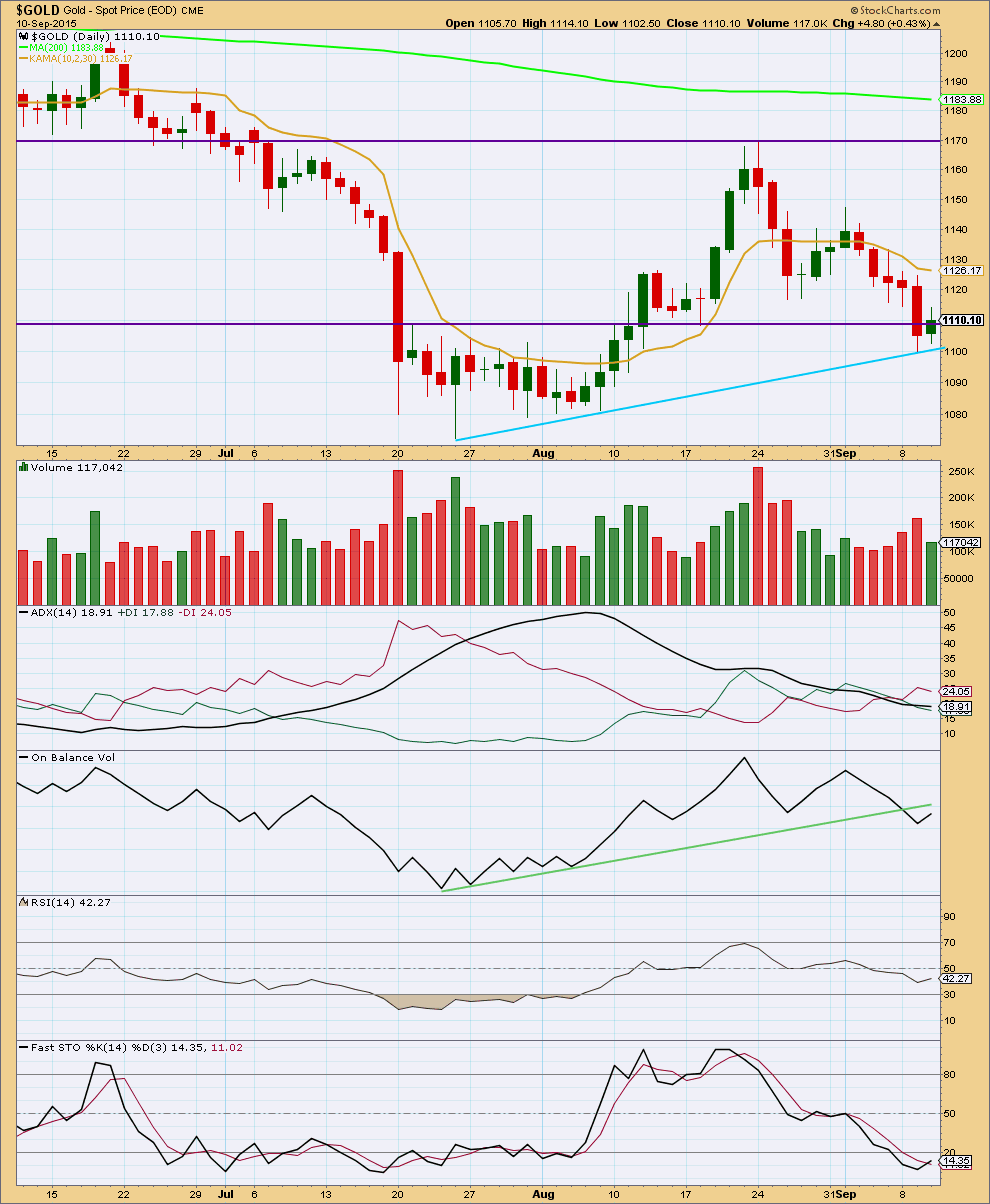
Click chart to enlarge. Chart courtesy of StockCharts.com.
Yesterday’s volume spike disappeared, but volume still increased for a down day. Price fell on rising volume for four days in a row. The fall in price was supported by volume. This supports both Elliott wave counts which expect more downwards movement.
Volume for today is light for an up day. A small green body with reasonably equal upper and lower shadows for an inside day overall looks corrective, and that view is supported by low volume. The small rise in price was not supported by volume.
ADX is still indicating no clear trend at this time. ADX does tend to be a lagging indicator. If the black ADX line turns up in the next day or two, then a downwards trend would be indicated.
On Balance Volume remains below its green trend line, which remains a bearish indicator. If OBV moves higher, then it may find resistance at that trend line. If that happens, then it may indicate when price should stop moving higher.
Stochastics remains oversold, but if there is a new downwards trend oscillators can remain extreme for extended periods of time.
Moving averages should be used instead of oscillators in a trending market. I have added Kaufman’s moving average, which is designed to be more responsive than an exponential moving average. This may be used in three ways: while price remains below the average expect the trend is down; if price comes up to touch the average, then that may be where price finds resistance; and, stops may be set just above the average (allow for small overshoots) and moved as price continues lower.
Price has found support at the bright aqua blue trend line. If this line is breached, then a throwback may find resistance there. Throwbacks can be really useful in providing an entry point to join a trend.
RSI is neither overbought or oversold. There is plenty of room for the market to move up or down.
This analysis is published about 08:20 p.m. EST.

On Gold daily chart I think gold double bottomed today along with September 4th and will bounce up or it has 1 more down day then bounces up for several days.
Curious people’s thoughts on GDX – I am wondering if we have a possible ending diagonal coming in here that may finish out next Mon.-Wed. This obviously coincides with the bull count. There were a lot of mining stocks with really big bounces today, but GDX stayed below the DTL. Might just be a corrective move also….I will be watching to see how quickly we get overbought on the 60 minute charts.
Lara, maybe you could take a quick glance at GDX before Thursday? I’m wondering if minor 3 might be completing as an ending diagonal in the $12.-$12.50 range.
Gold To Remain Volatile Ahead Of Key Fed Meeting Next Week – Analysts
By Neils Christensen Friday September 11, 2015 15:26
http://www.kitco.com/news/2015-09-11/Gold-To-Remain-Volatile-Ahead-Of-Key-Fed-Meeting-Next-Week-Analysts.html
TUESDAY, SEPT. 15
8:30 am Empire state index Sept.
WEDNESDAY, SEPT. 16
8:30 am Consumer price index Aug.
8:30 am Core CPI Aug.
10 am Home builders’ index Sept.
THURSDAY, SEPT. 17
8:30 am Weekly jobless claims
8:30 am Housing starts Aug.
10 am Philly Fed Sept. 5.3 8.3
2 pm FOMC statement
2:30 pm Janet Yellen press conference
Just a word of warning to everyone – and I am sorry to state the obvious – but expect gold and other markets to behave somewhat erratically next week. By now you should be acutely aware of the fact that next Thursday is the most anticipated central bank meeting of the last decade.
I’m not going to try to guess what will happen, but I can tell you the outcome is still uncertain and will probably cause some major anxiety in the markets all the way up to the decision and thereafter.
While I am a gold bear, this next week is more about defense and observation to me. The lower volume that Lara mentions may be due to traders slowly exiting to just watch and wait.
I agree, volatility will be the theme next week. I won’t be surprised if gold moves over 1200 or below 1000.
And with the bear wave count expecting a big third wave down, and the bull now expecting a third wave up, both are expecting strong moves.
It’s the direction which is not known at this stage. I’ll still slightly favour the bear, but this end of week analysis will step back and look at weekly charts and weekly technical analysis to look for clues for next weeks direction.
Have a fantastic weekend everyone! May we all come back Monday refreshed and ready for a wild ride.
What’s Been worrying me is that everywhere you look everyone is bearish Gold. that makes me wonder if we’re going to have a big move up. I’m very uneasy shorting at the moment. At least we do have this weekend to have a study. but no one ever be swayed by the news or anything else, just focus on the charts you see in front of you.
I was uneasy staying short too, took it off the table. I don’t know what will happen next week, but there will always be another good set up coming after Thursday.
I know exactly what you mean, I get scared when my view starts to align with the crowd. The crowd is almost always’ wrong!! But as Lara would say, that’s not the same as always.
Lara
Any throwback target such as 1,110 to 1,115?
Is the 3:20 pm gold peak happening now at 1,108 the throw back you mentioned?
If so then it may be an opportunity to buy DUST at low before close.
Unless you are preferring the bull count possibility.
You had mentioned the bear would pass around the 1,196 target.
Being in an increasing momentum series of 3rd wave, would the corrections be short lived and may turnaround down with momentum over the weekend?
Or is an prolonged bear correction or bull up now expected into Monday’s market hours.
Good morning Richard.
The aqua blue line on the daily chart hasn’t yet been breached. So no throwback to that line yet, it needs to be properly breached first.
What may happen at this stage is another test of the pink (bull) green (bear) upper edge of the channel on the daily and hourly charts.
This is the point in time at which the bull and bear now diverge. We’ve expected them to both go down this week and they have, now the bull has a complete 5-3-5 zigzag down. The bear has a series of overlapping first and second waves.
More downwards movement on Monday will increase probability of the bear. If the aqua blue line is breached I’ll expect a throwback.
Any break above the pink / green channel will now increase probability of the bull.
Volume (so far) looks light which is concerning for the bear.
Next week we shall begin to see which wave count is correct. Right now they’re even. *edit: I’d still have to slightly favour the bear.
Thanks Lara. Going into the weekend flat. Great week again, thanks for all of your hard work.
You’re welcome! Stoked to hear you’ve managed to make nice profits this week.
Next week is going to be more difficult.
Thankfully, I haven’t blown my account over the past 2 years, although I have had some volatility. I’ve made quite a few changes recently to the way I trade coming from trading maturity and gaining experience with all of the steps to potentially manage.
Three things I’ve changed in the last 2 months that have made a significant difference:
1) Smaller position sizes – on average, I trade a position size that, with a solid part of an impulse, will profit $300 to $1200. Smaller sizes are also easier to walk away from when they lose also, I have found. Today, my DUST position was 300 shares, closed it in 24 hours for 10%+ or about $1K, then JNUG trade was 1500 shares, closed it in 2 hours for $550. One note – I was considering selling half and letting the rest trail, but it had been such a good week, I wanted to complete it.
2) Taking profits early – I don’t have a hard/fast rule, but I have been thinking about it like this – If I am up 5% or $500 I start taking some profits. There will ALWAYS be another impulse or C-wave to trade.
3) Not staying in or taking a new position if I am uneasy about it. I love all of the EWG/EWSM analysis, my own TA, and others I follow, but if I am not feeling good about it, I am not in the trade.
For the month of September (11 days in) – I am up $17K or 18%. That might be peanuts to some who are members here, but I like the consistency recently and I want to keep repeating that. Going into the weekend, I only have about 15% of my portfolio invested, just 2 medium term positions.
Have a great weekend everyone!
Oil bear who won big in 2014 says prices can still fall further – Sept 11, 2015 9:15 a.m. ET
http://www.marketwatch.com/story/oil-bear-who-won-big-in-2014-says-prices-can-still-fall-further-2015-09-11?mod=MW_story_top_stories
I’ve closed my DUST at $34.50 and JDST at $12.30. I have a small day trade long in JNUG but plan to be flat by EOD. I just don’t see much volume in the miners on the downside break here, maybe it comes next week but I’m not going to risk my profit. It’s been another great trading week, I’m going to enter the weekend on that note.
MTLSD, that is terrific trading and exit strategy.
Great high note to start the weekend.
May I ask how you exited so close to the day high?
Were you counting the waves?
Or did you utilize some technical analysis or a gut feeling?
Was watching miners volume, 15 and 60 min technicals, saw it stall for a bit, and just no follow through on Gold yet. What made me pull the trigger was the drop in the VXX, got the sense the stocks could move up for a bit.
And also, we are so close to the bull/bear decision point, I decided to take my profits and wait for a confirmation.
Closed my JNUG day trade for 6%. I’ll be watching the close here, I may start a DUST position again. Depends on the power or lack there of at the close.
Any wave counts?
Did gold complete a full 5 wave count down at todays’ low of 1,098.81 at 9:50 am?
Any comments? If yes full 5th wave then any retrace target guesses?
Based on my technical analysis set up I would project that $35 at 11:16 am will remain the DUST high for today.
Alan
Do you think gold will throwback to 1110?
Certainly that is the point low risk entry for PM shorts.
About 1,096 Lara at 2:50 in video mentions.
“1096 is .618 and for the bull wave count that target has a good probability.
Even for the bear I would expect price to stall around this price point again before breaking through there.
At 5:30 in video Lara mentions, “IF price does a throw back to that aqua blue trend line that might provide a perfect entry point. That could be a high in place for the bear count for the mid to long term.”
About the 1,105 – 1,091 target range. Lara has in analysis.
“Because a third wave may never be the shortest, this limits the fifth wave to no longer than equality with the third. This limit is at 1,090.
There is no Fibonacci ratio between minuette waves (i) and (iii). At 1,096 minuette wave (v) would reach 0.618 the length of minuette wave (i). This target is now calculated at two wave degrees, so it has a higher probability for this wave count.”
Lara mentions in the video that the lower limit is 1,089.
Thanks Richard.
Bear already has trend channel and price confirmation down below 1106.19
Has Gold price reached the end of the down wave or is there a little more downside to go? What do you think? Thanks
GDX often leads GOLD.
GDX has flirted with the 13.00 support level 6 times since August 5…
most notably 3 times already in Sept and with 2 red candles in the last two days….
pre-market GDX was again down to 13.05….
this is already below the uptrend line from the Aug 26 low of 12.96……
this support (trend line and round number support) needs a strong move up right now with volume to prove the bull case….
a solid break and/or close below 13.0 would be a break of support and likely lead to the 3 of 3 of 3 of 3 of 3 down.
Since each of the 6 tests of 13 was followed by progressively lower bounces odds favour a breakdown…
Entered my first positions JDST(US) and HGD (Canada) yesterday….
BTW…Direxion announced stock splits on 6 ETF’s as follows….
http://www.direxioninvestments.com/press-release/extension-to-for-reverse-share-splits-of-six-leveraged-etfs
That is good analysis. The only thing I’d add is the possibility of a false break. One trade at 12.99 is not conclusive.
Agreed…the low is actually 12.96…we would want to see a strong red candle with a close below 12.9x and with above average volume….pre-market is down to 12.99 now…
Breakdown is looking significant.
http://goldtadise.com/?p=351005
Just wondering what is the next likely direction Gold price is expected to take once downside completes at 1105-1096-1090… ? For now, Gold price needs to break below the inside day L 1102.50….
Gold moved down as expected by EW count. Where is the backtest (throwback) level??
The throwback occurs if, and only if, it is the bear count. For the bull, there will be no throwback. Price will “throw over” the trend line and it’s up, up and away in Minor 3.
Price has already gone below the trend line, and today, I’m waiting with bated breath.
Good morning Tham.
Just curious, are you waiting for confirmation or are you in a trade now?
Good morning, dsprospering.
I’m waiting for confirmation. Once the current drop moves to 1101-1102, there will be a small 4th and a small 5th wave to complete the drop to micro 1 (for the bear) circa 1096-1100 before the backtest to 1100 or so, or where the trend line happens to be at that point in time.
That same point may spell doom for the bear as we see a flying bull take off.
P.S. With my kind of luck, when I say it’s bear, it’s always going to be the bull. So I refrain from making pronouncements.
Alan I thought the trend line was at about 1110 for trend line confirmation breach and then throw back up to and not your back test to 1100? Or maybe your talking of different line than Lara’s throwback line?
Apologies. Typo. It is 1110, most likely higher; the trendline is rising with time.
Morning Tham, Do you expect a bounce off 1096 for both bull and bear counts?
Thanks,
Rob
Robert. That is what I would have thought. The bounce could occur slightly lower though. The downward momentum is quite strong.
This may pressure gold down today?
Oil drops as Saudi Arabia says it won’t back OPEC meeting
Sept 11, 2015 3:47 a.m. ET
http://www.marketwatch.com/story/oil-pulls-back-after-conflicting-supply-signals-2015-09-11
Looking forward to a gold movement soon. Not much to watch lately.
We have just noticed some members comments in the trash. I’ll leave them there because I don’t want to assume you didn’t choose to delete them. But I need to ask, is anyone noticing their comments randomly disappearing?
My comment appears to have posted.