Upwards movement was expected for the last week but did not happen. Price has moved sideways, in a decreasing range, to continue a B wave triangle.
Summary: When the triangle is complete a short wave up should unfold to complete this second wave correction. The target for it to end is at 50.87 – 51.40.
Changes and additions to last analysis are bold.
MONTHLY ELLIOTT WAVE COUNT
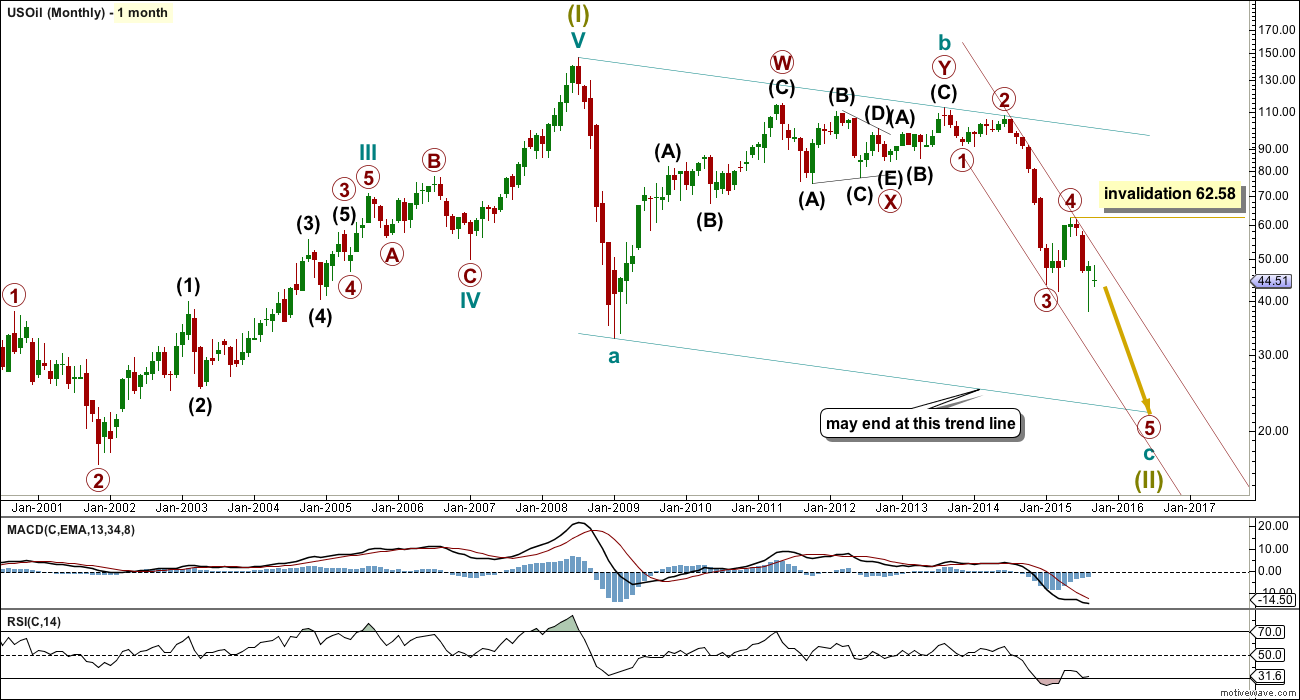
US Oil has been in a bear market since August 2013. While price remains below the upper edge of the maroon channel drawn here and below the 200 day simple moving average it must be accepted that the bear market most likely remains intact. I will not publish a bull wave count while this is the case and while there is no technical confirmation of a trend change from bear to bull.
The structure of cycle wave c is incomplete.
This wave count sees US Oil as within a big super cycle wave (II) zigzag. Cycle wave c is highly likely to move at least slightly below the end of cycle wave a at 32.70 to avoid a truncation. Cycle wave c may end when price touches the lower edge of the big teal channel about this zigzag.
Within cycle wave c, primary wave 5 is expected to be extended which is common for commodities.
Within primary wave 5, no second wave correction may move beyond its start above 62.58.
Draw a channel about this unfolding impulse downwards. Draw the first trend line from the highs labelled primary waves 2 and 4 then place a parallel copy on the end of primary wave 3. Next push up the upper trend line slightly to contain all of primary waves 3 and 4. Copy this channel over to the daily chart. The upper edge should provide resistance.
DAILY ELLIOTT WAVE COUNT
My analysis today for US Oil expects a little upwards movement from here. This does not mean that Gold must also move up. Gold and US Oil do not always move together. As an excellent recent example, note the movement on both markets from 7th August to 24th August: during that time Gold moved higher from 1,083 to 1,170 while US Oil moved lower from 45.14 to 37.75.
These markets have different wave counts and quite simply do not always move in the same direction at the same time. One should not be used to determine the direction of the other.
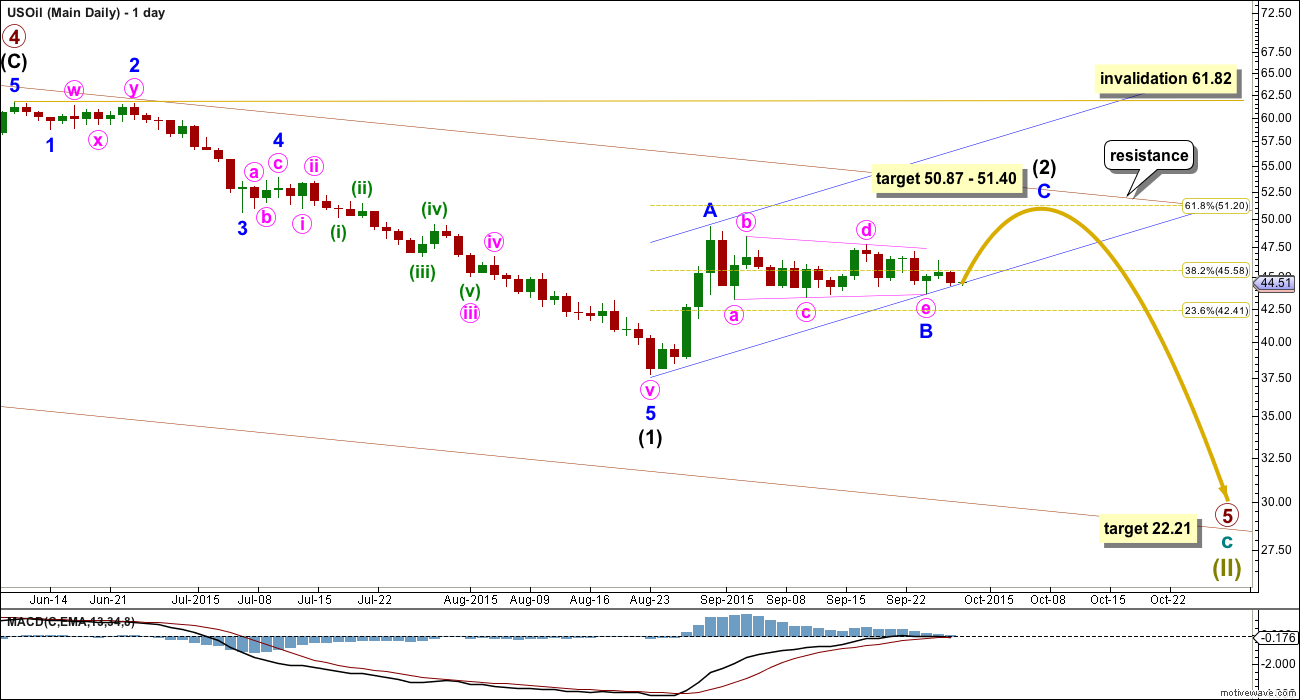
The intermediate degree corrections were brief and shallow within primary wave 3 down. Now, within primary wave 5, this correction for intermediate wave (2) is neither brief nor shallow.
Minor wave B was not over as expected. The triangle has continued sideways. If it is over here, then at 50.87 minor wave C would reach 0.618 the length of minor wave A. This is close to the 0.618 Fibonacci ratio of intermediate wave (1) at 51.20.
If intermediate wave (2) exhibits a Fibonacci duration, then it may end in a Fibonacci 55 days total, which would see it continue now for another 11 days. That would see intermediate wave (2) close to equal with the duration of intermediate wave (1) which lasted 53 days.
Intermediate wave (2) is likely to find resistance at the upper edge of the maroon channel copied over from the monthly chart.
At 22.21 primary wave 5 would reach 0.618 the length of primary wave 3.
Intermediate wave (2) may not move beyond the start of intermediate wave (1) above 61.82.
Draw a channel about intermediate wave (2) using Elliott’s technique for a correction: draw the first trend line from the start of minor wave A to the end of minor wave B, then place a parallel copy on the end of minor wave A. Minor wave c may end midway within the channel. When the channel is clearly breached by subsequent downwards movement it shall provide trend channel confirmation that intermediate wave (2) may be over and intermediate wave (3) may have begun. If minor wave B continues further sideways, redraw the channel.
Once intermediate wave (2) is over, if price turns down as expected, then look for some support initially about the lower edge of the blue channel. If price breaks below support there, then look for a throwback to that trend line. If a throwback to the line ends at resistance, at the line, then the trend line strength is reinforced. When price behaves like that it provides a perfect opportunity to join a trend.
TECHNICAL ANALYSIS

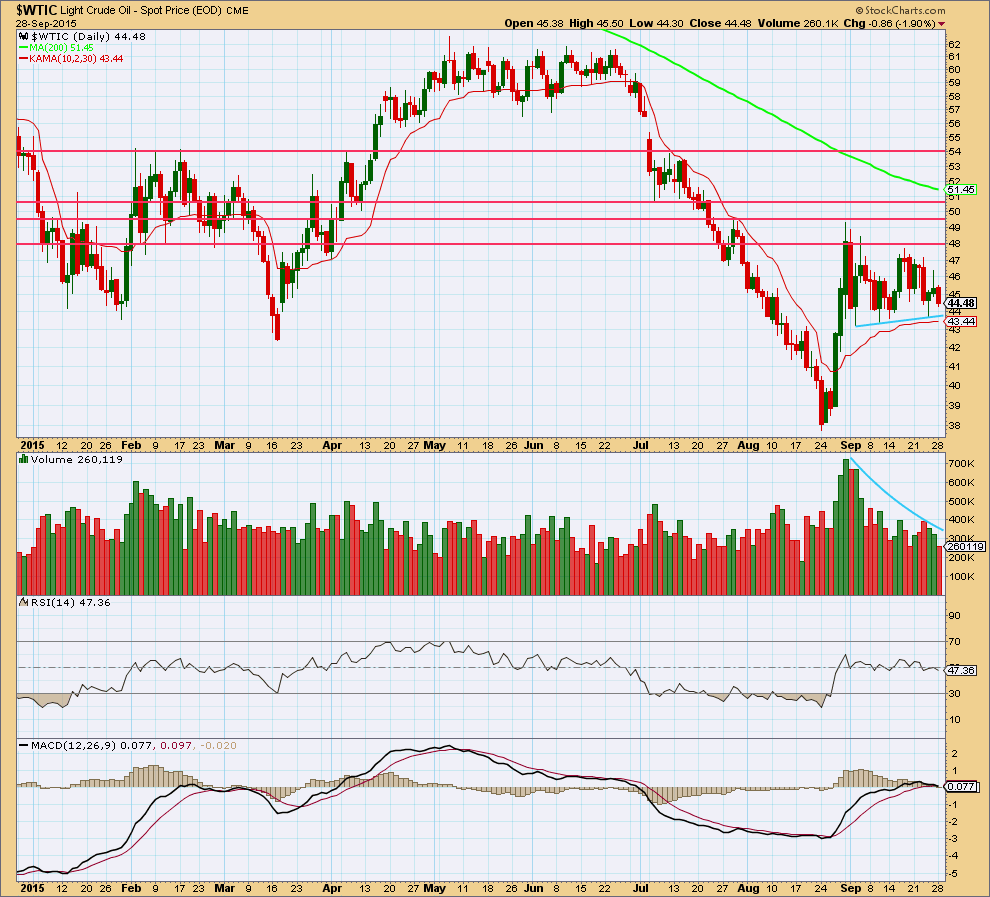
Click chart to enlarge. Chart courtesy of StockCharts.com.
For the last 19 days, as price drifts sideways volume declines. Volume supports the idea that this sideways movement is a consolidation. During sideways movement it is an upwards day which has strongest volume, which supports the idea that an upwards breakout may be more likely than downwards. This supports the Elliott wave count.
However, it should be noted that for the last big fall for US Oil seen on this chart the market has fallen of its own weight. Although the strongest volume came on upwards days from 24th June to 24th August, the trend was clearly down.
Price is finding resistance about the horizontal trend line which previously provided some support. If price breaks above the first horizontal line of resistance, then it may find resistance at each subsequent line.
A breakout from this triangle would be indicated by a breach of either of the sloping blue trend lines, up or down, coming on a day with an increase in volume.
ADX is declining indicating the market is consolidating. A range bound system should be used for trading, or traders may choose to wait until a clear trend is evident before entering this market.
This analysis is published about 05:02 a.m. EST.


WTIC is going to be a reversal Red candle???? oil may breakout to down side below the blue support line ????
US Oil break out is imminent. Impulse wave C in play since wave B completed.
Lara: Is wave B correction over?
US Oil Chart only.
Lara, thanks for the update. I normally only trade the miners, but am going to try trading oil also since you are doing weekly analysis. With your next update, can you please add ADX to your stockcharts chart?
Yes, will do.
Lara: I have been paying attention to your TA specially for ADX black line. Can you write more about how to use it in trading and holding position long/short?
I have a draft post, unfinished, about ADX.
I’ll get that finished and publish it. Yes, that would be most useful.
Thanks Lara anxiously waiting for your post on ADX.
On Stockchart sit in Chart School there is extensive description of ADX and how to use it.
You may want to check it out.
http://stockcharts.com/school/doku.php?id=chart_school:technical_indicators:average_directional_index_adx
Thanks Lara for the US oil Wave count report.
Wave C may complete at apex of triangle or may go upto 11 days +/- few days.