I have only one bullish Elliott wave count for the USD Index.
New updates to this analysis are in bold.
The US Dollar has been in a bull market since July 2011. So far there is no confirmation of a trend change. The bull market should be assumed to remain intact until proven otherwise.
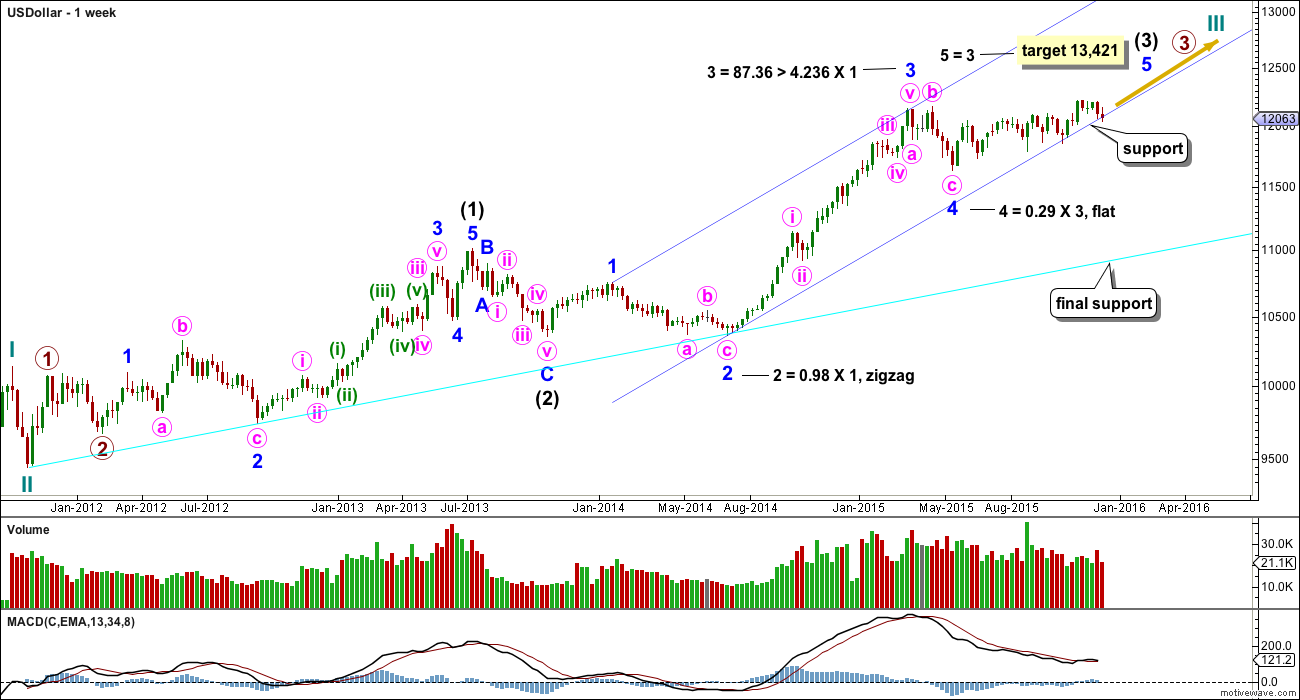
Ratios within intermediate wave (1) are: minor wave 3 is 24.98 longer than 2.618 the length of minor wave 1, and minor wave 5 has no Fibonacci ratio to either of minor waves 3 or 1.
Within minor wave 3, there are no Fibonacci ratios between minute waves i, iii and v.
Ratios within minute wave iii are: minuette wave (iii) has no Fibonacci ratio to minuette wave (i), and minuette wave (v) is 8.46 short of 0.382 the length of minuette wave (iii).
Within intermediate wave (3), minor wave 3 is 87.36 longer than 4.236 the length of minor wave 1.
Minor wave 3, within intermediate wave (3), shows strongest upwards momentum. MACD supports the Elliott wave count.
Within intermediate wave (3), minor wave 2 was a very deep 0.98 zigzag. Minor wave 4 is a shallow flat correction. There is perfect alternation between these two corrections which increases the probability of this wave count.
Draw a channel about intermediate wave (3) using Elliott’s first technique: draw the first trend line from the highs labelled minor waves 1 to 3, then place a parallel copy on the low labelled minor wave 2. So far this contains all of intermediate wave (3). The lower edge of this channel is proving useful in showing where downwards movement is finding support.
The US Dollar was in a sideways consolidation since mid March. During this sideways movement it is an upwards week which has strongest volume. This indicates that when the consolidation is complete an upwards breakout is more likely than downwards. So far, at this stage, it looks like price has now broken out of this consolidation upwards as expected.
A final support line is shown in cyan.
Minor wave 4 was a flat correction. Minute wave b is a 105% correction of minute wave a, so this is a regular flat. Minute wave c is longer than normal for a C wave within a regular flat. There is no Fibonacci ratio between minute waves a and c.
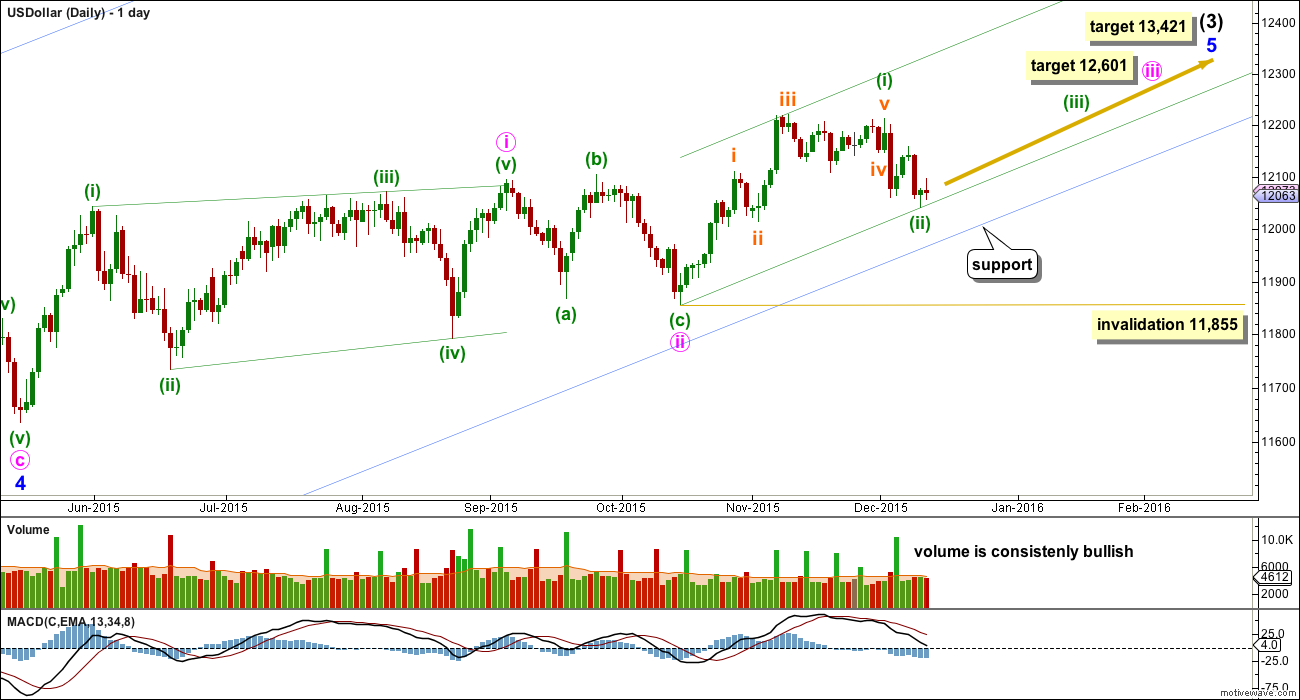
The sideways consolidation turned out to be a leading contracting diagonal for minute wave i. This was followed by a relatively deep 0.52 flat correction for minute wave ii.
At 12,601 minute wave iii would reach 1.618 the length of minute wave i.
At 13,421 minor wave 5 would reach equality in length with minor wave 3.
This wave count expects a long extension for minor wave 5.
Within minute wave iii, the first wave for minuette wave (i) may now be complete, but it has a slightly truncated fifth wave. This slightly reduces the probability of this wave count and indicates caution. Risk management as always is the key to successful trading. This small truncation indicates traders should be careful to manage risk, if using this analysis for trading decisions.
So far minuette wave (ii) may be a complete quick shallow zigzag, at 0.48 the depth of minuette wave (i). If minuette wave (ii) continues any further, it should find strong support at the lower blue trend line copied over from the weekly chart.
The green base channel is drawn about minuette waves (i) and (ii). If minuette wave (ii) moves lower, redraw this channel. Draw the first trend line from the start of minuette wave (i) to the end of minuette wave (ii), then place a parallel copy on the higher price extreme within minuette wave (i) at the end of subminuette wave iii.
If price breaks above the upper edge of this base channel, then a third wave up would be confirmed. Along the way up, downwards corrections should find support at the lower edge of this channel.
TECHNICAL ANALYSIS
At the weekly chart level, the strongest volume during the sideways range from early March to October 2015, was an upwards week. This indicated price should break out upwards. New highs in November are the result.
On 5th November price made a new high on an increase in volume. This was an upwards breakout, supported by volume.
It is consistently upwards days which show strongest volume since that breakout. This supports the trend. The rise in price is supported by volume and is not suspicious.
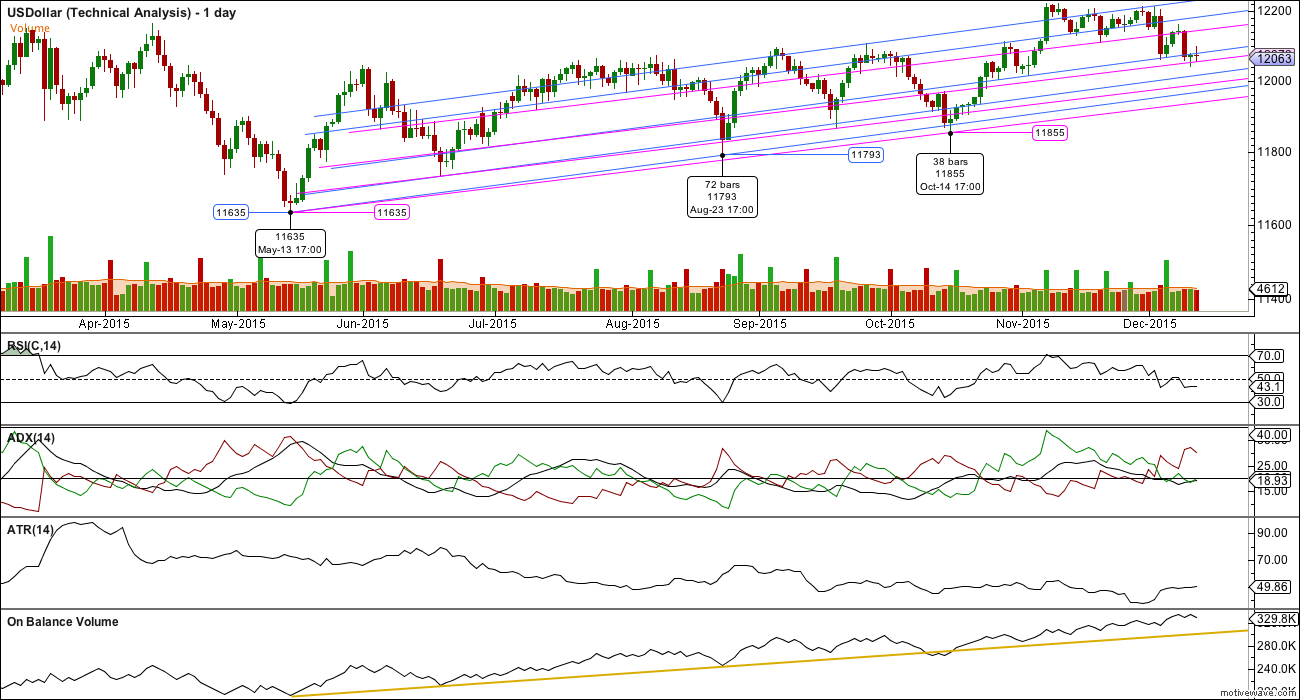
Short term, at the low of 10th December, there is slight divergence with price and RSI. On 10th December price made a new low below the prior short term swing low of 3rd December while RSI did not make a corresponding low. This indicates weakness in downwards movement and is very often accompanied by a trend change. In the short term, some upwards movement should be expected from here. This supports the Elliott wave count which labels this downwards correction as a complete second wave zigzag.
ADX is rising and above 15, the red -DX line is above the green +DX line, so a downwards trend is indicated by ADX. ATR disagrees: it is flat indicating no clear trend at this stage. With these two lagging indicators not in agreement with each other and not with the Elliott wave count, caution is advised. The picture here is unclear and may be resolved if price now moves higher for a few days as RSI indicates it will.
The series of blue and pink trend lines are my own technique which I strongly favour when trading. Along the way up, price may find support and resistance at these series of lines; these may assist to time entry points. The first of each series of trend lines is drawn from the price points labelled and parallel copies are placed higher up at various swing lows and highs.
On Balance Volume is bullish while it remains above the trend line.
Overall, the bullishness of volume, OBV and RSI should be favoured over the lagging indicator of ADX at this time. This indicates overall upwards movement from the USD. There will be corrections along the way up, and the third wave expected to begin does not necessarily have to start out quickly (although it may).


Thanks Laura, at some point (no rush) could you update a review of NZD/USD.
Yes, will do. I think I’ve finally figured out what it’s up to, looks like a fourth wave triangle is unfolding.
Thanks for the update. There is a huge difference in data feeds as we have come to expect and tolerate….
This feed from FreeStockCharts.com shows no truncation, so should support your count and minimize any concern.
The only data I can get for the USD index which I can import into Motive Wave, is via FXCM.
I can’t find it in BarChart, which I’ve just subscribed to.
So this analysis will have to be taken as is. It is offered in support of the Gold analysis, but it’s not good enough on it’s own for trading.
Did you try $DXY? Bar chart shows this on their homepage.
U.S. Dollar Index ($DXY)
I don’t have the symbol $DXY in my BarChart feed, and when I search for DX I just get a bunch of equities.
The problem is the API from BarChart is bringing data across with different symbols into Motive Wave.
I’ve scrolled through and I just can’t find any USD index.
I’ve got Gold and Silver spot prices from COMEX though, so you may be please to know that this week I’ll be moving my wave counts over to this data feed. It should be better than the FXCM feed I’ve been using for Gold.
Wow! That’s big news. Will be great if that clears up some of the concern we’ve had with price discrepancies. I imagine that you will be going back and looking at some of the key points along the bear drop to see if the new data affects your overall count?
Also, what about GDX? Maybe you can get hourly and smaller time frames that will help with your confidence in the EW count? I look forward to that.