Price made a slight new high and then turned lower.
Upwards movement was expected.
Summary: Two wave counts today both expect more upwards movement. In the short term, a third wave up may be beginning. It is reasonably likely that price will reach to 1,275.24. The target is 1,281. Upwards movement is most likely a B or X wave within a larger correction for intermediate wave (2). It is possible but unlikely that this upwards movement is the start of intermediate wave (3).
New updates to this analysis are in bold.
Last published weekly chart is here.
MAIN DAILY ELLIOTT WAVE COUNT
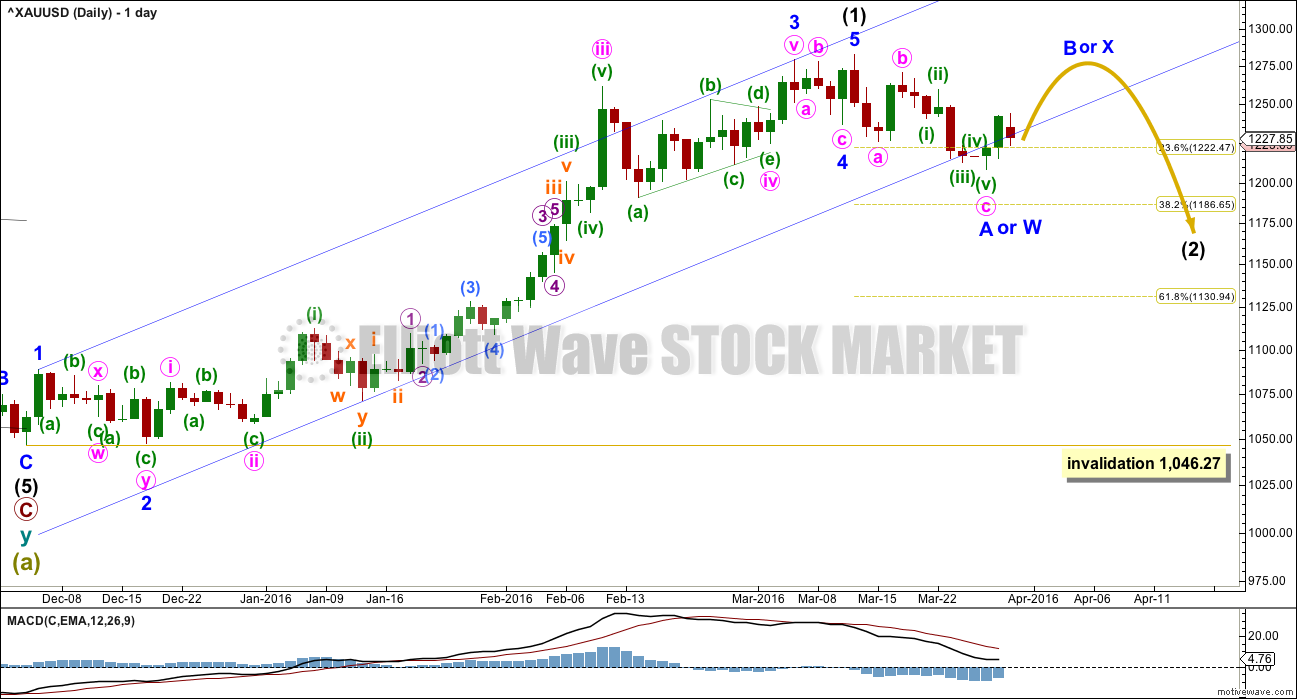
Intermediate wave (1)is a complete impulse. Intermediate wave (2) may have begun. COT supports this wave count; the majority of commercial traders are short (as of 22nd March). While this does not pinpoint when price should turn, it does support a larger downwards trend about here.
The first movement down within intermediate wave (2) subdivides as a three, not a five. This indicates intermediate wave (2) is not unfolding as the most common zigzag, so it may be unfolding as a flat, combination or double zigzag. The first three down may be minor wave A of a flat or minor wave W of a double combination or double zigzag.
If the correction up labelled minor wave B or X is shallow, then intermediate wave (2) would most likely be a double zigzag. Double zigzags have a slope against the prior trend; they are not sideways movements. A double zigzag may end close to the 0.618 Fibonacci ratio at 1,131.
If the correction up labelled minor wave B or X is deep and reaches to 1,275.24 or above, then intermediate wave (2) would most likely be a flat or combination. These are both sideways movements. A combination or flat may end closer to the 0.382 Fibonacci ratio at 1,187.
The channel about intermediate wave (1) is today drawn using Elliott’s technique. Upwards movement may find resistance at the lower edge.
This wave count expects the upwards movement to be a counter trend movement. The trend remains down at intermediate wave degree. Minor wave B or X would be likely to look like a three wave structure at the daily chart level.
HOURLY ELLIOTT WAVE COUNT
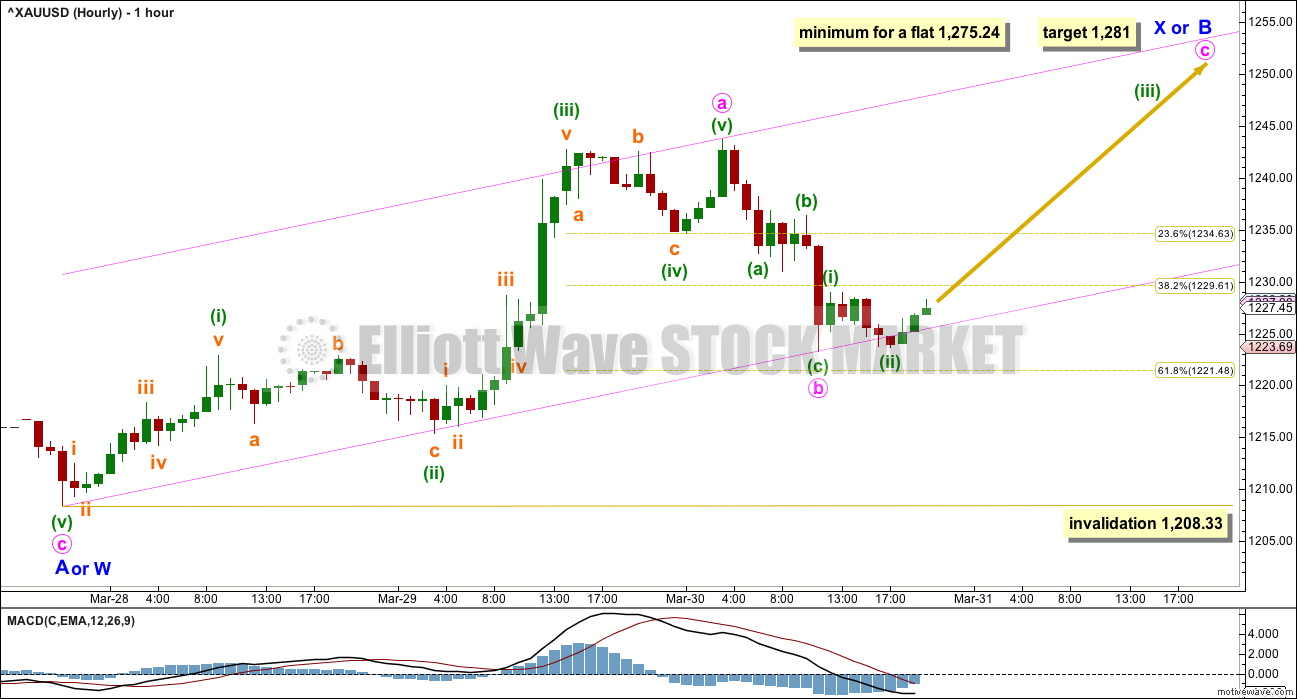
Minor wave A or W subdivides as a 5-3-5 zigzag. This structure is complete.
Minor wave B or X must subdivide as a corrective structure. This may be any one of 23 possible structures. The labelling will change as it unfolds. It is impossible for me to give you a road map for a B wave. They are the most difficult of all Elliott waves to analyse, and usually it is only clear what structure they take at the end. There is too much variety within B waves.
So far it looks like upwards movement for minute wave a was an impulse. Downwards movement to follow may be a complete zigzag for minute wave b. If minute wave a is correctly labelled as a five wave structure, then minute wave b may not move beyond the start of minute wave a below 1,208.33. Minor wave B or X would be a simple zigzag.
If downwards movement continues further, it may be minute wave b deepening as a double zigzag, or the labelling within it may be wrong.
At 1,281 minute wave c would reach 1.618 the length of minute wave a. The minimum requirement for a flat correction would be met.
If intermediate wave (2) is unfolding as a flat correction, then within it minor wave B must reach to 0.9 the length of minor wave A at 1,275.24 or above. Minor wave B may make a new high above the start of minor wave A at 1,282.68 as in an expanded flat.
If intermediate wave (2) is unfolding as a double combination, then there is no minimum requirement for minor wave X within it. It must only subdivide as a corrective structure. X waves within combinations are normally deep.
If intermediate wave (2) is unfolding as a double zigzag, then there is no minimum requirement for minor wave X within it; but minor wave X should not be deep, it should be shallow.
ALTERNATE DAILY ELLIOTT WAVE COUNT
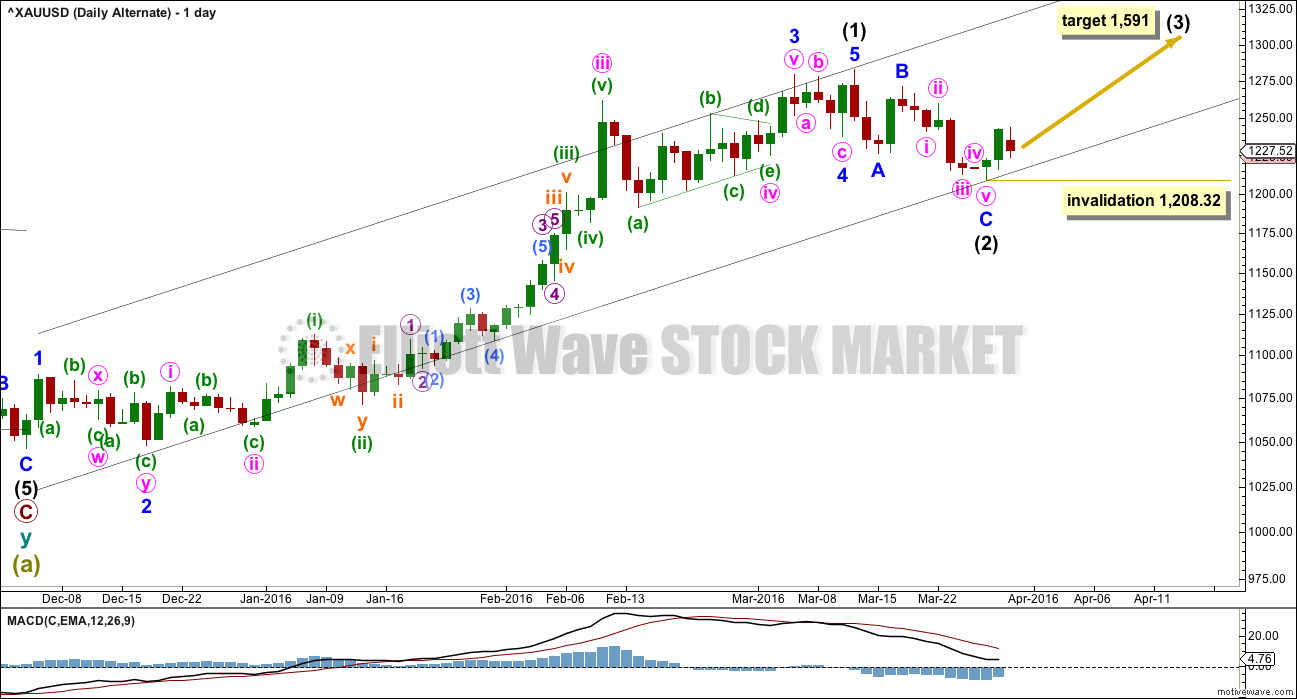
It is technically possible but highly unlikely that intermediate wave (2) is over. This wave count requires confirmation with a five up on the hourly chart for confidence. A new high is not confirmation of this wave count.
If intermediate wave (2) is over, then it is a very brief and shallow 0.31 zigzag lasting only eleven days (intermediate wave (1) lasted 69 days). The probability of this is very low.
At 1,591 intermediate wave (3) would reach 1.618 the length of intermediate wave (1).
Within intermediate wave (3), no second wave correction may move beyond its start below 1,208.32.
I do not want to give too much weight to this alternate by publishing an hourly chart. The subdivisions would be exactly the same as the main hourly chart.
TECHNICAL ANALYSIS

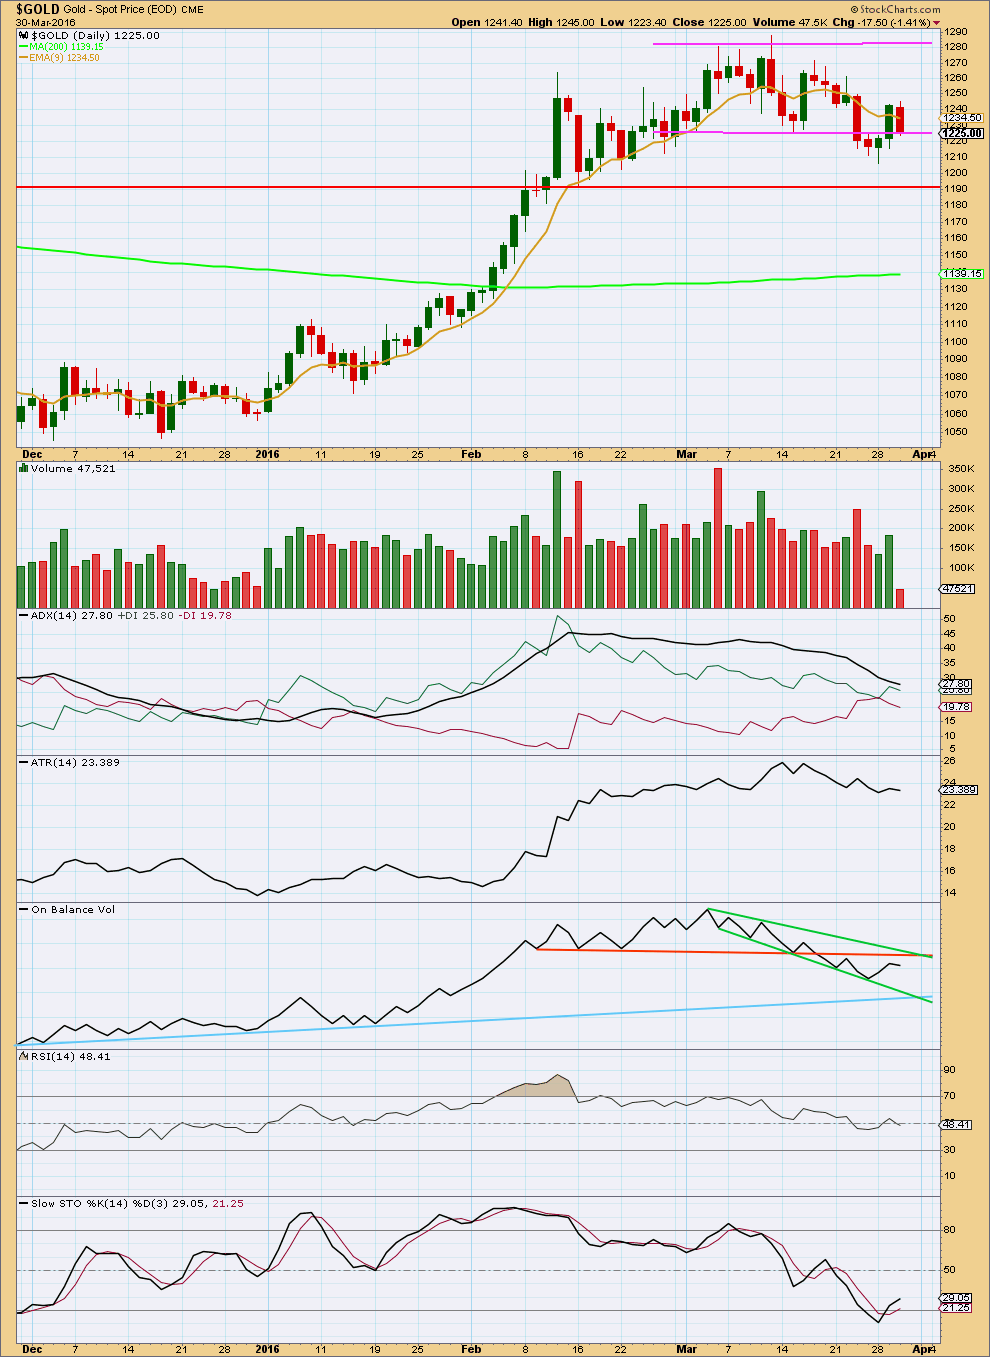
Click chart to enlarge. Chart courtesy of StockCharts.com.
Price is back within the consolidation zone and overall volume continues to decline. What looked like a breakout on 23rd March was false.
During the consolidation so far, it is still the upwards day of 10th March which has strongest volume. This indicates an upwards breakout is more likely than downwards. This does not support the main Elliott wave count but does support the alternate Elliott wave count.
Downwards movement for last session of 30th March comes with very light volume. The fall in price was not supported at all by volume. This does support the Elliott wave counts which expect some upwards movement from here at least short term.
ADX is clearly declining indicating the market is not trending. ATR is still sideways, which is in agreement with ADX.
On Balance Volume today only slightly declined. If OBV turns upwards, it is likely to find strong resistance at the orange trend line. This line is highly technically significant; it is long held, horizontal and repeatedly tested. The next rise in price may end when OBV touches that line again.
RSI is neutral. There is room for price to rise or fall.
Stochastics is returning from oversold.
This analysis is published @ 09:52 p.m. EST.


The slow gold grind the last few days with low volume has nothing to do with E wave, trend lines, TA, Etc.
Traders are waiting for the job numbers coming out tomorrow, nothing more.. Don’t believe it? Watch your screens at exactly 8:30am EST tomorrow and be amazed . Tomorrow’s move in gold (up or down) is largely dependent on economic data and nothing more.. Don’t kid yourselves..
Why is volume for today so light?
I have COMEX data stating 1,521 (million I presume) for today, with yesterday 47,521 and the day before a more normal 184,084.
Volume today is ridiculously light. Looks like an end to this consolidation. We should have a breakout very soon indeed, within the next 24 hours.
Looks like something big is about to happen.
FRIDAY, APRIL 1
8:30 am EST US – Non-farm payrolls March 203,000 242,000
10 am EST US – ISM manufacturing March 51.0% 49.5%
Markets may want a strong ISM and a weak jobs report – Mar 31, 2016 1:28 p.m. ET
Analyst: ‘Strong jobs data may trigger fears of tighter policy’
http://www.marketwatch.com/story/markets-may-want-a-strong-ism-and-a-weak-jobs-report-2016-03-31
Well, this is taking its time isn’t it.
I think this is a first wave up within minute wave c.
I’m moving the labelling of minuette (i) up to todays high. This downwards movement may be minuette (ii). It should find support at the lower edge of the pink channel I’ve drawn on the hourly chart, which is about 1,230 right now.
If price touches that pink trend line I may consider adding a little to my small position.
That’s the hardest thing to do as traders; open a position when price is moving in the opposite direction. But a great technique is to use trend lines that have proven to provide support / resistance as an entry point to join a trend.
If anyone is not crystal clear on what I’m trying to explain here let me know.
Using http://www.pmbull.com at the 30 minute or 1 hour time frame I do see the lower trend line at about $1,230 now and it has been providing support since March 27th.
I am reasonably confident that price will move higher in the next 24 hours. I have just opened a small buy with a stop just below 1,223.32 ( I add 3 X my broker spread so I’m not taken out by widening margins during whipsaws and higher volatility) and a target at 1,281. The risk / reward ratio at my entry point of 1,229 is 6.6 so that’s pretty good.
Let’s see how that goes.
Lara thanks for the update on your buy, prosperous trading to you and us all.
I bought some GDX this morning at $20.13, 3 cents above today’s low. I waited patiently and used my indicators and a very rough EW count, hopefully gold moves up from here. Now I start praying for gold to move up higher towards $1,275 +.
I’ve moved my stop up to break even. Eliminating risk.
This is one of the techniques I favour for risk management.
Now to wait and see if this trade “sticks”.
speechless……..awesome,,,,,very easy to understand for a beginner like me
thanks to periodically update…
Thank you very much Doni.
Now lets see if this expectation is correct and price goes up in the next few hours. If so we shall all be very happy. If not.. then I’ll be proven wrong by price.
Lara heartly thanks for your hardwork..the way you explore all the possibilities..its amazing…unbelievable sometyms…you are a gifted EW analysor…
Brilliant analysis as always… very nice. Thank you~!
Crikey.
Thank you very much Ruppu and Syed.
Simple Definition of ‘Crikey’
—used to express mild surprise
LOL
It’s a Kiwi (and Aussie) thing I think 🙂
Actually it’s Pommie in origin but is out of fashion in England except for the over 70’s. My Dad used to say it.