Downwards movement continued, which was expected for the alternate hourly Elliott wave count but not the main.
Summary: The trend is still down. The final target remains the same at 1,183 in the first instance. Along the way down, there should be one more small fourth wave correction. With downwards movement showing weakness at the end of the week, the fourth wave may show up on Monday / Tuesday.
New updates to this analysis are in bold.
To see last weekly charts click here.
DAILY ELLIOTT WAVE COUNT
Intermediate wave (2) is not over.
Normally, the first large second wave correction within a new trend is very deep, often deeper than the 0.618 Fibonacci ratio.
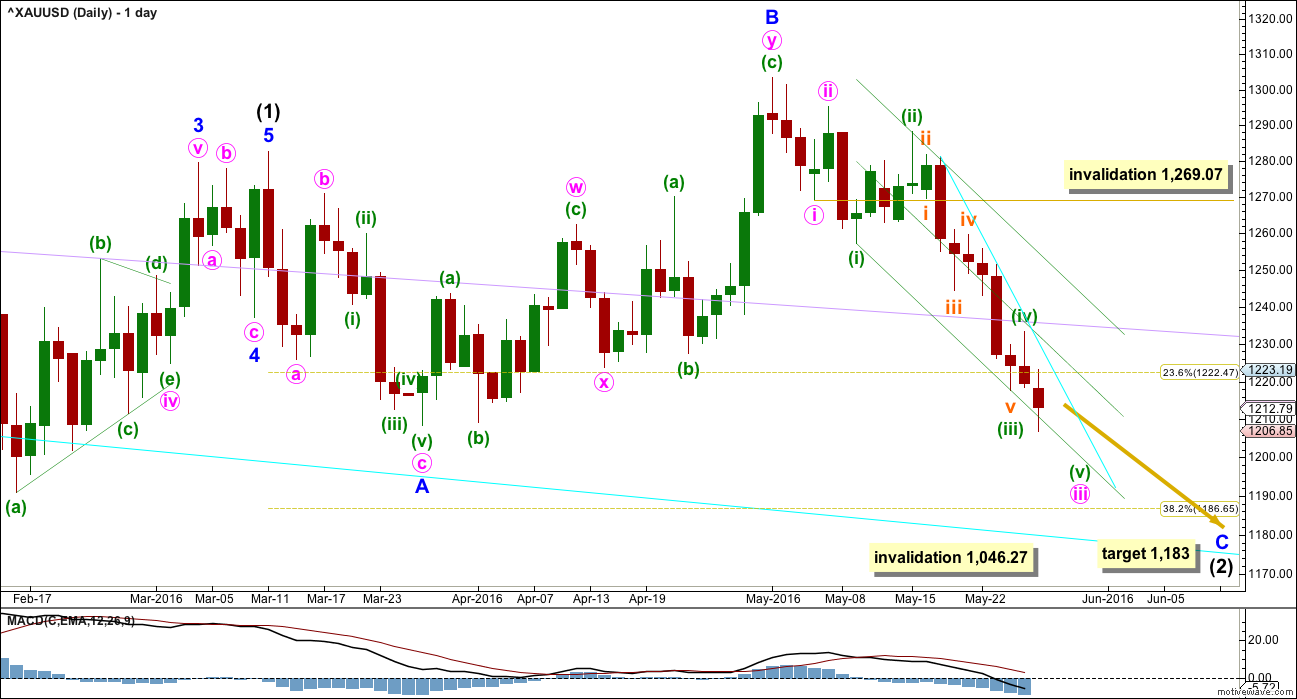
Intermediate wave (2) may be an expanded flat correction. Minor wave A is a three, minor wave B is a three and a 1.28 length of minor wave A. This is within the normal range of 1 to 1.38.
At 1,183 minor wave C would reach 1.618 the length of minor wave A. This would be the most likely target. If price keeps falling through this first target, then the second target would be at 1,108 where minor wave C would reach 2.618 the length of minor wave A.
Intermediate wave (2) may not move beyond the start of intermediate wave (1) below 1,046.27.
There are two structural options for minor wave C: either an impulse or an ending diagonal. Minor wave C does not look at this stage like an ending diagonal. It looks like the more common impulse.
Within the impulse, minute waves i and ii would be complete. Minute wave iii may only subdivide as an impulse. Within minute wave iii, minuette waves (i), (ii), (iii) and now (iv) may be complete as labelled.
With downwards movement showing weakness, it looks like the strongest portion of minor wave C is complete.
Draw a channel about minute wave iii using Elliott’s first technique: draw the first trend line from the ends of minuette waves (i) to (iii), then place a parallel copy on the end of minuette wave (ii). Copy this channel over to the hourly chart. The lower edge is being breached. If properly breached, it may provide resistance. Add a mid line. This may show where minute wave iv finds resistance. Minute wave iv may also find some resistance about the lilac trend line which is copied over from the weekly chart.
At the end of the week, minor wave C has now made a new low below the end of minor wave A at 1,208.32. A truncation and a very rare running flat is avoided. Intermediate wave (2) is now technically a very common expanded flat. At this stage, look out for surprises to the upside next week. It is possible that intermediate wave (2) could be over quickly and intermediate wave (3) upwards could begin.
Add a trend line to show where upwards moment is finding resistance (cyan). Copy this over to the hourly chart. While price remains below this line, expect the trend short term is down. When this line is breached, it would most likely be minute wave iv, the final correction along the way down to the final target.
HOURLY ELLIOTT WAVE COUNT
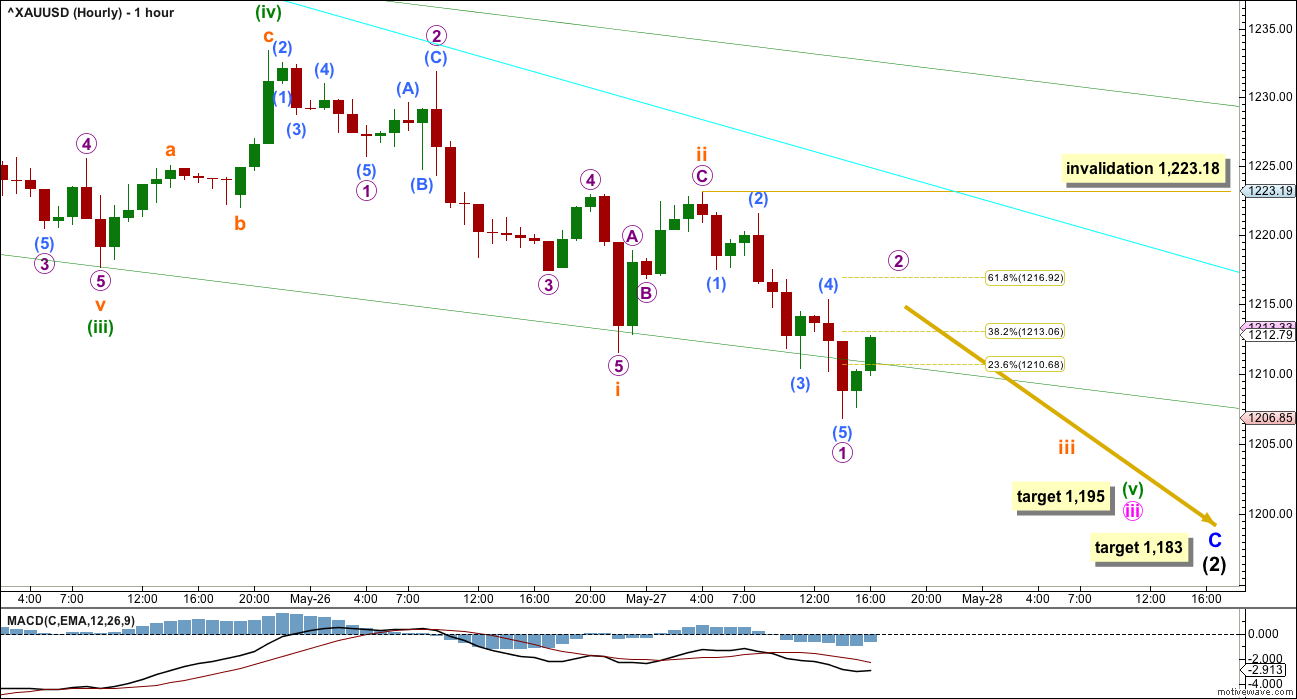
We should assume the trend remains the same until proven otherwise. The trend is down until it is not. While price remains below the cyan trend line, expect that minute wave iii is incomplete.
At 1,195 minuette wave (v) would reach equality in length with minuette wave (i).
Within the middle of minuette wave (v), the correction for micro wave 2 may not move beyond the start of micro wave 1 above 1,223.18. Micro wave 2 may correct to the 0.618 Fibonacci ratio at 1,217 before the downwards trend resumes.
ALTERNATE HOURLY ELLIOTT WAVE COUNT
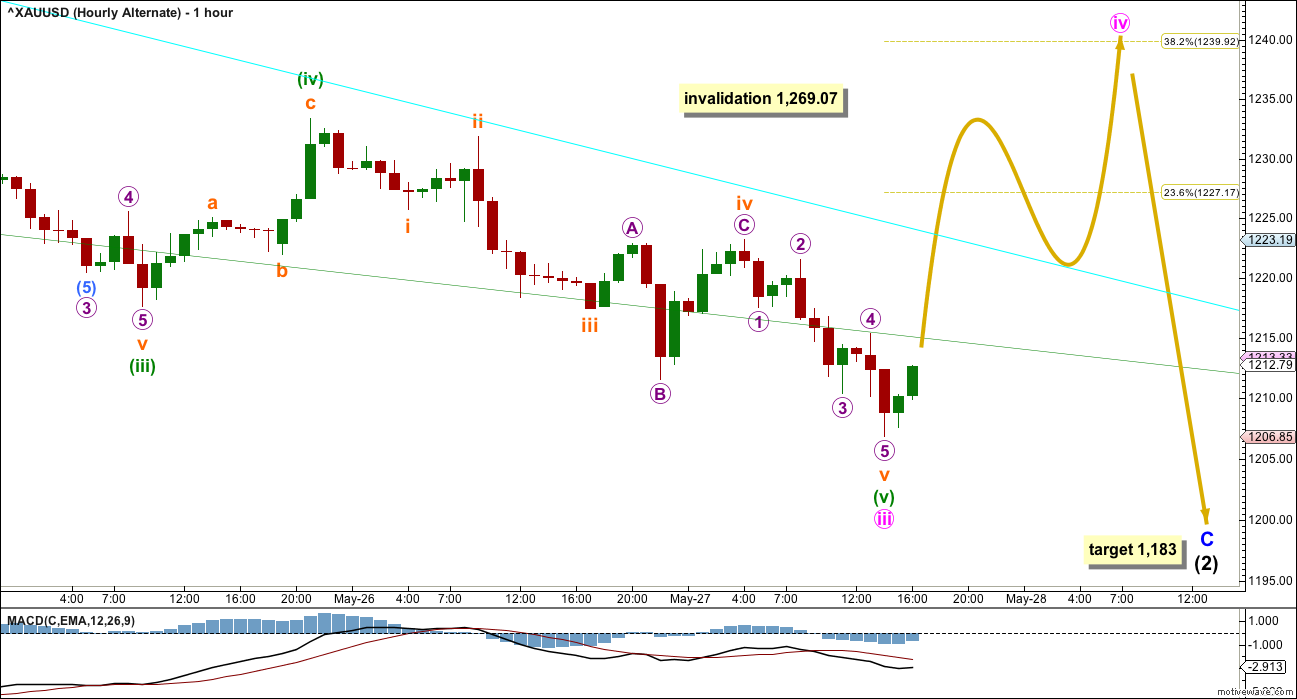
It is possible that minute wave iii is complete and minute wave iv may begin on Monday.
Minute wave ii was a deep zigzag. Minute wave iv may be a shallow flat, combination or triangle. The most likely targets for it would be the 0.236 and 0.382 Fibonacci ratios.
This alternate requires a breach of the cyan line before confidence may be had in it. A new high above 1,223.18 would provide price confirmation.
When minute wave iv is complete, then the final target for minor wave C may be calculated at two wave degrees. At that stage, it may widen to a small zone or it may change.
Minute wave iv should show up on the daily chart as at least one green candlestick or doji. It may last one to four sessions.
TECHNICAL ANALYSIS
WEEKLY CHART
Click chart to enlarge. Chart courtesy of StockCharts.com.
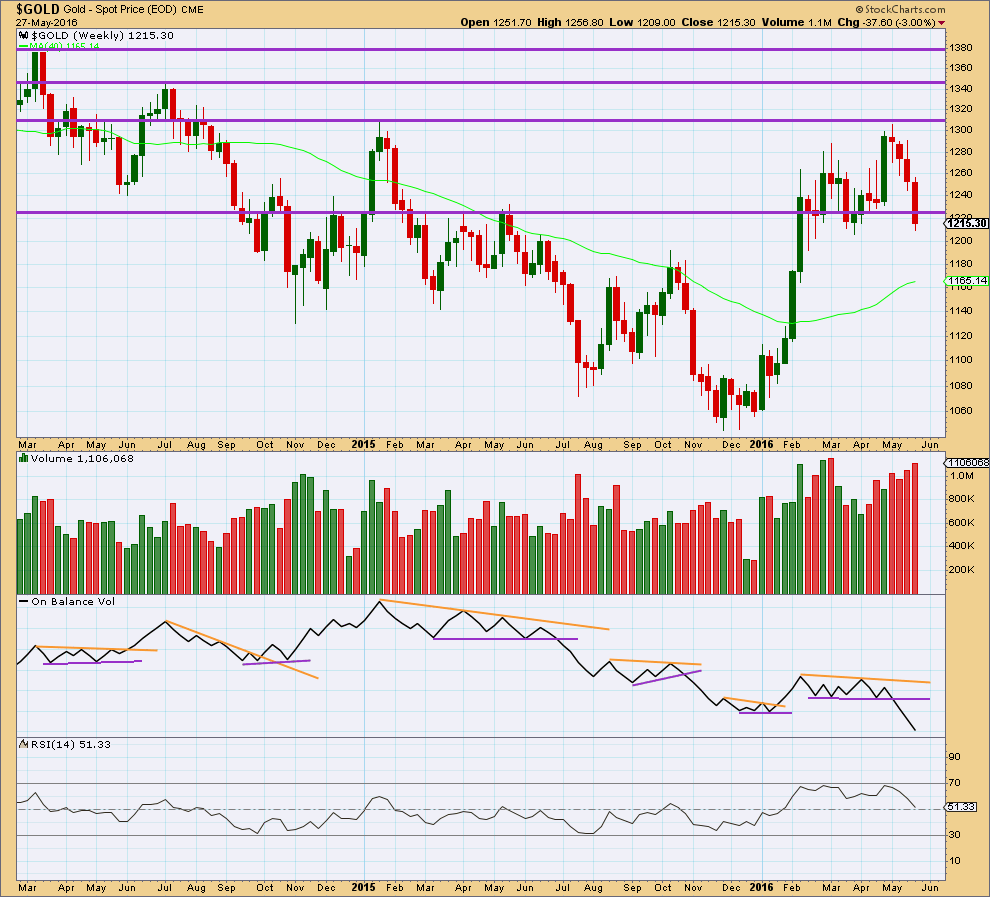
On Balance Volume is breaking below a reasonably long held and clearly defined consolidation zone. It would be entirely reasonable to expect price to follow by continuing lower for a few weeks. This piece of evidence strongly supports the Elliott wave count.
This week price has broken below and closed below support about 1,225. Price has fallen on increasing volume for four weeks in a row. This supports a downwards trend.
RSI is neutral. There is plenty of room for price to fall.
DAILY CHART
Click chart to enlarge. Chart courtesy of StockCharts.com.
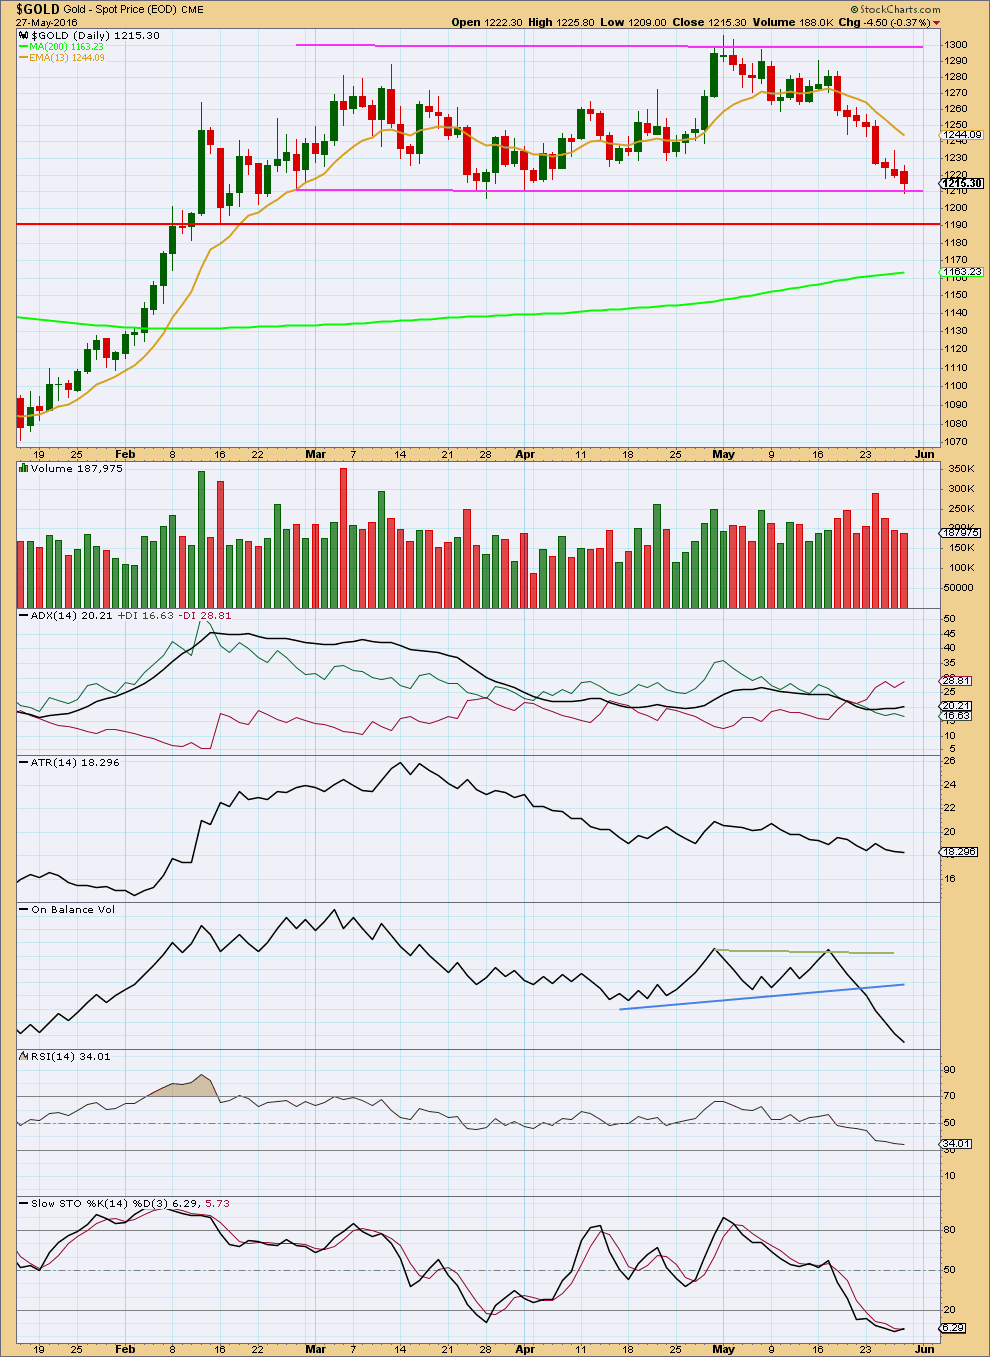
In the short term, it looks like this downwards trend is weakening. Price has moved lower for the last three days but on declining volume. This fall in price is not supported by volume. Price may find some support here about 1,210.
ADX indicates there is a trend and it is down. ATR still disagrees as it is declining. This disagreement at this stage of downwards movement indicates this move may be a counter trend movement. This supports the Elliott wave count.
On Balance Volume continues to agree with downwards movement from price.
RSI is not yet extreme. There is further room for price to fall.
Stochastics is oversold and shows slight divergence with price for Friday. Stochastics moved slightly higher while price made a new low on Friday. This indicates weakness to downwards movement.
On balance, it seems clear that there is a downwards trend, but a small pause for some consolidation may be expected to unfold about here.
This analysis is published @ 06:00 p.m. EST on 28th May, 2016.

So far gold’s low has been 1199.70. Does this low complete minute wave iii (pink)?
Should see a reversal for few days to trap more bulls?????
I think so, yes.
Possible count using Lara’s main count framework, thoughts?
That was pretty close to an alternate I was preparing to publish… until price broke above 1,211.57. Now the possible fourth wave is in first wave price territory, so that idea is invalid.
So I’ll have just the one hourly wave count today.
Lara: What if gold takes out the gold price $1045?
The reason I am concern is gold did not take out the Jan 2015 high.
Just a thought.
Look at the charts in the post only????
https://goldtadise.com/?p=371529
What if?
Anything is possible. At this stage I have not been able to find an Elliott wave count that makes sense of that possibility.
The last major swing high during the bear market for Gold wasn’t January 2015, it was October 2015. That high has been definitely taken out.
The equivalent high for Silver has also been taken out.
So a Dow Theory application to Gold and Silver says they’re now in a bull market.
Any technical analysis approach has to see those swing highs within the last bear market as important, new highs above them are important. That signals a major trend change.
The only thing which I could construe technically as possibly bullish for Gold would be a Magee trend line. From the start of the bear market to the first major swing high within it (September 2012). That trend line hasn’t been breached. But then it won’t be until about 1,350. Which is a long way away.
Sorry everybody, my last paragraph should read:
“The only thing which I could construe technically as possibly bearish for Gold would be a Magee trend line.”