Today for GDX I have Elliott wave charts, classic weekly and daily technical analysis charts, and a brief summary.
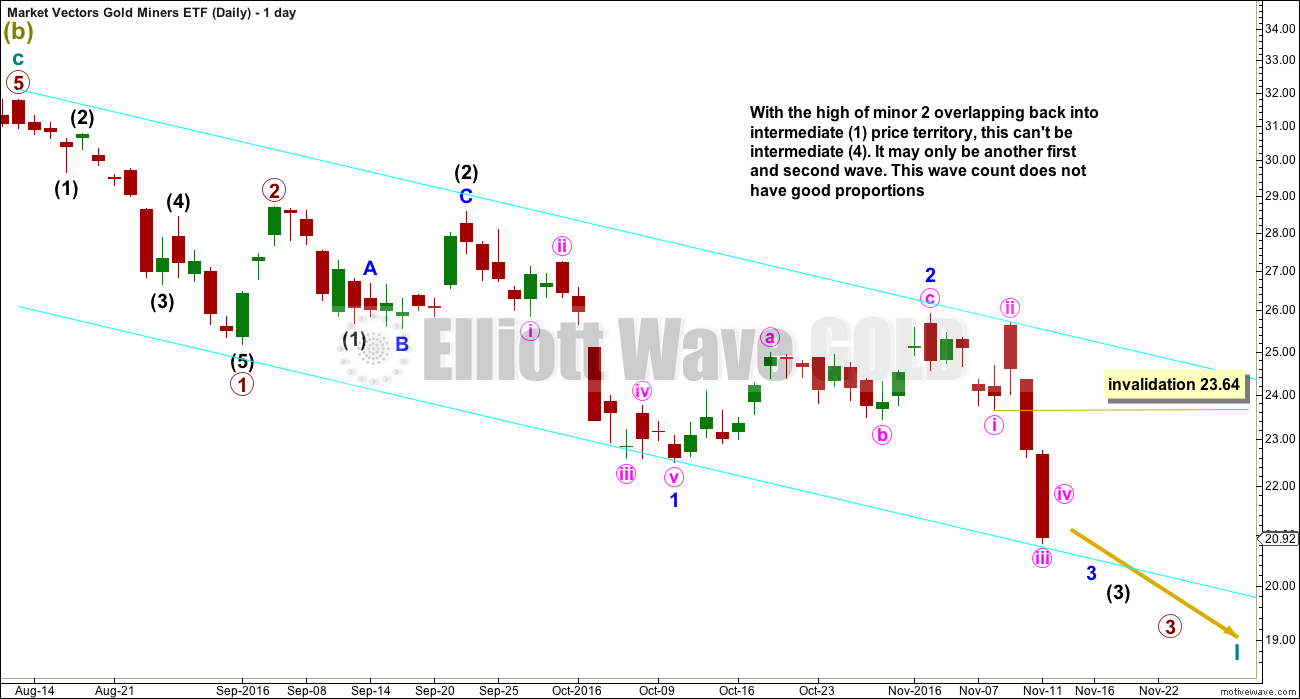
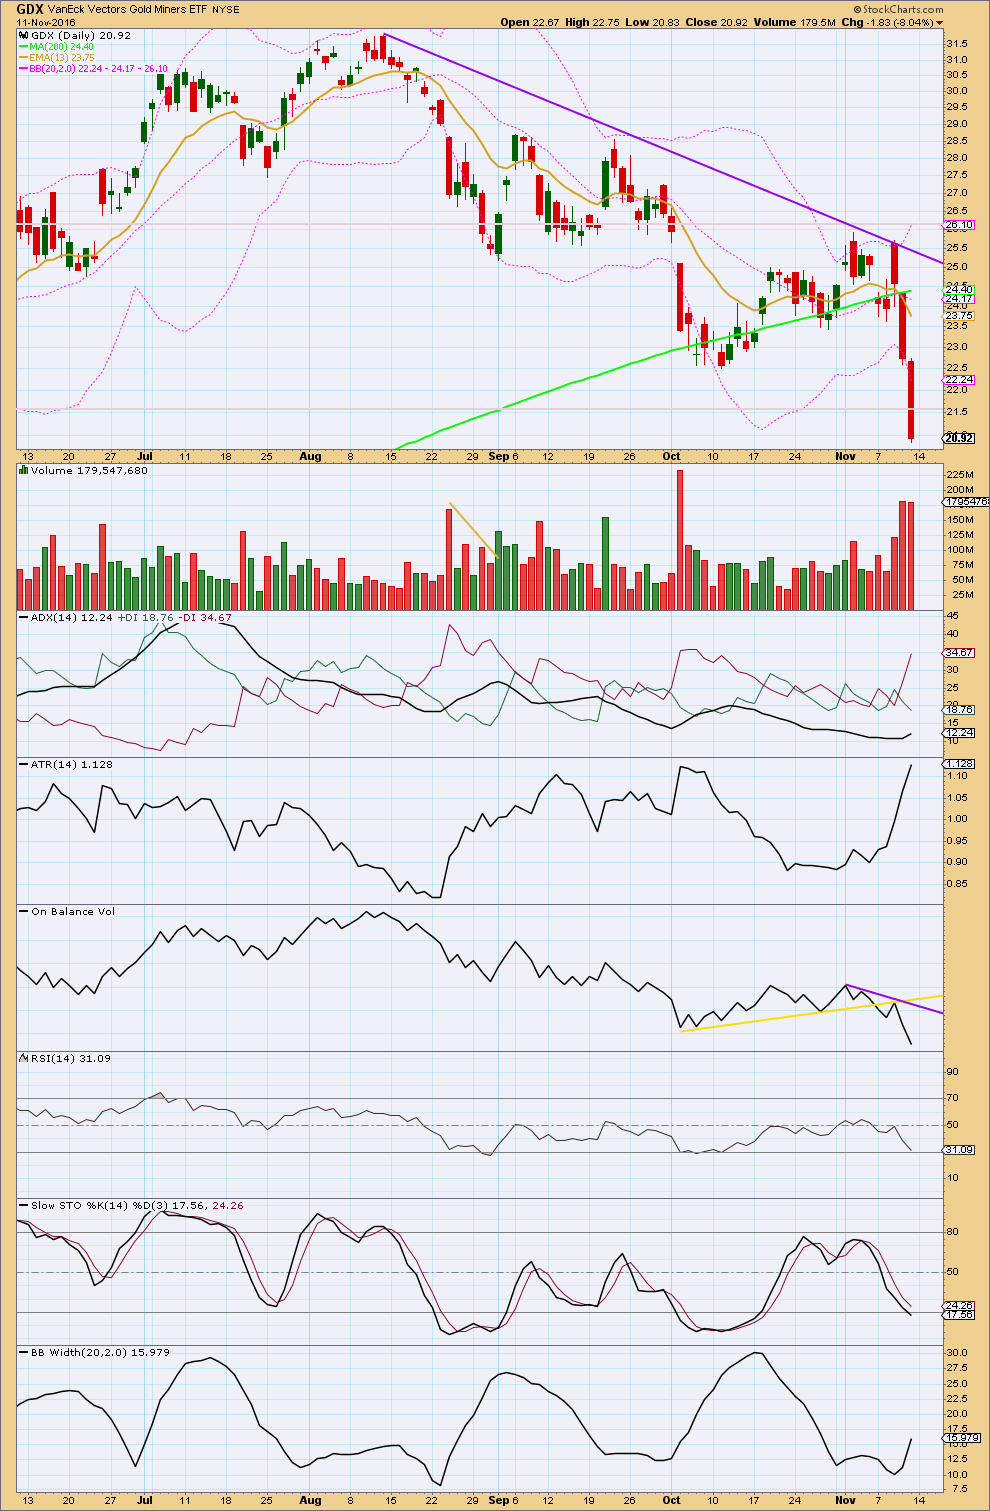
Summary: There is a strong downwards trend for GDX that does not show signs of weakness yet. Only when RSI and / or Stochastics reach oversold and then exhibit divergence may it be over. A new high above 23.64 would indicate the downwards trend may most likely be over.
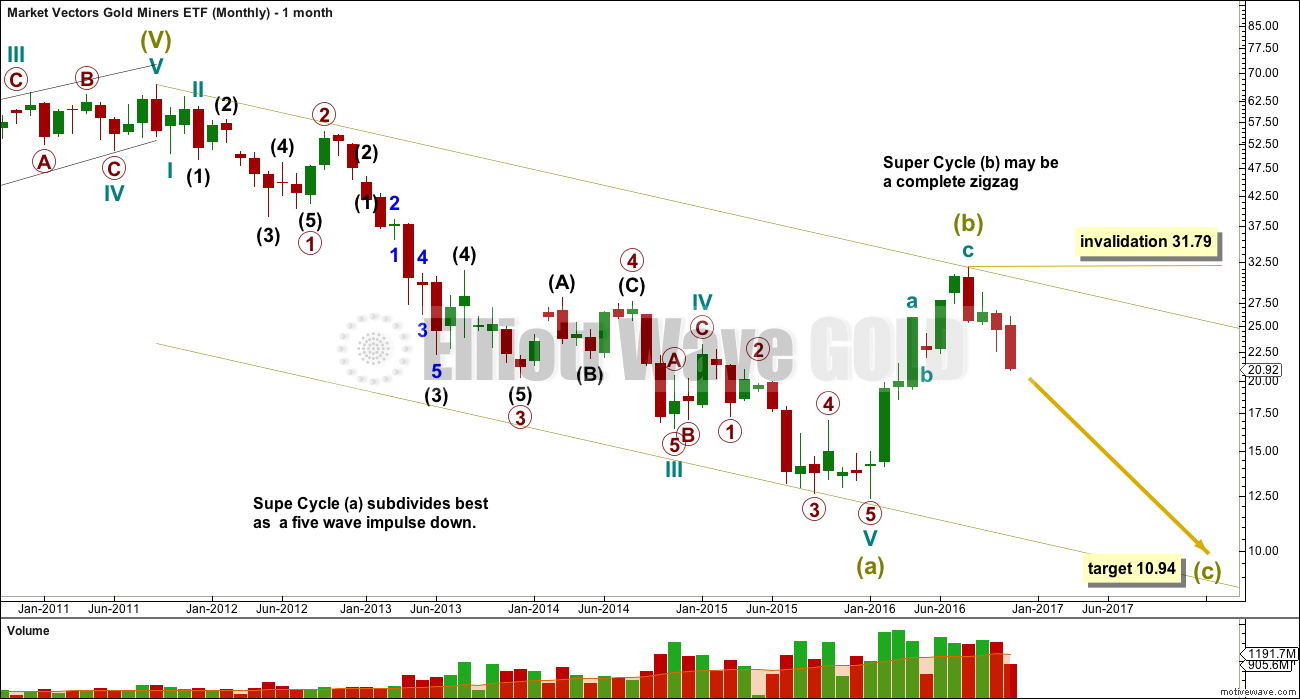
MONTHLY ELLIOTT WAVE COUNT
DAILY ELLIOTT WAVE COUNT
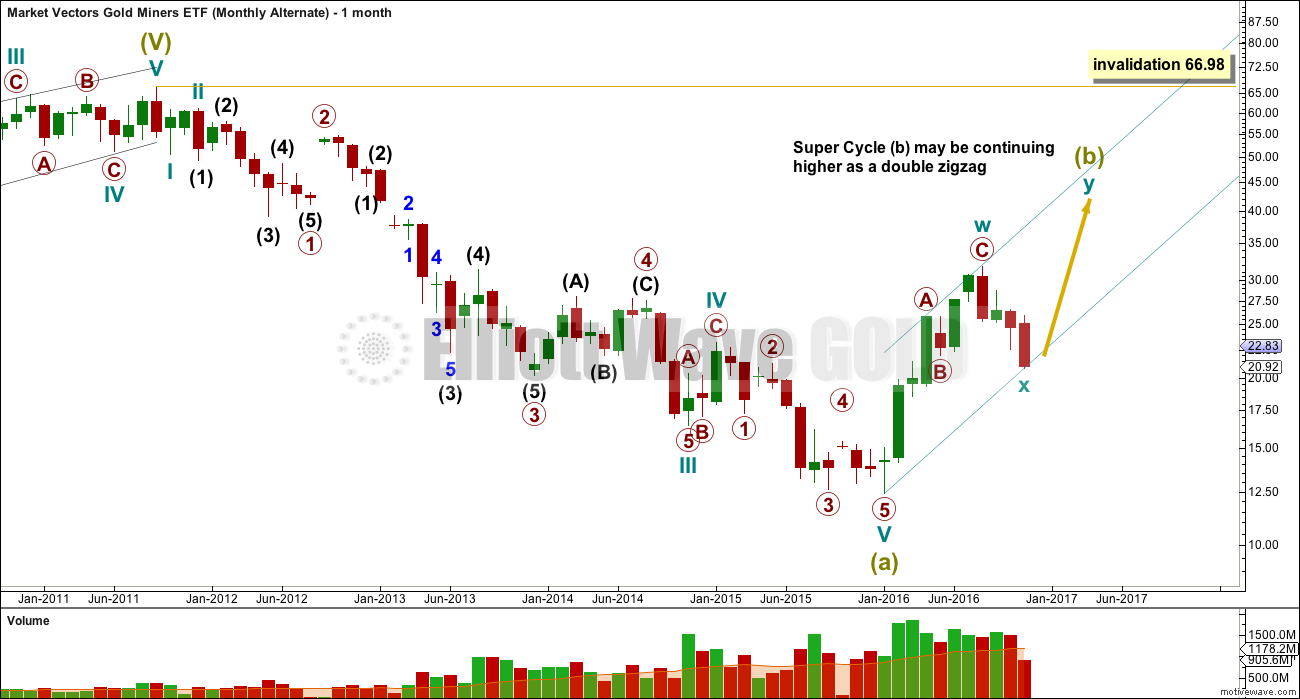
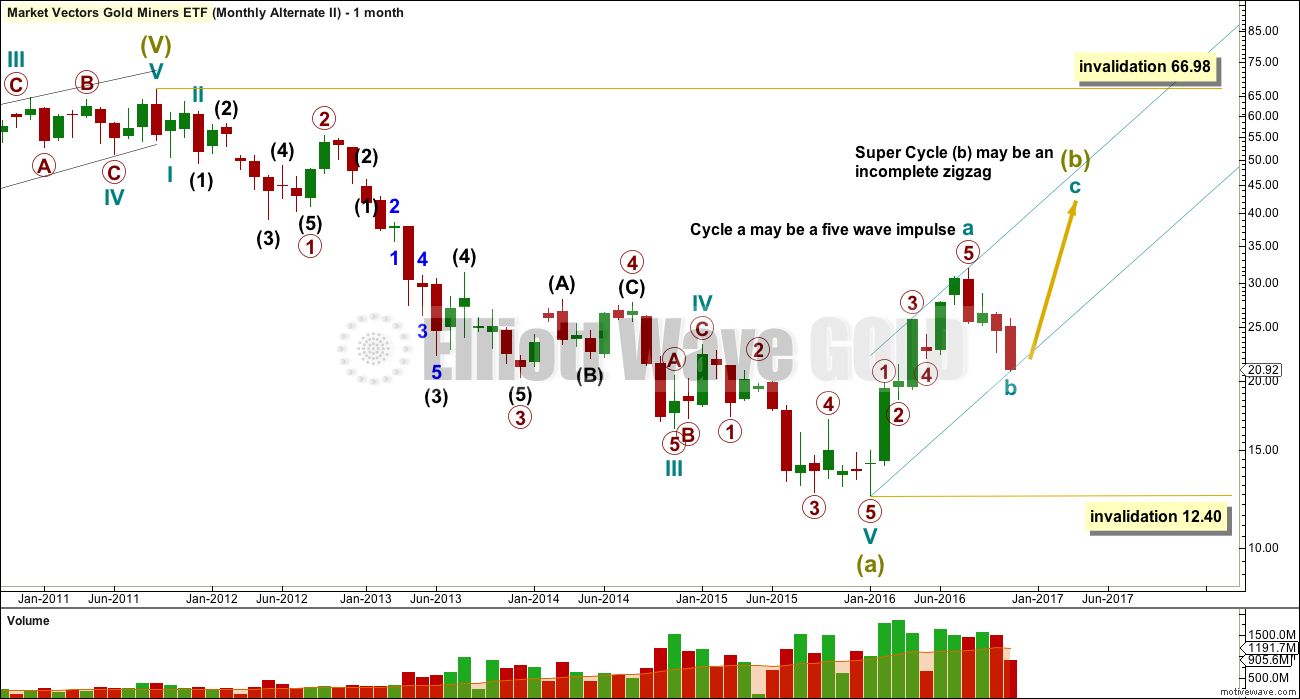
ALTERNATE MONTHLY ELLIOTT WAVE COUNT
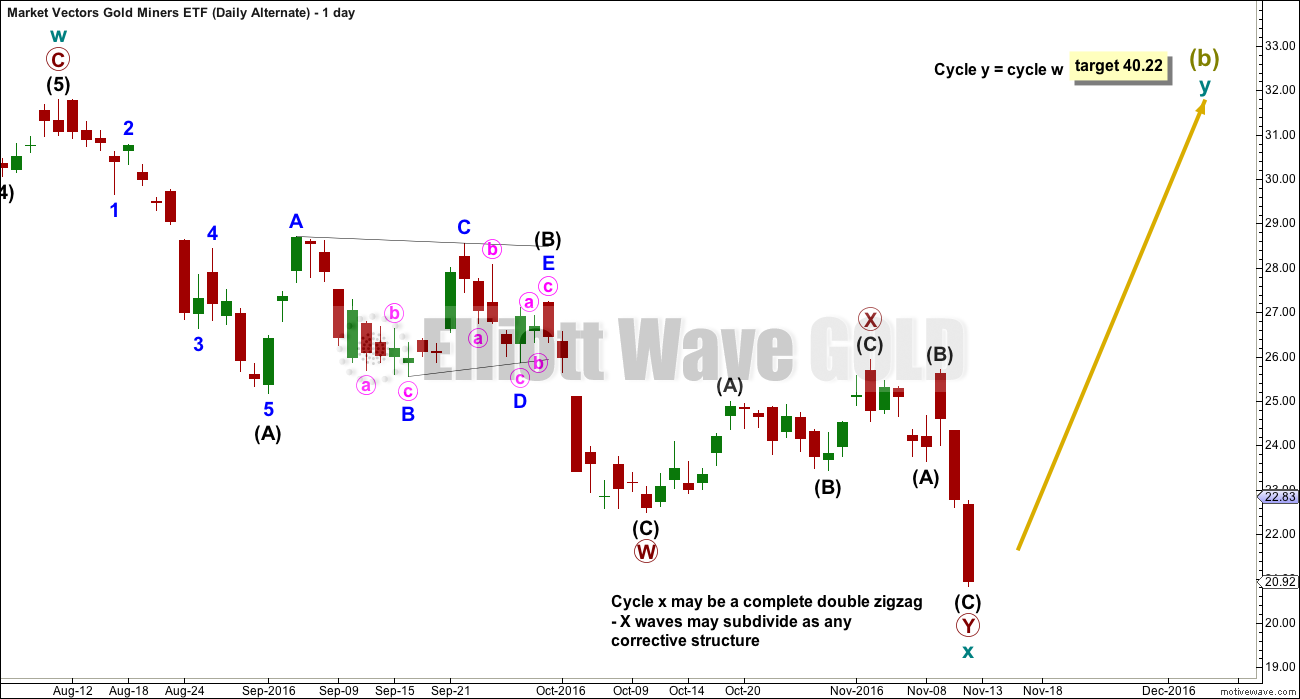
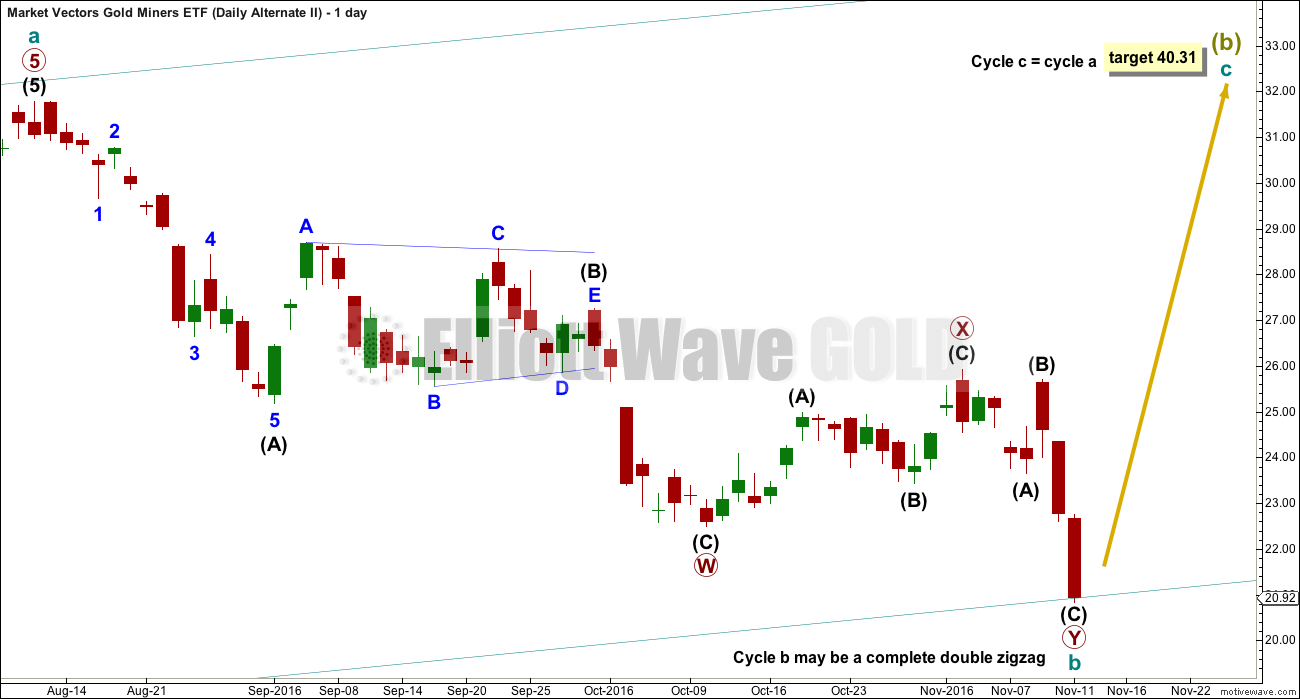
ALTERNATE DAILY ELLIOTT WAVE COUNT
SECOND ALTERNATE MONTHLY ELLIOTT WAVE COUNT
SECOND ALTERNATE DAILY ELLIOTT WAVE COUNT
TECHNICAL ANALYSIS
DAILY
This analysis is published @ 02:58 a.m. EST.

Lara, are these being presented in order of probability, or order they were worked?
I don’t think she likes to make a call on GDX. She lets the Gold count lead.