Price has moved higher to complete a green daily candlestick, as expected for the main Elliott wave count, but so far it is concerning that volume has not supported this movement.
Summary: At this stage, it looks more likely that Gold has just begun a sideways consolidation that may last a total of five, eight or thirteen days and may end about 1,211.60 to 1,232.48.
New updates to this analysis are in bold.
Grand SuperCycle analysis is here.
Last monthly and weekly charts are here. Last historical analysis video is here.
DAILY ELLIOTT WAVE COUNT
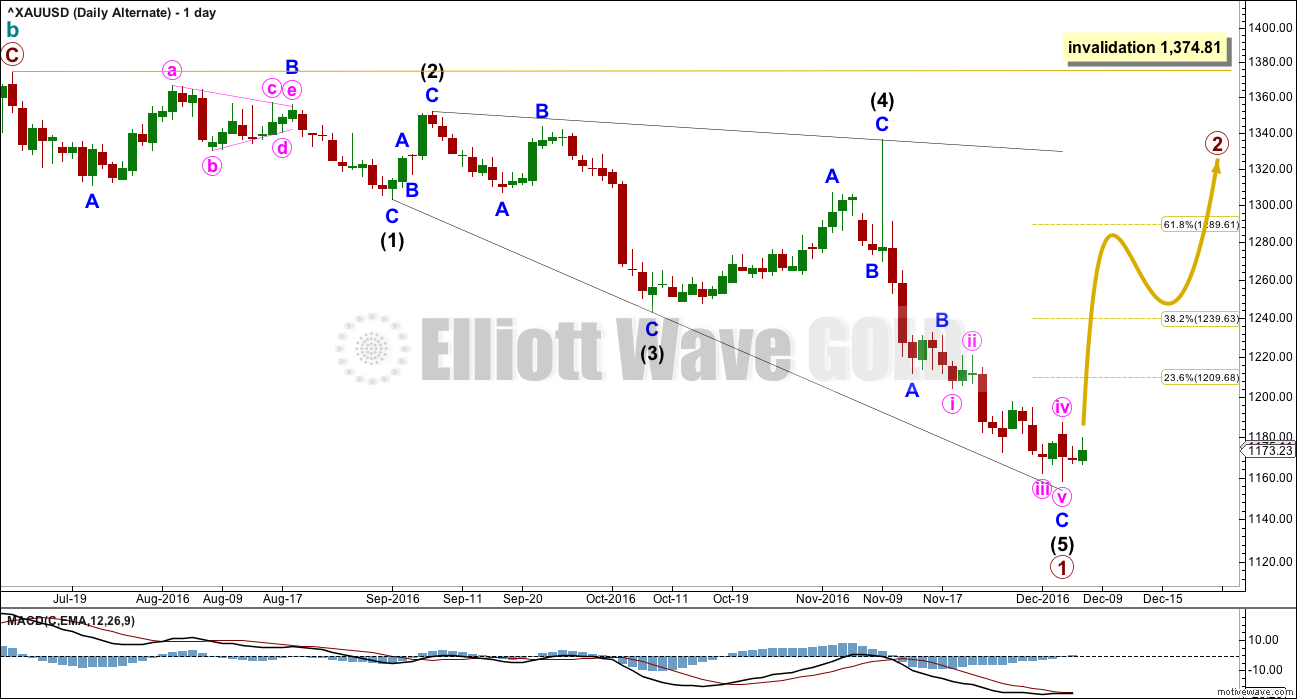
This daily chart works the same way for the two weekly charts in historical analysis. Both weekly charts see downwards movement as an almost complete double zigzag.
The larger structure of primary wave X (or primary wave 2) may be either a double zigzag or a double combination. The second structure in this double for primary wave Y may be either a zigzag (for a double zigzag) or a flat or a triangle (for a double combination).
If the next wave up is primary wave 3, then it may only subdivide as an impulse.
It is my judgement at this stage that it is more likely primary wave X will be a double zigzag due to the relatively shallow correction of intermediate wave (X). Although intermediate wave (X) is deep at 0.71 the length of intermediate wave (W), this is comfortably less than the 0.9 minimum requirement for a flat correction. Within combinations the X wave is most often very deep and looks like a B wave within a flat.
However, there is no minimum nor maximum requirement for X waves within combinations, so both a double zigzag and double combination must be understood to be possible. A double zigzag is more likely and that is how this analysis shall proceed.
Within the second structure, minor wave A should be a five wave structure.
Minor wave B found resistance at the lower edge of the wide parallel channel about primary wave X. Along the way up, price may find resistance at the lower edge of this channel. Resistance at this trend line needs to be overcome for any bullish wave count from here to have a reasonable level of confidence.
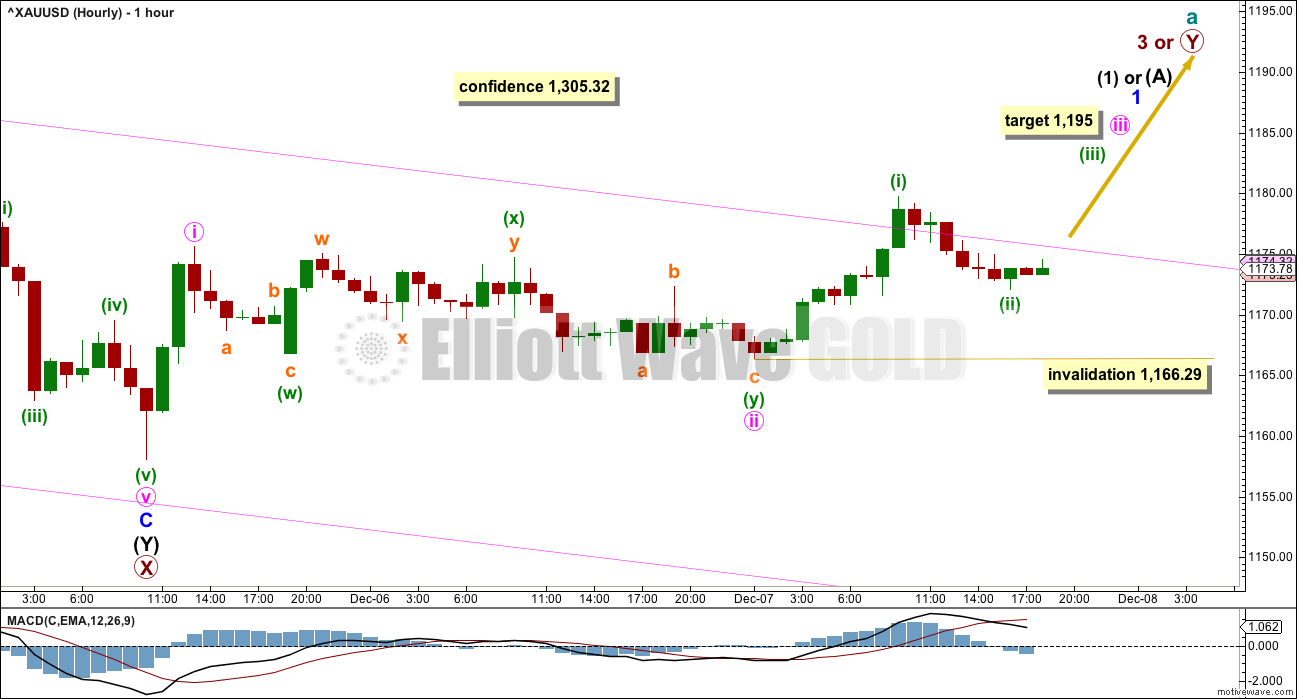
Minor wave C may now again be complete at the hourly chart level.
If the next wave up is another zigzag for primary wave Y, then it would reach equality in length with primary wave W at 1,487.
If the next wave up is an impulse for primary wave 3, then it would reach 1.618 the length of primary wave 1 at 1,690.
HOURLY ELLIOTT WAVE COUNT
The channel is drawn here using Elliott’s second technique. The upper edge may provide some resistance along the way up. Next resistance may come at the lower edge of the black channel on the daily chart.
The last two lows exhibit divergence between price and MACD. Downwards movement is lacking momentum.
A new high above 1,305.32 would add confidence that there has been a trend change for Gold. Unfortunately, this confidence point must move substantially higher for this main wave count due to a change to the alternate wave count.
Minute wave ii now fits as a double combination: zigzag – X – flat. Within the second structure, labelled minuette wave (y), both subminuette waves a and c fit as five wave structures on the five minute chart.
If minute wave iii begins here, then at 1,195 it would reach 1.618 the length of minute wave i. If minute wave ii moves lower, then this target must also move correspondingly lower.
Within minute wave iii, the correction for minuette wave (ii) may not move beyond the start of minuette wave (i) below 1,166.29.
This wave count expects to see an increase in upwards momentum and volume in the next 24 hours. If this does not happen, then the probability of this main wave count will decrease in favour of the second alternate idea below.
ALTERNATE DAILY ELLIOTT WAVE COUNT
Within leading diagonals, sub-waves 2 and 4 must subdivide as zigzags. Sub-waves 1, 3 and 5 are most commonly zigzags but sometimes may also appear to be impulses.
Within this structure, all sub-waves subdivide as zigzags. This wave count meets all Elliott wave rules. This diagonal looks correct.
This wave count has a lower probability at the daily chart level because leading diagonals are not very common structures for first waves. When first waves do subdivide as leading diagonals, they are most often contracting and not expanding. This wave count does not rely upon a rare structure, but it does rely upon a less common structure.
Primary wave 1 lasted 103 days. Primary wave 2 may initially be expected to last about a Fibonacci 55 or 89 days. It should be a big three wave structure.
At the hourly chart level, this alternate wave count would be essentially the same as the main hourly chart; minor wave C may now be complete.
At this stage, there is no divergence in expected direction between this alternate and the main wave count. The structure of upwards movement, if it is clearly a three or five, may assist to tell us which wave count is correct in coming weeks. For now this alternate must be judged to have a low probability due to the problems outlined. It is published to consider all possibilities.
SECOND ALTERNATE DAILY ELLIOTT WAVE COUNT
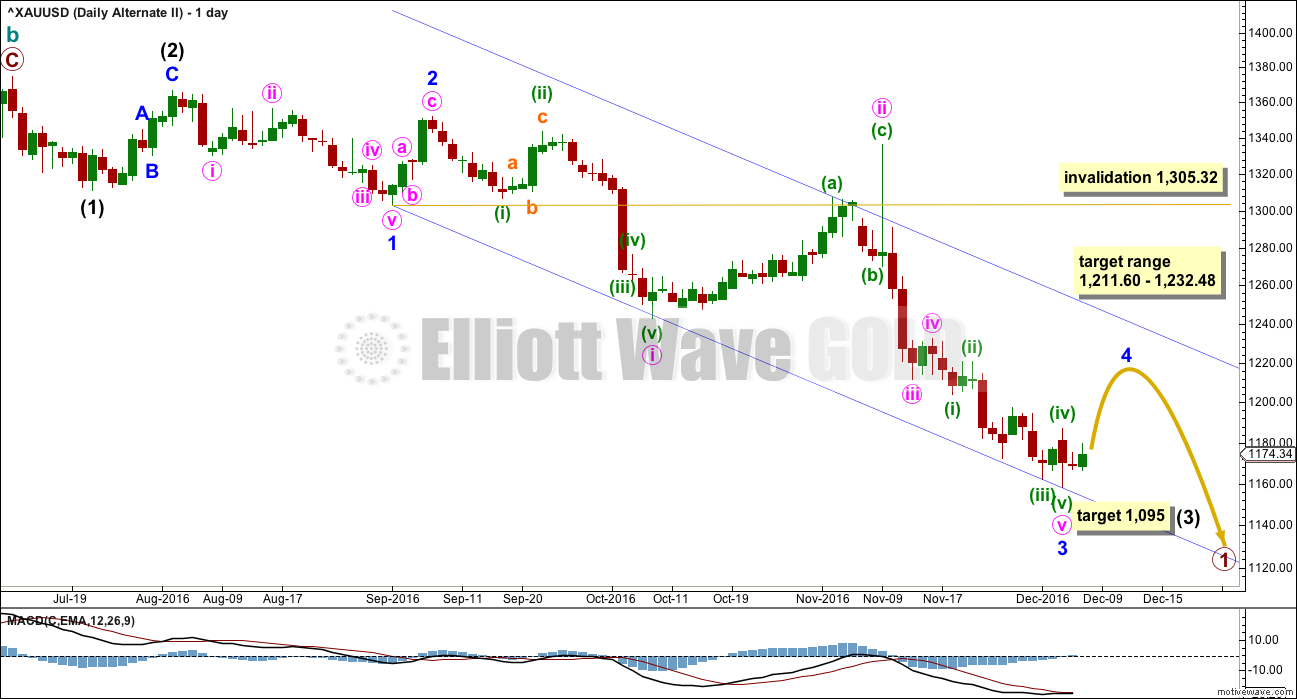
What if a new bear market is underway for cycle wave c? The most likely structure would be an impulse.
This wave count is adjusted today to see an impulse closer to completion. Price may be now moving into a small consolidation for minor wave 4.
The middle of the third wave may be complete for primary wave 1.
This wave count still suffers from a problem of disproportion between minute wave ii and the two prior second wave corrections one and two degrees higher. Minute wave ii should be quicker than minor wave 2 and especially intermediate wave (2). The fact that it is not must reduce the probability of this wave count.
If minor wave 3 is over, then it has no Fibonacci ratio to minor wave 1.
Ratios within minor wave 3 are: minute wave iii has no Fibonacci ratio to minute wave i, and minute wave v is 2.52 short of 0.618 the length of minute wave iii.
Minute wave v fits as a five wave impulse on the hourly chart even though it does not look quite right on the daily chart.
The blue channel here is a best fit. Draw the first trend line from the ends of minor waves 1 to 3, then push a parallel copy up to contain most of this movement except the spike for minute wave ii. Minor wave 4 may find resistance at the upper edge of the channel if it gets that high.
Minor wave 2 was a deep 0.77 zigzag lasting four days. Minor wave 4 may be a more shallow flat, combination or triangle. These tend to be longer lasting structures than zigzags, so at this early stage an expectation of a Fibonacci five, eight or thirteen sessions would be reasonable.
Minor wave 4 may end within the price territory of the fourth wave of one lesser degree. Minute wave iv has its range from 1,211.60 to 1,232.48.
Minor wave 4 may not move into minor wave 1 price territory above 1,305.32. This is why the confirmation point for the main wave count is now moved upwards today.
The target for intermediate wave (3) is at 1,095 where it would reach 4.236 the length of intermediate wave (1).
SECOND ALTERNATE HOURLY ELLIOTT WAVE COUNT
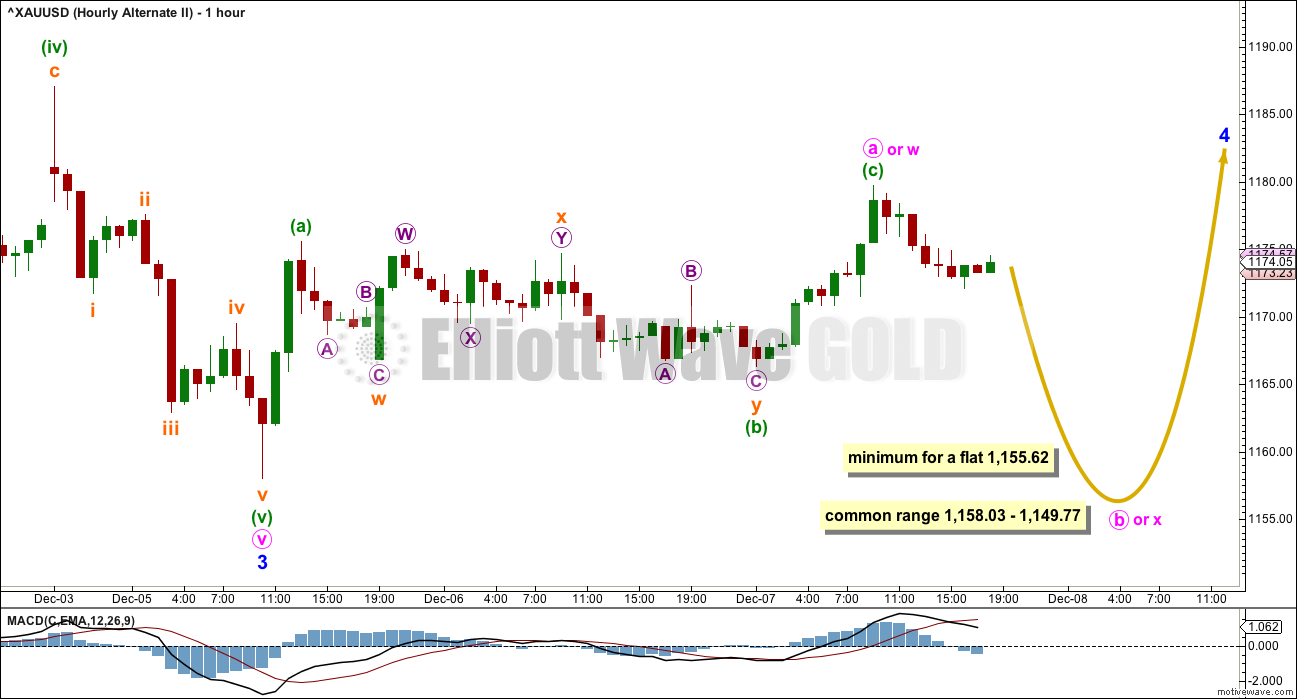
Minor wave 4 is least likely to unfold as a zigzag, so it is unlikely at this stage to be over at the high labelled minute wave a.
If minor wave 4 unfolds as the most likely flat, combination or triangle, then within it minute wave a is most likely to be a zigzag. This may now be complete.
When A waves subdivide as threes, there is no invalidation point for the following B wave because they may make new price extremes beyond the start of the A wave as in expanded flats and running triangles. The most common range for minute wave b would be from 1 to 1.38 the length of minute wave a at 1,158.03 to 1,149.77.
If minor wave 4 unfolds as a flat correction, then within it the minimum requirement for minute wave b is 0.9 the length of minute wave at at 1,155.62.
If minor wave 4 unfolds as a triangle, then there is no minimum nor maximum length for minute wave b within it. It must only subdivide as a three.
If minor wave 4 unfolds as a combination, then the first structure within the combination may be a complete zigzag labelled minute wave w. The double combination now should be joined by a three in the opposite direction labelled minute wave x. There is no minimum nor maximum for X waves within combinations. X waves must only subdivide as corrective structures, which may subdivide as any corrective structure including multiples.
Overall, this wave count expects to see for several more days choppy overlapping movement that may include a new low (but it does not have to make a new low). It is impossible to tell at this stage which Elliott wave structure minor wave 4 will complete as, only to say it is least likely to be a zigzag. There are still over 20 possible structures it may be, so it must be understood that as it continues this analysis at the hourly chart level must be flexible and that the labelling of minor wave 4 will change in coming days.
TECHNICAL ANALYSIS
WEEKLY CHART
Click chart to enlarge. Chart courtesy of StockCharts.com.
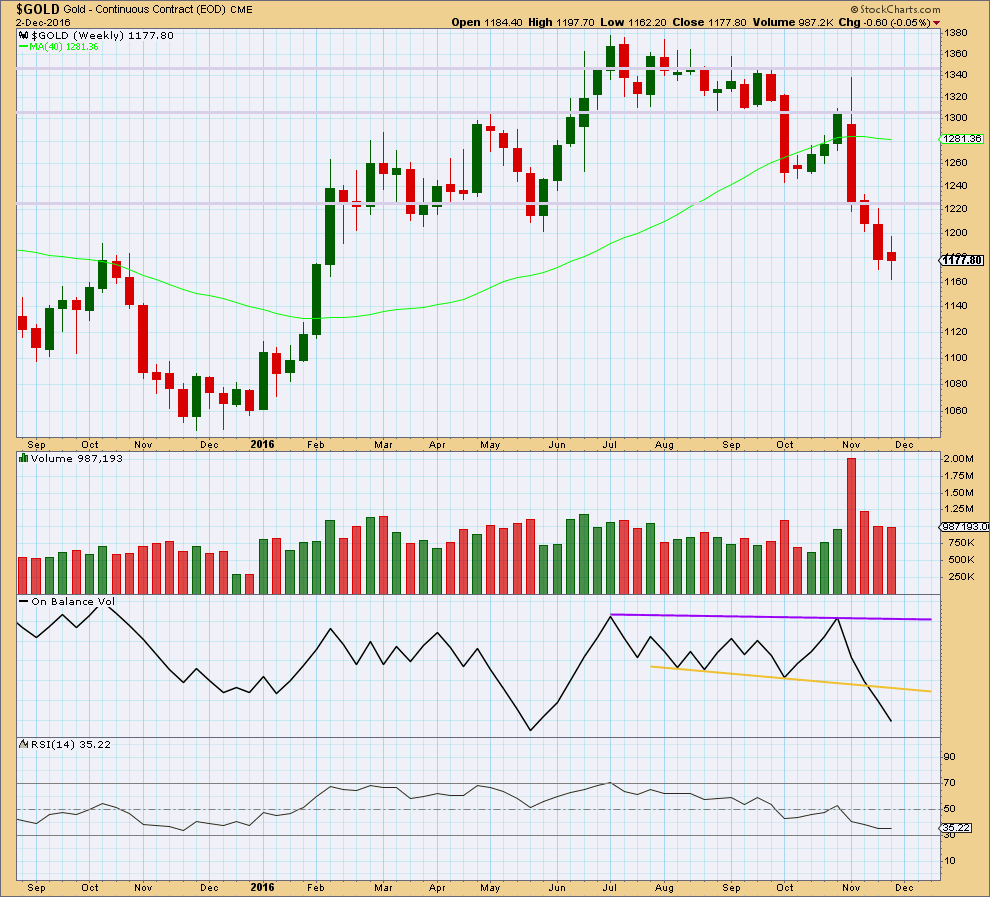
The spinning top candlestick for last week comes with slightly lighter volume. The fall in price does not have as much support from volume. Bears are tiring.
The small real body of last week’s candlestick makes it a spinning top. This puts the trend from down to neutral at this stage. The bears are losing momentum.
There is no support line here for On Balance Volume at the weekly chart level.
RSI is not extreme at the weekly chart level and exhibits no divergence with price to indicate weakness here. There is still room for price to fall.
DAILY CHART
Click chart to enlarge. Chart courtesy of StockCharts.com.
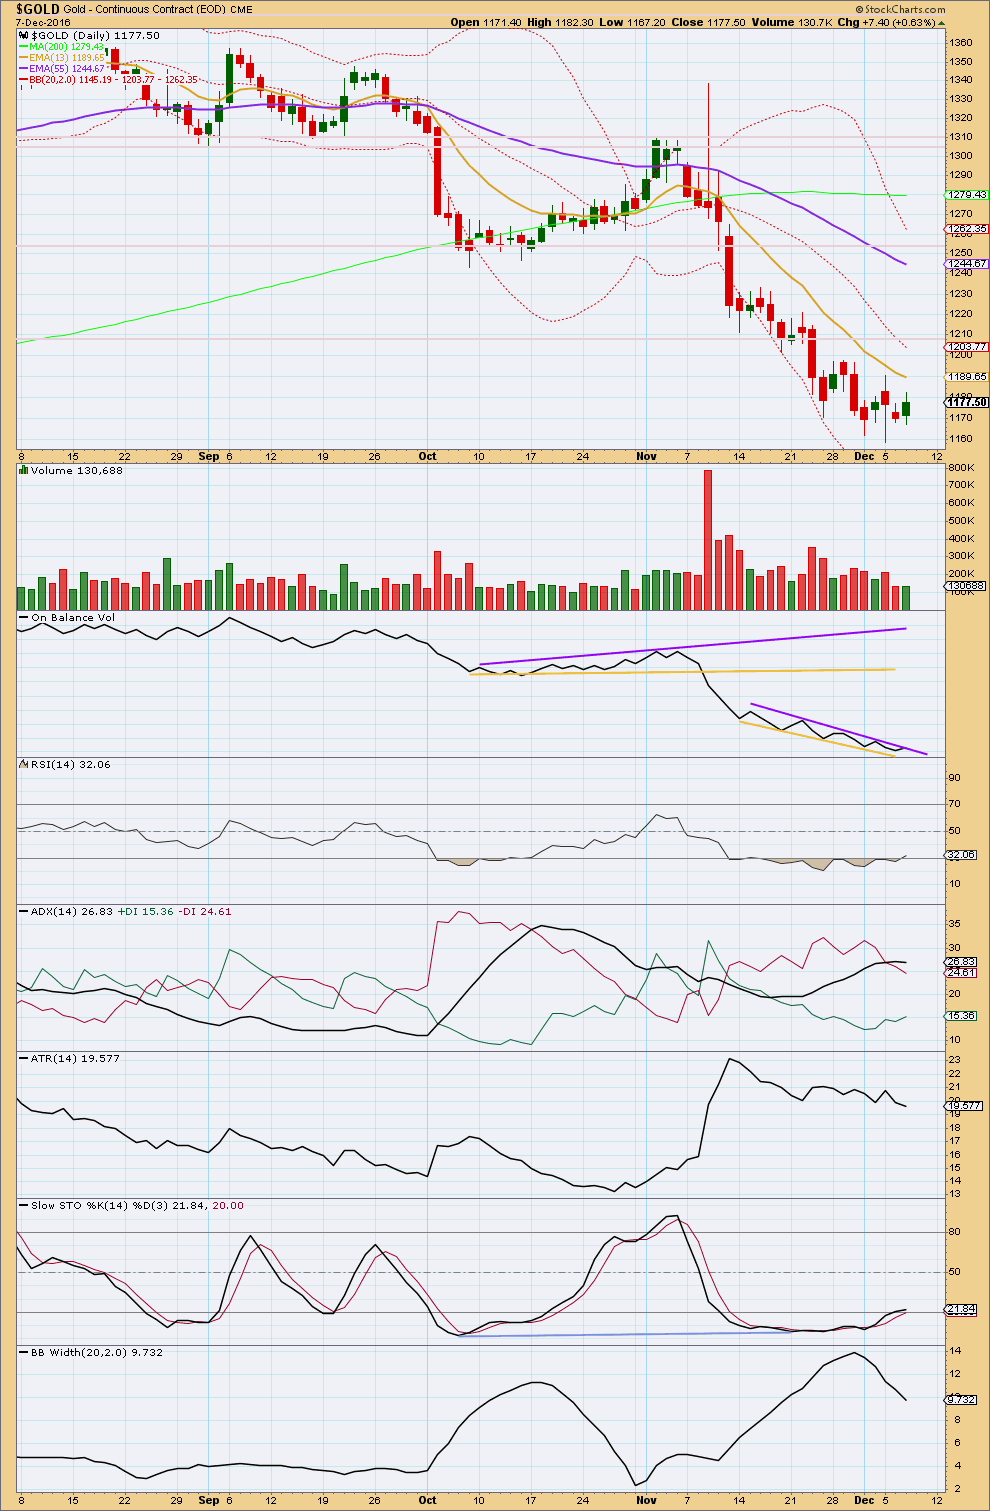
An outside day closes higher and On Balance Volume shows the balance of volume was upwards. Volume today is slightly lighter than the prior day. The rise in price did not have support from volume, so it should be viewed with suspicion. This supports the new second alternate Elliott wave count over the main Elliott wave count.
On Balance Volume is today finding resistance at the purple trend line, which has been slightly redrawn today. This line has some reasonable slope, is tested at least three times prior, and is not very long held, so it has only some small technical significance. A break above this trend line would be a small bullish signal. A break below the yellow line would be a small bearish signal.
ADX is today slightly declining, indicating the market is no longer trending, but has not yet indicated a trend change because the -DX line remains above the +DX line.
ATR is still flat to slightly declining. Bollinger Bands are still contracting. Tt is clear today that the market is consolidating.
The consolidation should last long enough to bring both RSI and Stochastics comfortably back up from oversold conditions.
This classic analysis today fairly strongly supports the second alternate Elliott wave count over the main Elliott wave count. If price movement continues to support the alternate for one or two more sessions, then they should be swapped over. It would be my judgement that the second alternate Elliott wave count is about 60% likely, the main wave count about 35% likely, and the first alternate only about 5% likely.
GDX DAILY CHART
Click chart to enlarge. Chart courtesy of StockCharts.com.
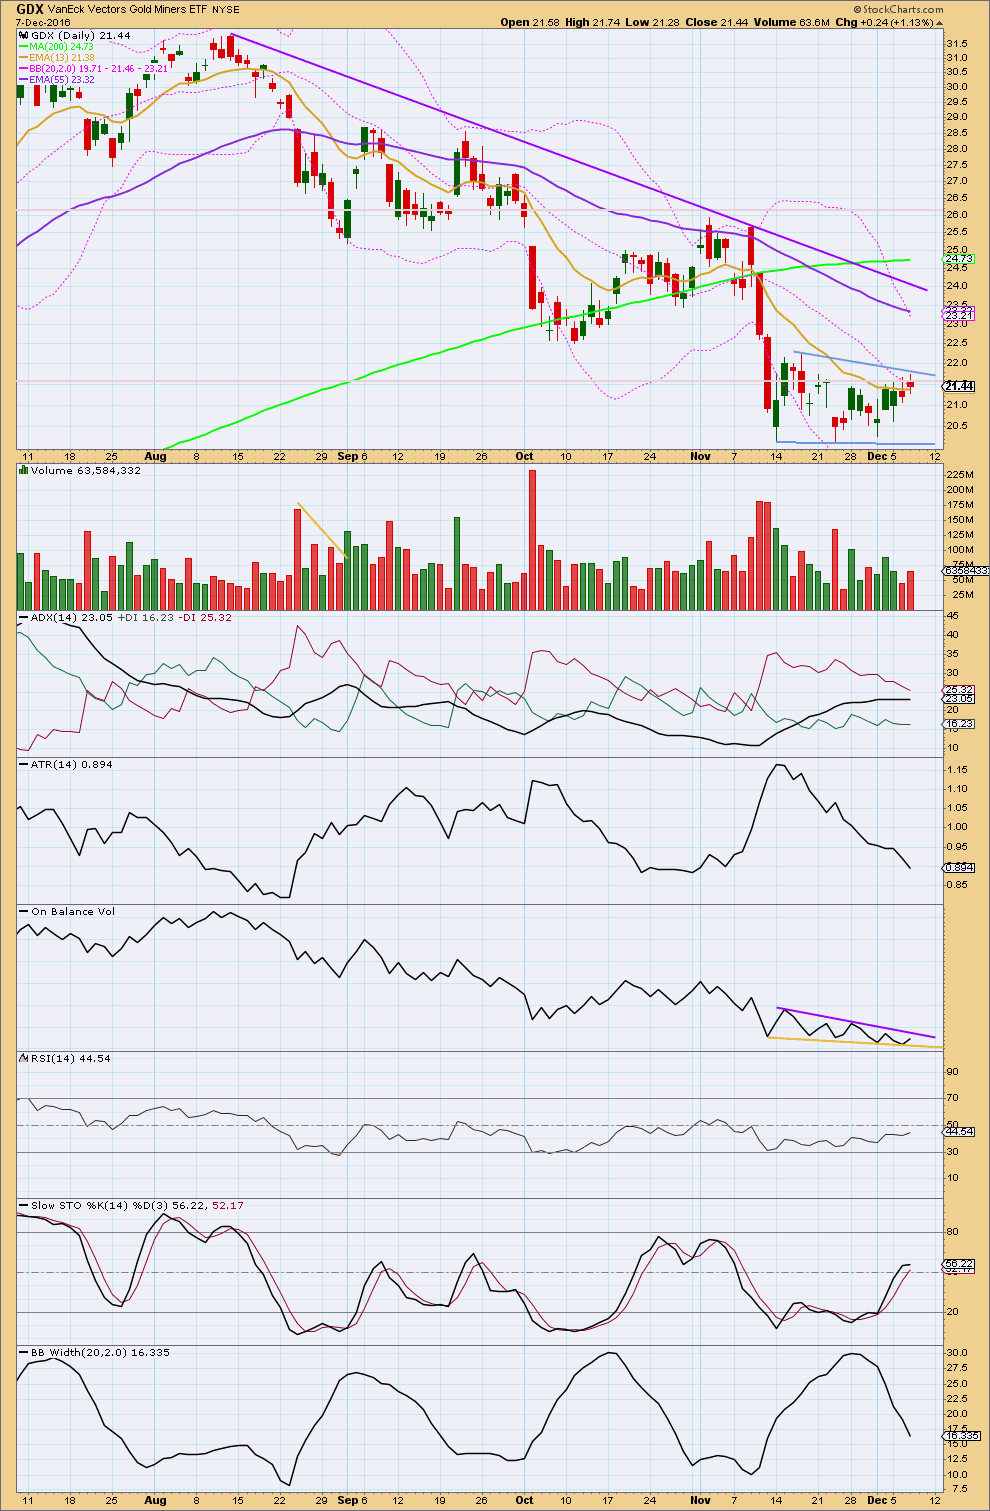
Price is moving essentially sideways and is range bound for GDX. Resistance is about 22.25 and support is about 20.15. During this range bound period, it is the downwards day of the 23rd of November that has strongest volume (ignoring the first day of the 14th of November) suggesting a downwards breakout may be more likely than upwards. This technique often works for Gold (not always). It remains to be seen how reliable it is for GDX.
ADX today has slightly declined. ATR is clearly declining. Bollinger Bands are clearly contracting. Price is consolidating. This market is not currently trending. A bear flag pattern may be forming, delineated by blue trend lines. This is a continuation pattern. It is supported by declining volume.
Using the measure rule, a target of about 14.50 would be expected. First, to have confidence in this target, a downwards breakout needs to be seen below the lower blue trend line. If this is accompanied by a spike in volume, it would be given more weight. But note that for a downwards breakout stronger volume is not always necessary as the market may fall of its own weight.
Overall, this GDX analysis is in line with the second alternate Elliott wave count for Gold spot price.
This analysis is published @ 08:06 p.m. EST.

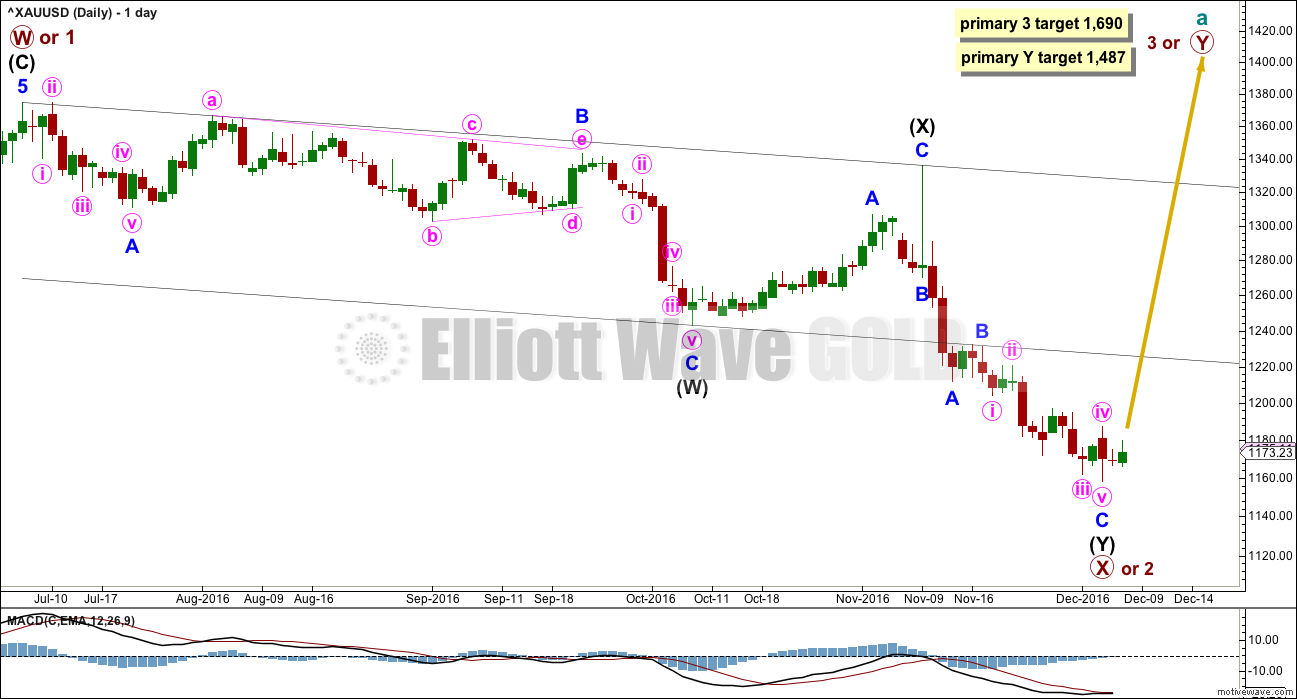
It’s time to swap the wave counts over today. Price is not behaving as it should for the main wave count, and it is for the second alternate.
This will now be the main hourly wave count. Choppy overlapping movement for a few days to up to three weeks, a consolidation to resolve oversold conditions which will then allow price to fall further.
Yep. I don’t think an interim low is in as yet. The long term chart of the miners still looking quite weak imo. As much as I dislike the prospect, I am starting to think that price action is suggesting the coming bounce is going to end up being a great shorting opportunity. What makes this particularly counter-intuitive is that I think we have already had a long term top put in the dollar so one would ordinarily expect that to be bullish for Gold. Price action is what it is.
The ECB continues to pump money into the European economy. Based on that, the $USD may not have topped yet. Hard to bet against the central banks.
Hi, is anyone else having trouble accessing the Stockmarket site?
Do you mean Lara’s EWSM? It is OK now.
Sometimes I encounter this problem too. Around 5 to 7, the Gold and/or S&P websites would be inaccessible. Probably maintenance of some sort.
That’s not good. I am not encountering the problem, and we’re not doing any maintenance on them that regularly that should take the sites down.
When the site is down my email for that one is down too… so you can’t email me to tell me 🙁
If one is down and the other is up then the other email will work. My email is admin @ website name. Cesar’s is webmaster @ website name.
GDX movement has been very choppy and may be in for another small move down for the next 2-3 days based on the pattern in play. That said, I’m expecting mostly sideways, consolidating movement up until the Fed meeting next week.
Thanks to Stephen K for the callout.
Let’s take a look back to Dec 2015 when the Fed first raised rates on 12/16/2015.
Gold actually bottomed 9 days prior to the rate increase. If Gold just bottomed again on Monday, that would be 7 days prior to next Wednesday’s Fed statement that will likely include another rate increase. The market often rhymes, and therefore the bottom may be in for Gold.
GDX, on the other hand bottomed 21 days after the last Fed increase. GDX has looked stronger than gold recently, so this may not repeat, but it’s something to keep in mind.
Great chart, and a great point made.
Thank you very much Dreamer for your continued sharing of excellent charts and ideas. You add much to this group.