Downwards movement was expected to start the new trading week, but this is not what happened.
Summary: Resistance on On Balance Volume and the 200 day moving average may be enough to turn price here down. In the short term, a new low below 1,252.75 would add a little confidence in a pullback continuing lower. The target is at 1,230.
If price makes a new high above 1,264.46, then the idea of a correction already underway will be discarded based upon a very low probability.
New updates to this analysis are in bold.
Last weekly charts are here and the last video on weekly wave counts is here.
Grand SuperCycle analysis is here.
MAIN ELLIOTT WAVE COUNT
DAILY CHART
This daily chart will suffice for both weekly charts.
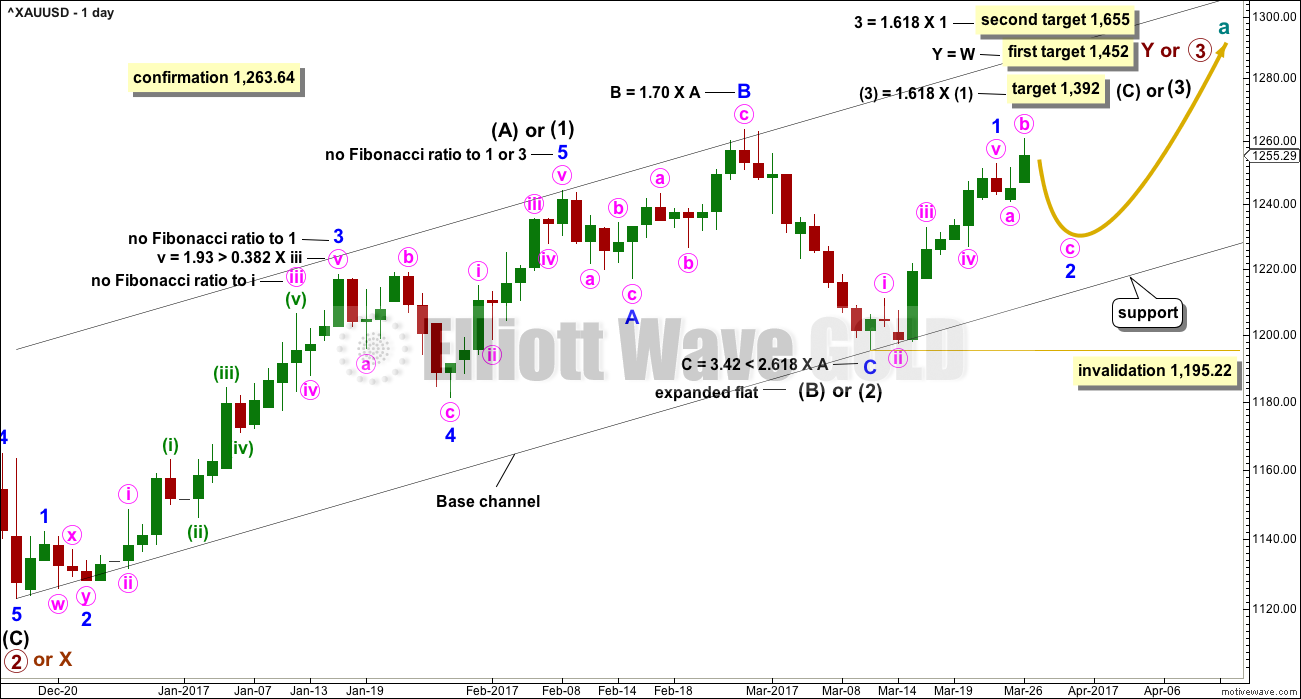
Upwards movement is either a third wave (first weekly chart) to unfold as an impulse, or a Y wave (second weekly chart) to unfold as a zigzag. If upwards movement is a zigzag for primary wave Y, then it would be labelled intermediate waves (A) – (B) and now (C) to unfold.
Intermediate wave (1) or (A) is a complete five wave impulse lasting 39 days. Intermediate wave (2) or (B) looks like an expanded flat, which is a very common structure.
So far, within intermediate wave (3) or (C), the first wave up for minor wave 1 may be complete. Minor wave 2 may unfold lower. Minor wave 2 may not be a very deep correction because the strong upwards pull of a big third wave may force it to be more shallow than otherwise. However, if it is relatively deep, it may find support at the lower edge of the base channel and may offer another opportunity to join the upwards trend.
Minor wave 2 may not move beyond the start of minor wave 1 below 1,195.22.
HOURLY CHART
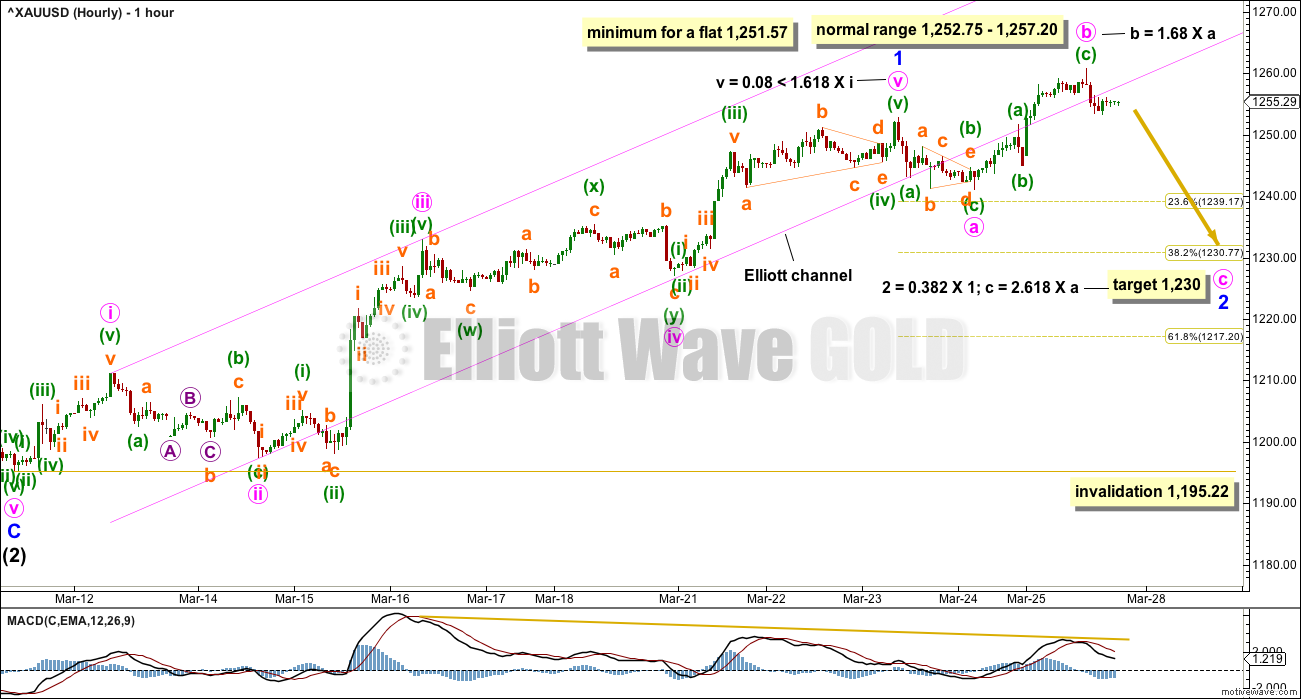
Almost all of minor wave 1 fits neatly within the Elliott channel (pink). The breach of the channel by downwards movement labelled minute wave a indicates minor wave 1 was over and minor wave 2 should be underway.
Minor wave 2 may be any corrective structure except a triangle. At this stage, it looks like it may be unfolding as an expanded flat correction, which are very common structures. Within minor wave 2, minute wave b is now a little longer than the common length of minute wave a, but is less than twice the length of minute wave a. If upwards movement continues above 1,264.46, then the idea of an expanded flat continuing should be discarded based upon a very low probability.
A new low short term below 1,252.75 would invalidate the alternate hourly wave count below and provide a little confidence in this main wave count.
The target for minute wave C is calculated at two degrees and both yield exactly the same price point. This has a reasonable probability.
Minor wave 1 lasted 9 days, 1 longer than a Fibonacci 8. So far minor wave 2 has lasted 2 days. If it continues for 3 more, it may total a Fibonacci 5, and that would give the wave count good proportions and the right look.
ALTERNATE HOURLY CHART
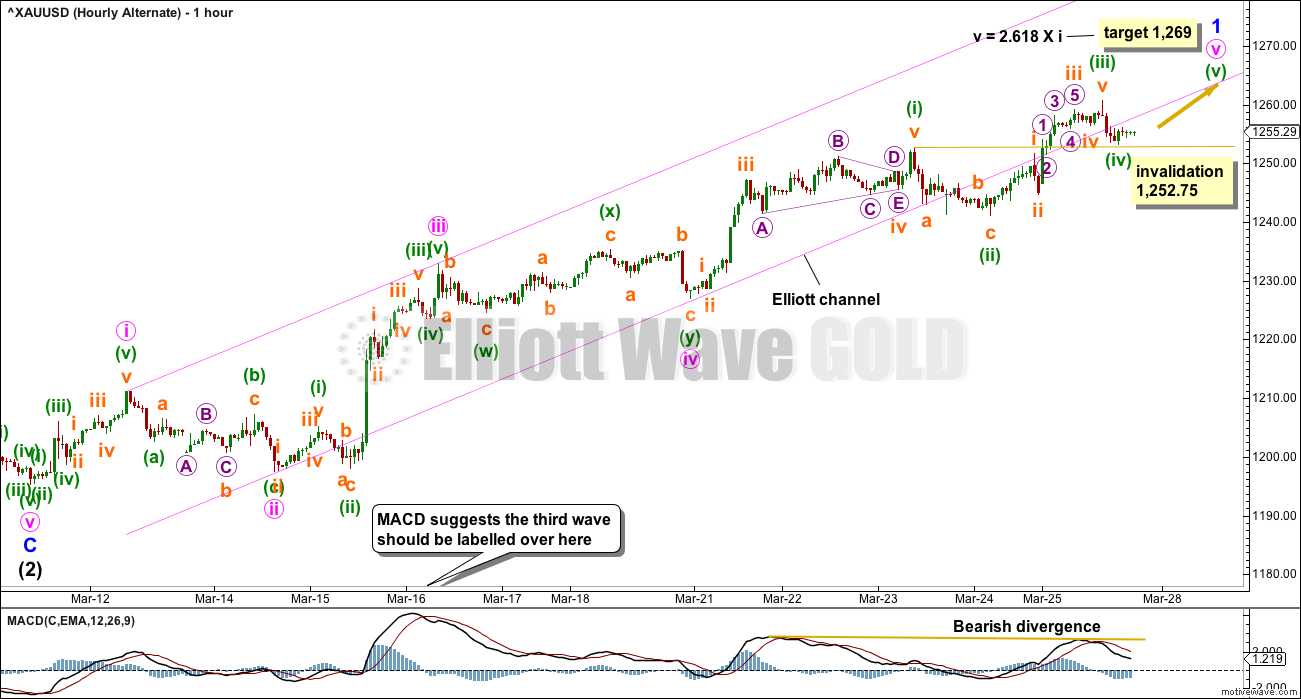
What if minor wave 1 is not over and today’s upwards movement is an extension of minute wave v within it?
If minute wave v is extending, then the middle of it may have ended at today’s high. Minuette wave (iv) may not move back into minuette wave (i) price territory below 1,252.75.
The breach of the Elliott channel gives this wave count the wrong look. Fifth waves should not breach channels like this.
There is now double bearish divergence at highs between price and MACD at the hourly chart level. This indicates weakness that may be seen for either wave count. It does not indicate which wave count is more likely, only that upwards momentum is weakening.
ALTERNATE ELLIOTT WAVE COUNT
DAILY CHART
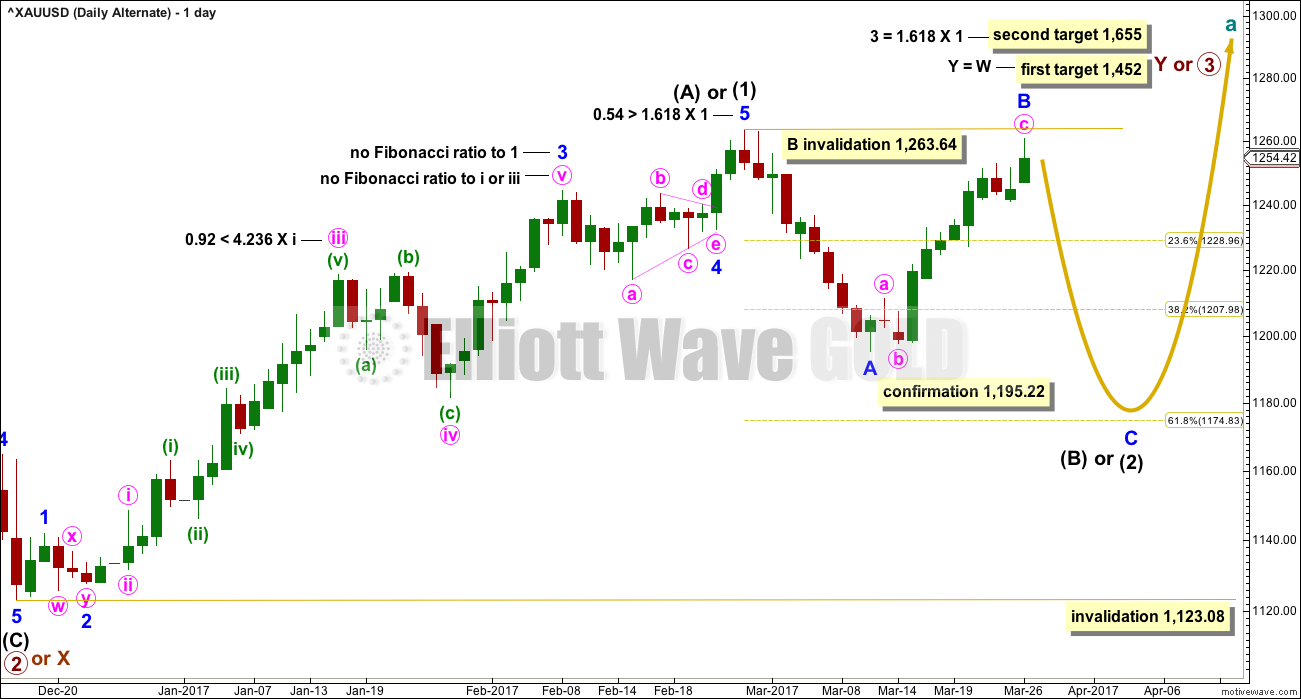
This alternate wave count is in response to queries from members.
Fibonacci ratios are noted on both daily charts, so that members may compare the main and alternate wave counts. This alternate wave count has slightly better Fibonacci ratios. This gives this wave count a reasonable probability. Due mostly to volume, this wave count is judged to have a lower probability than the main wave count.
At this stage, this wave count would be considered confirmed if price makes a new low below 1,195.22. At that stage, the target for intermediate wave (2) or (B) to end would be the 0.618 Fibonacci ratio of intermediate wave (1) or (A) at 1,175.
At the hourly chart level, this alternate wave count would now have to see the structure differently from the main wave count. Minor wave B must be a zigzag; it cannot be seen as an impulse. This is problematic because the upwards movement looks very strongly like a five on the hourly chart. This wave count would be forced now. The probability of it has further reduced.
TECHNICAL ANALYSIS
WEEKLY CHART
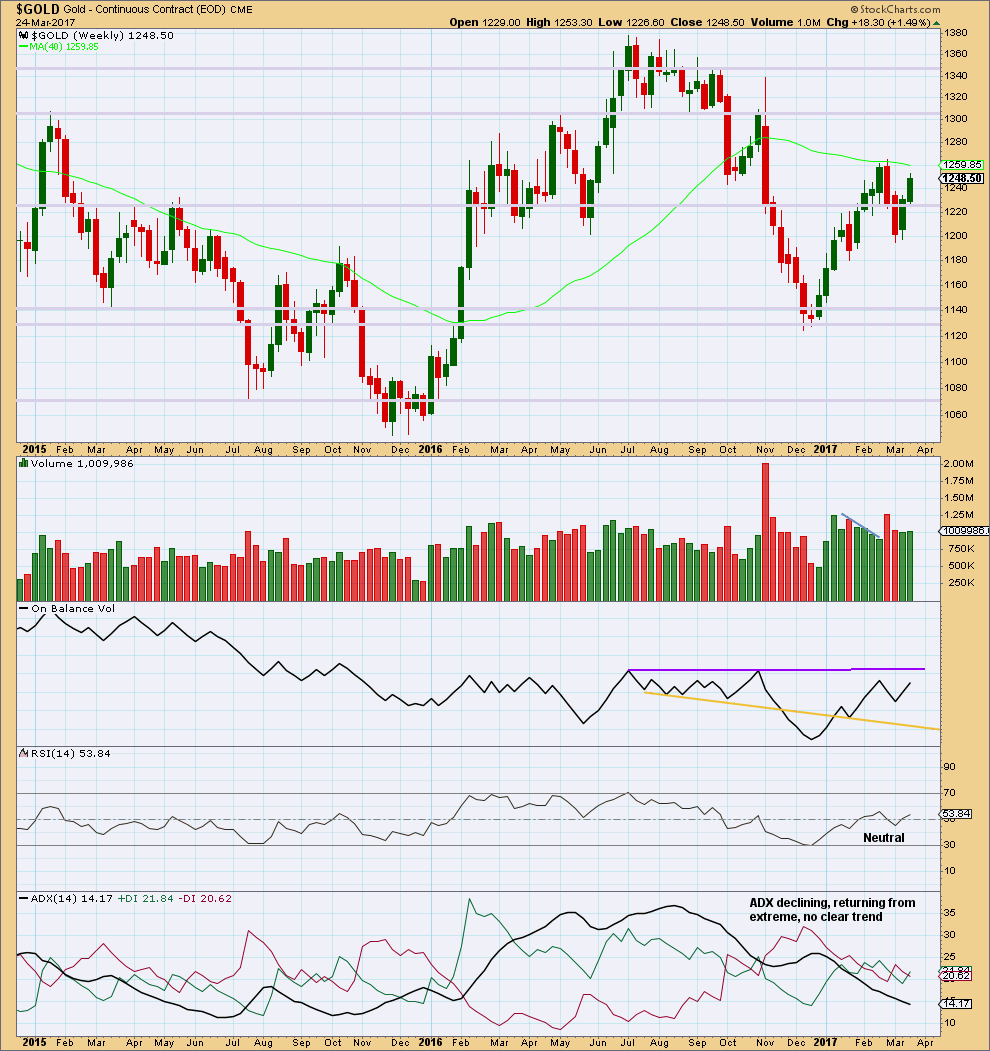
Click chart to enlarge. Chart courtesy of StockCharts.com.
Last week saw price move higher with a small increase in volume. Overall, the rise in price has some support from volume and this supports the main Elliott wave count, which saw it as the end of a first wave up.
On Balance Volume is not close to resistance, so it gives no signal.
ADX has now been pulled right down from extreme. There is now room again for a longer term trend to develop.
DAILY CHART
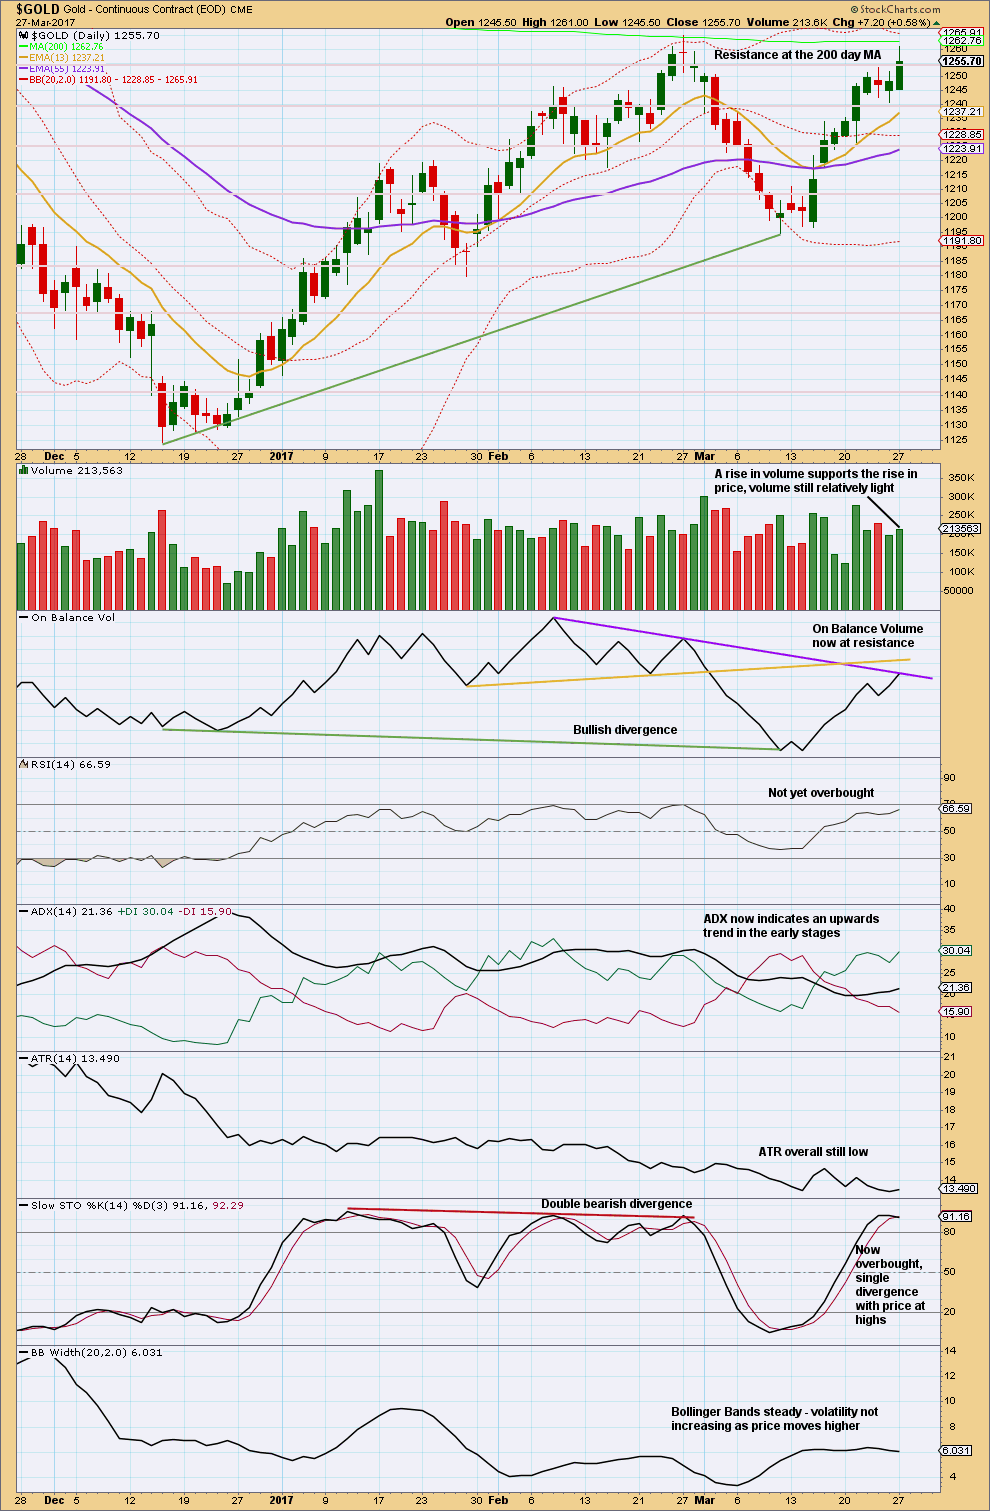
Click chart to enlarge. Chart courtesy of StockCharts.com.
The long upper wick on today’s candlestick is bearish. Price should be expected to find some resistance here at the 200 day moving average.
While volume rose today with rising price, volume remains relatively light so far for the last two upwards days. Volume is slightly bullish.
On Balance Volume at resistance should be given reasonable weight. This often works well with trend lines.
Single divergence between price and Stochastics while Stochastics is overbought, flat ATR, and steady Bollinger Bands support the main hourly Elliott wave count.
GDX
DAILY CHART
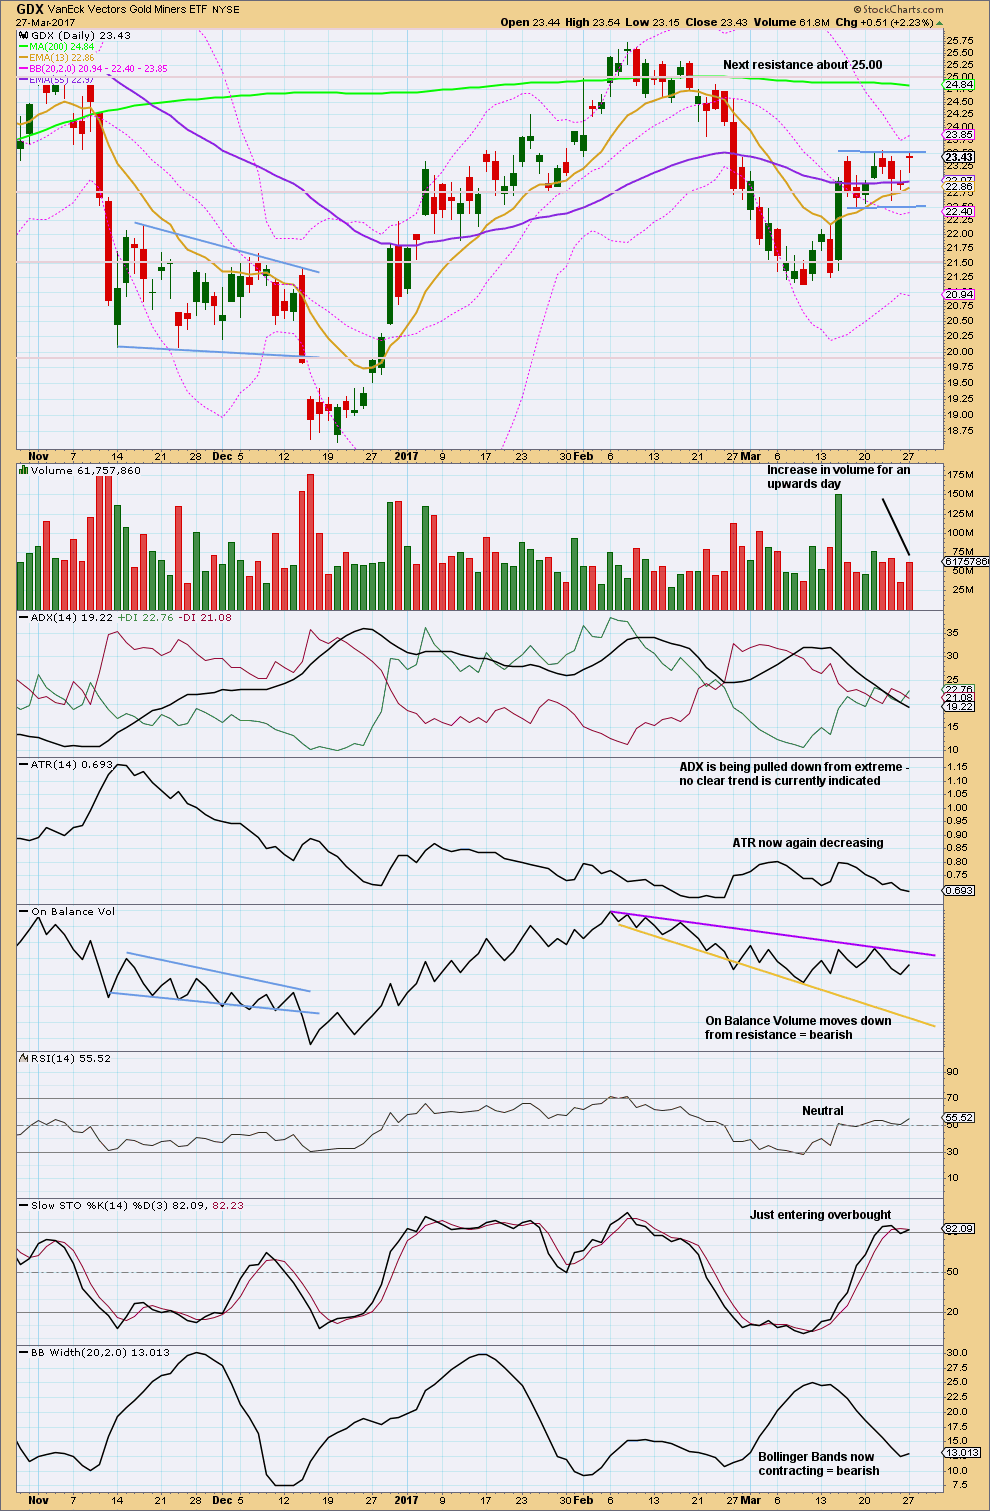
Click chart to enlarge. Chart courtesy of StockCharts.com.
GDX remains range bound. Today moved price higher and the balance of volume was up (this shows some increase).
During the range bound period, it remains an upwards day which has strongest volume suggesting an upwards breakout is more likely than downwards.
This analysis is published @ 07:02 p.m. EST.

Hello Lara. I trade gold, crude, and copper. I wasn’t sure if you covered copper here as well, or not??? Impressed so far 🙂 Hope to be a long term client!
Mark
“kyle45640@hotmail.com”
I watch Copper daily and post if I think it has a good trade set up in Trading Room. Oil is done at least once a week, more often if again I see a set up for Trading Room.
Anybody watching the after hours move in Silver?
Man that thing is acting bullish! Yikes!
The SLV candle morphed from a gravestone into a regular doji. Looks like we get the big move down overnight. Sneaky!
I think it is going to be over before you can say “Wazzat?” 🙂
Hourly chart updated:
The alternate was quickly invalidated.
Now expecting two or five days of downwards movement to the target 1,230.
Minor wave C must be a five wave structure, so far it looks like it’s unfolding as an impulse, that ‘s the most likely structure.
The base channel is used to do a couple of things: the upper edge should provide resistance for lower degree second wave corrections along the way down. When the channel is breached it supports the idea of a third wave down unfolding, we have that now. Once the lower edge is breached it should now provide resistance, minuette (iii) should remain and end below this trend line.
Once price starts to find resistance at the lower edge of the base channel then I’ll redraw it as an acceleration channel.
Looks like five down in Silver….now for a three wave bounce…
I think we are going to get a stampede for the door of short positions in the not-too-distant future. I think Silver in particular is poised to detonate to the upside…
Silver detonate to upside?
Lara says gold has 2-5 down days ahead and silver has moved ahead of gold to upside. How can this translate to silver detonating up?
Verne–I bow to your expertise so am sincerely perplexed how silver is ready to detonate up?
Lara is right. The detonation I think will take place AFTER the current move down is complete. Sorry about the confusion; I am just very excited about what comes next….I am actually holding SLV 17.50 puts I loaded today… 🙂
Thanks. I was wondering if I had lost my mind!
LOL
No, hang onto your hat 🙂
Gravestone doji on SLV.
Any projections for the depth of the retrace?
On daily? I don’t see on my broker.
Yep. Of course that candle could change by the close…so far upper wick still visible…
I think the low and the open are too far apart for a Gravestone Doji to form
Decent move in /Dx today
SLV had two gaps up today and Monday. GLD has already made the turn so SLV should not be too far behind. How deep??!!
I cashed in my NUGT 10.50 puts today and picked up some SLV 17.50 puts to remain hedged for the move down. I think it is going to be short, sharp, and sweet to co-incide with the current counter-trend bounce in SPX…..here come the banksters….!!!
The one thing bothering me the most about this rally is the gold stocks are about 10 percent off where they were when gold was at 1260 in feb. usually they lead, so they are sensing trouble or waiting for a breakout. Odd.
Great point. Miners led the December rally. Then led again going down in Feb before the metal turned south.
Lara,
Minuette (iii) of Minute C down now?
Hi Lara,
the wave 4 in the USD Index looks very disproportionate to wave 2?
Yes, it does.
I have an alternate. This may be better.
I haven’t looked at all the Fibonacci ratios yet, but that’s not necessarily going to help.
These USD Index wave counts still need work, I have not looked deeply enough yet at the detail. Once that’s done and I think I have a handle on it, then I’ll publish it as a full analysis.
It certainly is looking like a top is in, is it not? 🙂
Silver is on a tear!
New Oil ETF’s. Might interest aggressive traders, but need to wait for them to build up some volume first.
Looks like bear flags on Gold, GDX, & GDXJ. Looking for strong 3rd waves down tomorrow.
Someone asked about USD Index.
If that lower trend line is correct and provides support, that’s it for USD index. As USD index moves higher, Gold should move lower. At least for a while.
However, fort the mid to longer term one of the wave counts (USD or Gold) is probably wrong. Not necessarily, but probably. Which is the main reason why I won’t add USD Index to Trading Room recommendations today.
thanks for the USD analysis
GDX
https://www.tradingview.com/x/lwztnCxb/
A good looking wave count. Thank you very much Dreamer.
Looks like the miners may lead again here… no new high for GDX today is interesting.
As always Dreamer, your chart work (along with Lara’s of course) on GDX and GDXJ have proved invaluable and accurate. I closed my short positions when GDXJ made its new lows with a great profit.
Now if we’re going to be in a 3rd way up at 2-3 degrees, the miners should flatten out or even go higher in choppy trading while gold/silver correct in their minor 2.
Congrats on your trade!