S&P 500 Grand Super Cycle Elliott wave analysis.
Summary: From last analysis two wave counts are published. The main wave count remains valid. The alternate bearish wave count is not invalidated but should be now discarded due to a very low probability.
MAIN WAVE COUNT – BULLISH
YEARLY CHART
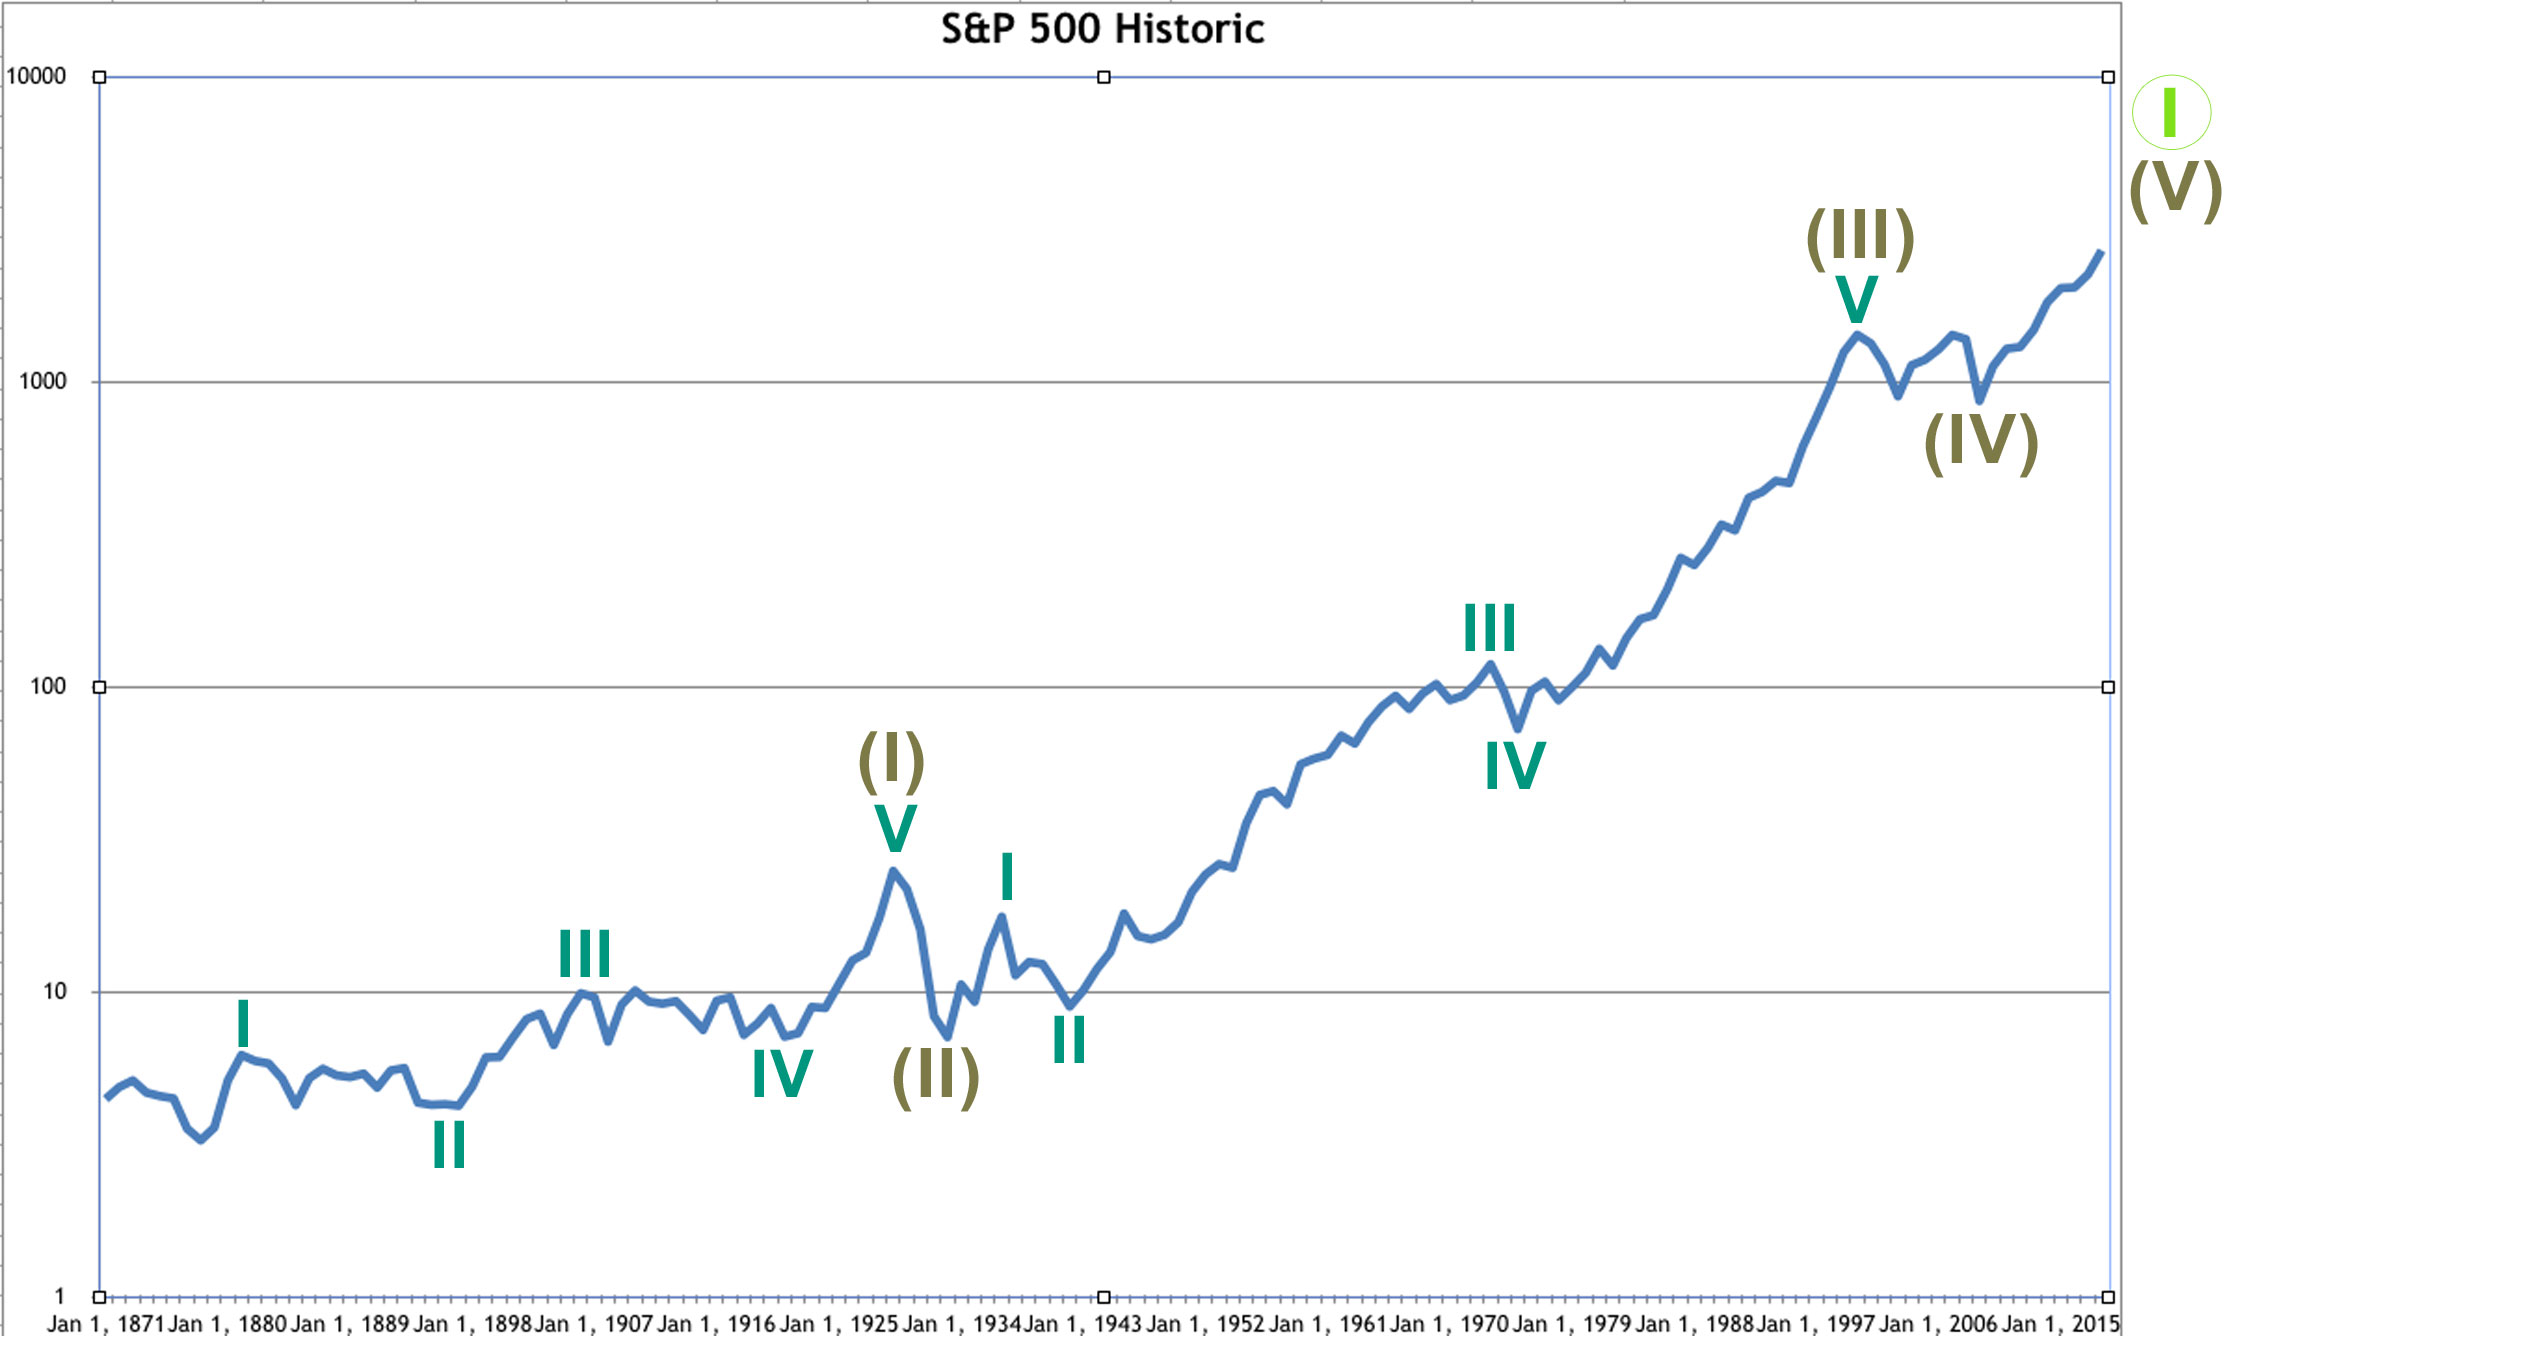
The data prior to the inception of the S&P500 index is an amalgamation of the US stock market back to that date.
There are two approaches to the S&P500 long term analysis: either look only at data since the inception of the S&P500 in 1957, or to include an amalgamation of the entire US stock market before that date as part of the analysis. I have chosen to look at the entire market.
The data I have only goes back to 1871. This bull wave count assumes up to the market peak of 1929 a five wave impulse can be counted. This may have been a Super Cycle wave (I), and the Great Depression a Super Cycle wave (II) correction. If this assumption is wrong, then the bull wave count would not work.
If Super Cycle wave (III) began at the end of the Great Depression in 1933, then it may have ended in 2000. Super Cycle wave (III) would have lasted 67 years and moved price 1,523 points.
Within Super Cycle wave (III), there are no adequate Fibonacci ratios between cycle waves I, III and V. Cycle wave II is a deep 0.82 zigzag lasting 5 years, and cycle wave IV is a shallow 0.42 zigzag lasting 2 years. There is alternation in depth cycle waves II and IV.
Super Cycle wave (II) lasted only four years (a relatively deep quick zigzag). Super Cycle wave (IV) may be over as a more shallow flat correction, lasting 8.5 years. There is perfect alternation between Super Cycle waves (II) and (IV).
This wave count expects that Super Cycle wave (V) is underway to finally end Grand Super Cycle wave I.
Both Super Cycle waves (I) and (III) look to be extended in this analysis. If this is correct, then Super Cycle wave (V) may not extend.
MONTHLY CHART
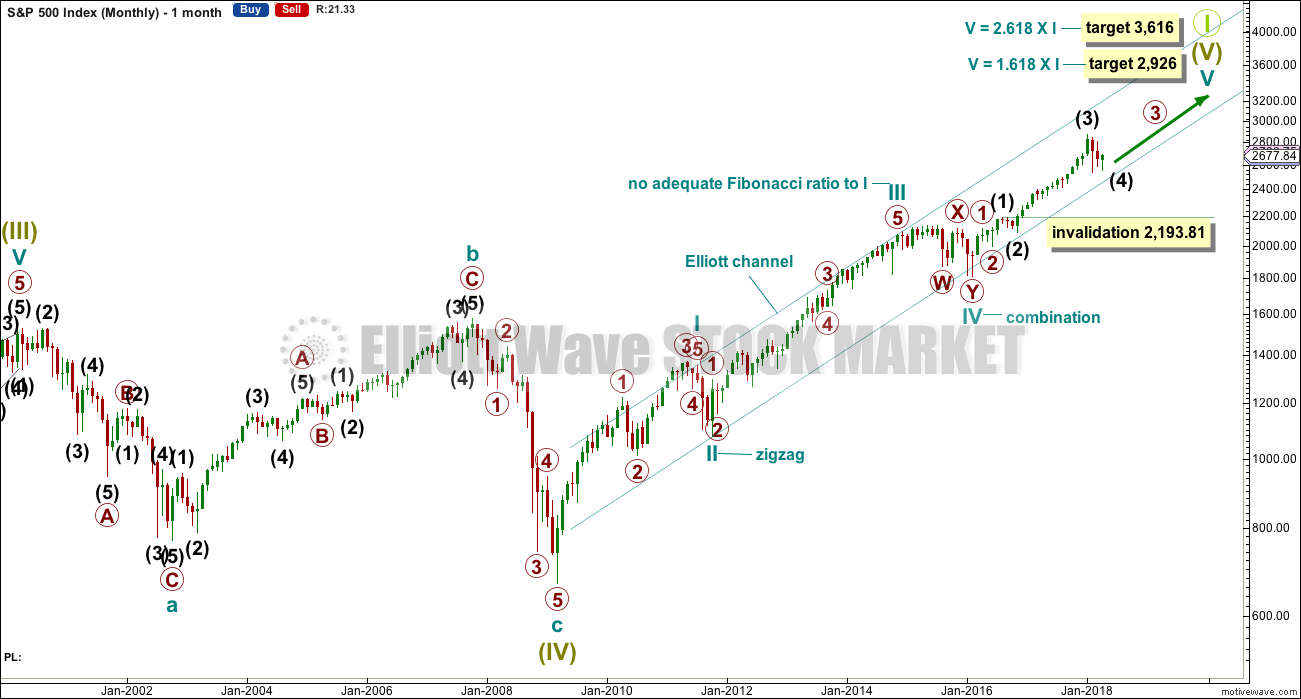
This monthly chart shows all of the possible Super Cycle wave (IV) and Super Cycle wave (V) so far.
Super Cycle wave (IV) fits as a regular flat correction, and within it cycle wave b is a 1.03 length of cycle wave a. Cycle wave c exhibits no Fibonacci ratio to cycle wave a, but it does move below the end of cycle wave a avoiding a truncation.
All subdivisions within Super Cycle wave (IV) have a good fit for this wave count. Cycle wave a fits best as a zigzag. Cycle wave b fits best as a zigzag. Cycle wave c fits best as an impulse.
Super Cycle wave (V) may be nearing completion. The Elliott channel will be important. While price remains above the lower edge of the channel, it should be assumed that Super Cycle wave (V) will continue higher. If the channel is breached by downwards movement, that may be an early indication that the upwards wave labelled Super Cycle wave (V) should be over and a new wave down should then be underway. Draw the channel from the ends of cycle waves I to III (note that cycle wave I ends with a truncation), then place a parallel copy on the end of cycle wave II. This channel was only slightly overshot at the end of cycle wave IV, but not breached. This channel has now been held for 9 years.
ALTERNATE WAVE COUNT – BEARISH
YEARLY
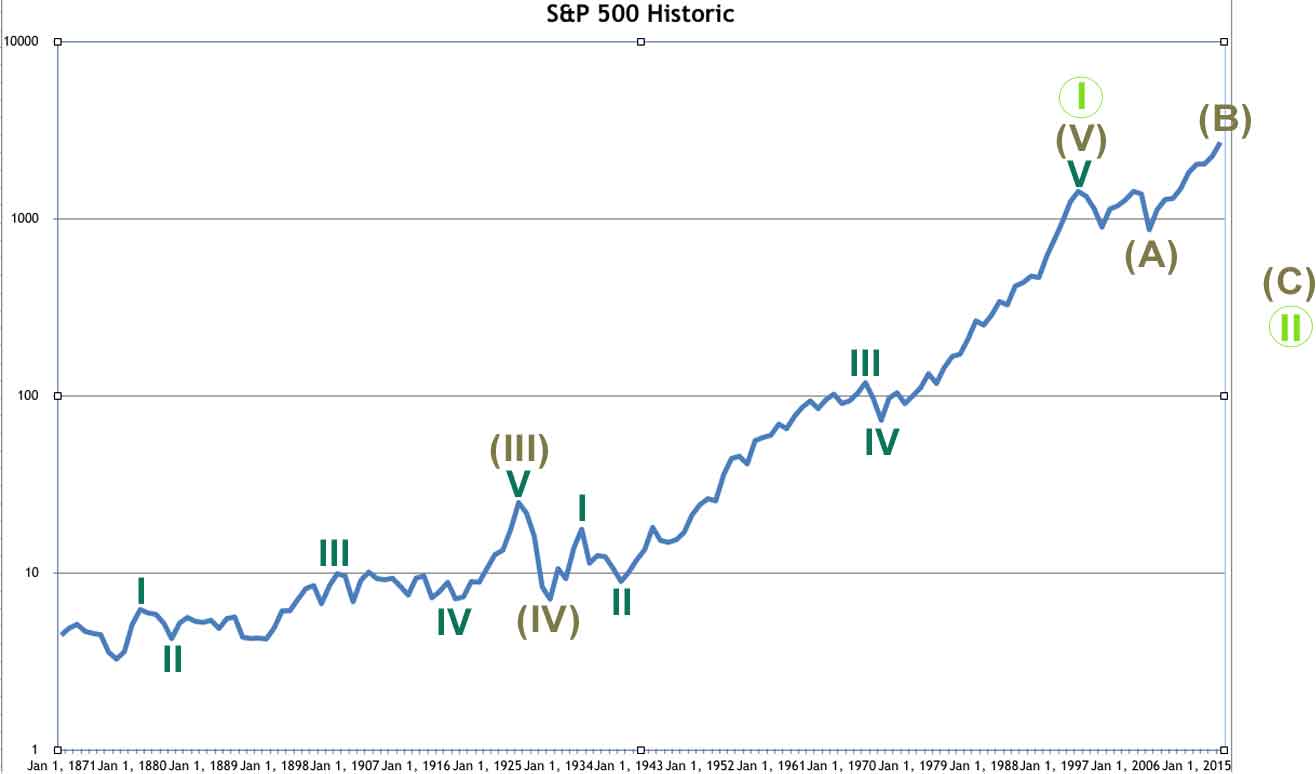
This bear wave count expects that the Depression of the 1840’s was a Super Cycle wave (II) and the Great Depression of the 1930’s was its counterpart Super Cycle wave (IV). From an historic perspective both depressions were significant, so this idea makes sense.
The rise since the end of the Great Depression in 1933 would be a Super Cycle wave (V). Which means that a Grand Super Cycle wave I may have ended in 2000.
Within Super Cycle wave (V), the subdivisions are seen in the same way as for the bull wave count. There are no adequate Fibonacci ratios at cycle degree.
If Grand Super Cycle wave II began there, then it would most likely be incomplete. Grand Super Cycle waves should last generations, not just 8.5 years. The first flat correction would most likely be Super Cycle wave (A) of an expanded flat. But it may also be Super Cycle wave (W) of a double flat or combination.
However, this wave count now suffers from a very big problem. If Grand Super Cycle wave II is continuing, then within it Super Cycle wave (B) is now well longer than twice the length of Super Cycle wave (A). At the last all time high in January 2018, Super Cycle wave (B) would have been 2.48 times the length of Super Cycle wave (A).
While there is no Elliott wave rule stating a maximum limit for B waves within flat corrections, they are most commonly between 1 to 1.38 times the length of their A waves. There is a convention within Elliott wave that states when the B wave passes 2 times the length of the A wave, the idea of a flat correction should be discarded based upon a very low probability. For this reason this wave count should now be discarded.
This analysis is published about 5:55 a.m. EST.


