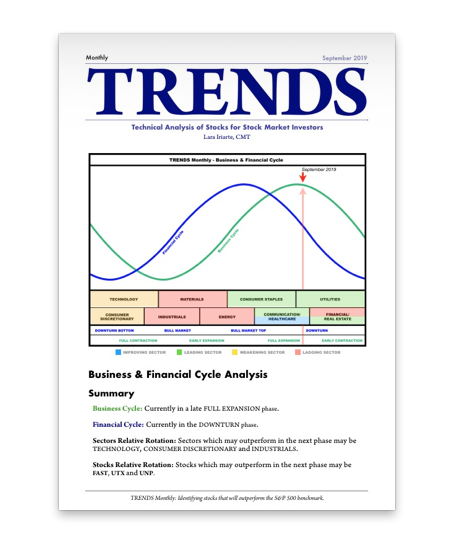
I would like to introduce to Elliott Wave Gold members my new report: TRENDS Monthly.

The TRENDS Monthly report will be published on a new website: Invysis.com.
In TRENDS Monthly I combine technical analysis with relative rotation graph analysis and macroeconomic analysis to identify stocks within the S&P 500 that show potential to outperform the S&P 500 benchmark.
And just as important, in the TRENDS reports I also identify when the outperforming stocks may have peaked and in turn may start or have started to underperform the S&P 500 benchmark.
I would like to share my first TRENDS Monthly report with Elliott Wave Gold members. The report can be downloaded here (PDF – 10MB).
Thank you.

Nice work Lara. You really do a great job with detailed analysis. Thanks for sharing this and allowing us free access until Feb 2020.
For some that want to understand all of this data quicker, moving your conclusions from page 20 up near the beginning and maybe reformatting into a more visually appealing dashboard format would be helpful.
I have hope that all your work someday will lead you to discover “the missing piece” to EW analysis which would be the ability to pick which EW count will be the correct one in advance. 🧐
Excellent.
Thank you.
Only glanced through it, but it doesn’t read too scary for the economy as yet, which means that the Gold Bear is more likely to wake up than the Gold Bull .. would you agree?
There is a wide held assumption that Gold and the Stock Market (S&P500) have a negative correlation in bear markets. That when the stock market moves into a bear market, money must flood into Gold and Gold must enter a bull market.
I don’t like assumptions. I like data.
Looking at the correlation co-efficient between these two markets, if that were true, we should see a persistent and reliable negative correlation co-efficient between the two sets of data. Their correlation co-efficient should remain below -0.5.
It does not. It fluctuates wildly from fully positive to fully negative. They appear to have no reliable correlation at all.
I know that’s an unpopular conclusion, but that is what the data says.
Even during the last bear market they did not have a correlation coefficient which remained below -0.5. It did move below -0.5 in January 2008, but moved back above -0.5 in August 2008 and then became positive above 0.5 in October 2008, while the bear market was particularly strong.