Last week expected one final fifth wave before a trend change. That is not what happened. The trend change may have already occurred.
Oil has been a frustrating market to analyse for the last month or so. I am very keen to get it right this week!
Click on the charts below to enlarge.
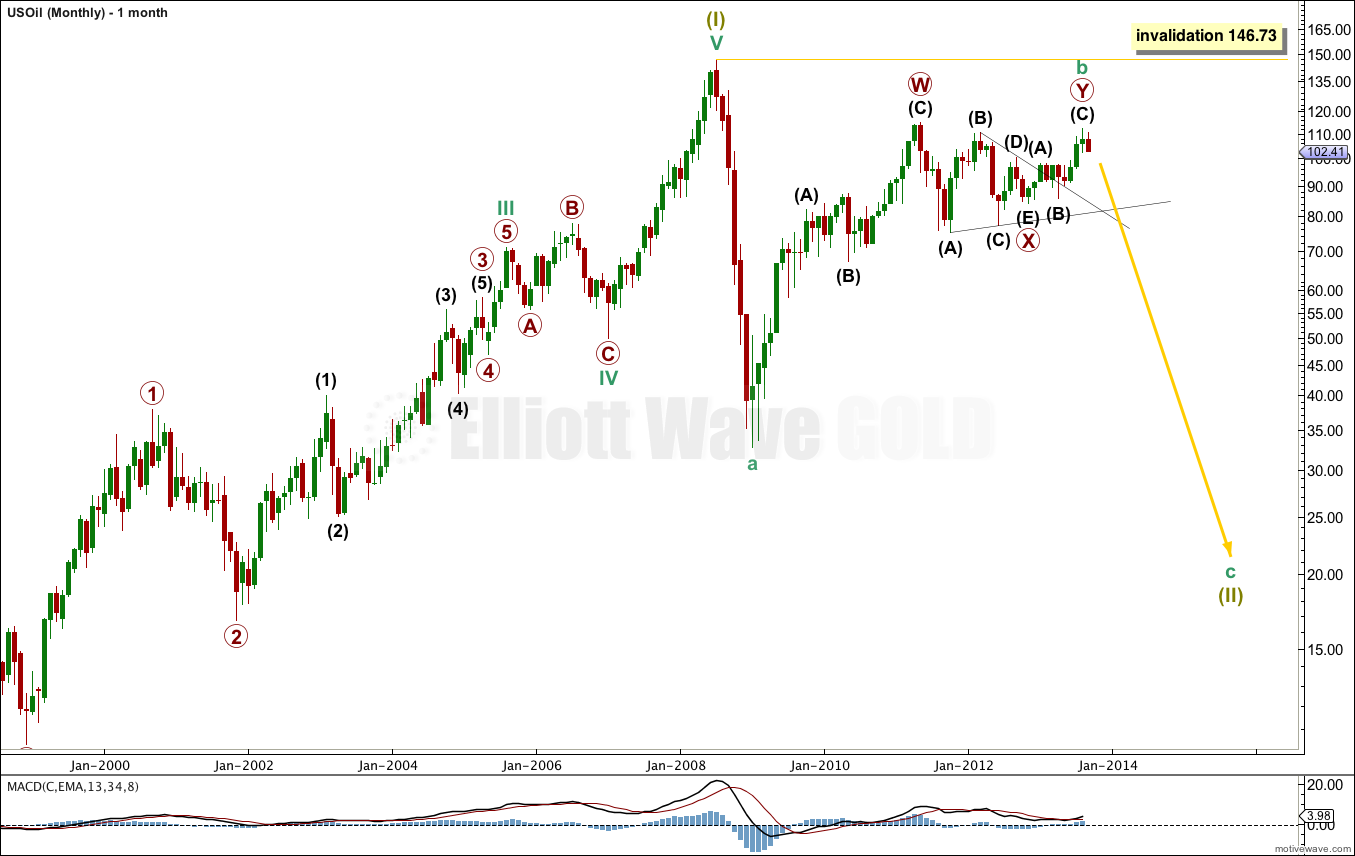
Cycle wave b may be complete already, as a double zigzag. Primary wave X within it was a contracting triangle.
Downwards movement of the last week shows clearly on the monthly chart. If this candle closes down that shall be strong indication of a trend change.
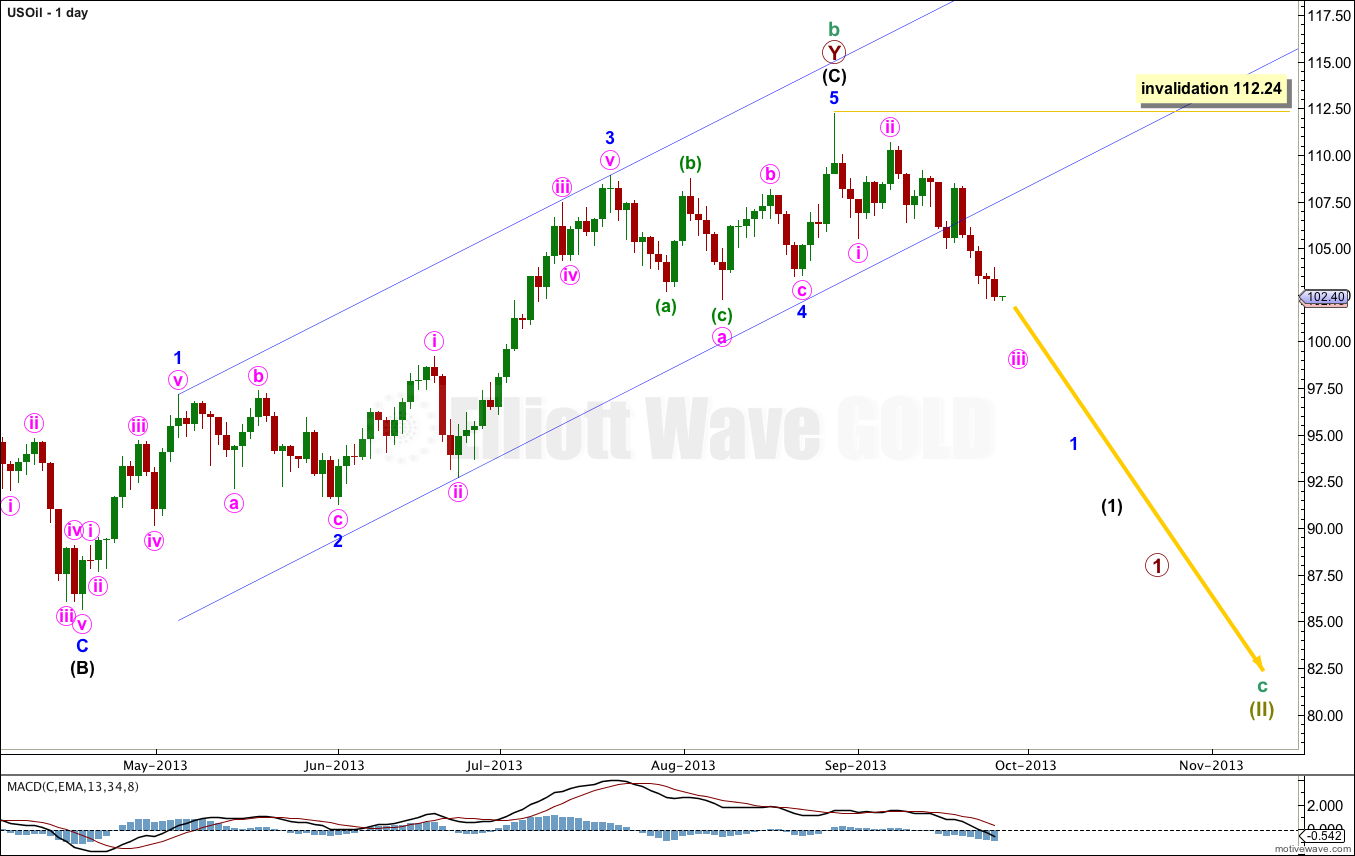
Downwards movement has clearly breached the parallel channel on the daily chart. This is strong indication of a trend change.
There is no Fibonacci ratio between intermediate waves (A) and (C).
Ratios within intermediate wave (c) are: minor wave 3 is 0.95 short of 1.618 the length of minor wave 1, and minor wave 5 has no Fibonacci ratio to either of minor waves 1 and 3.
Minor wave 4 may have been a flat correction with a truncated minor wave C.
Within primary wave 1 of cycle wave c downwards no second wave correction may move beyond the start of the first wave. This wave count is invalidated with movement above 112.24.
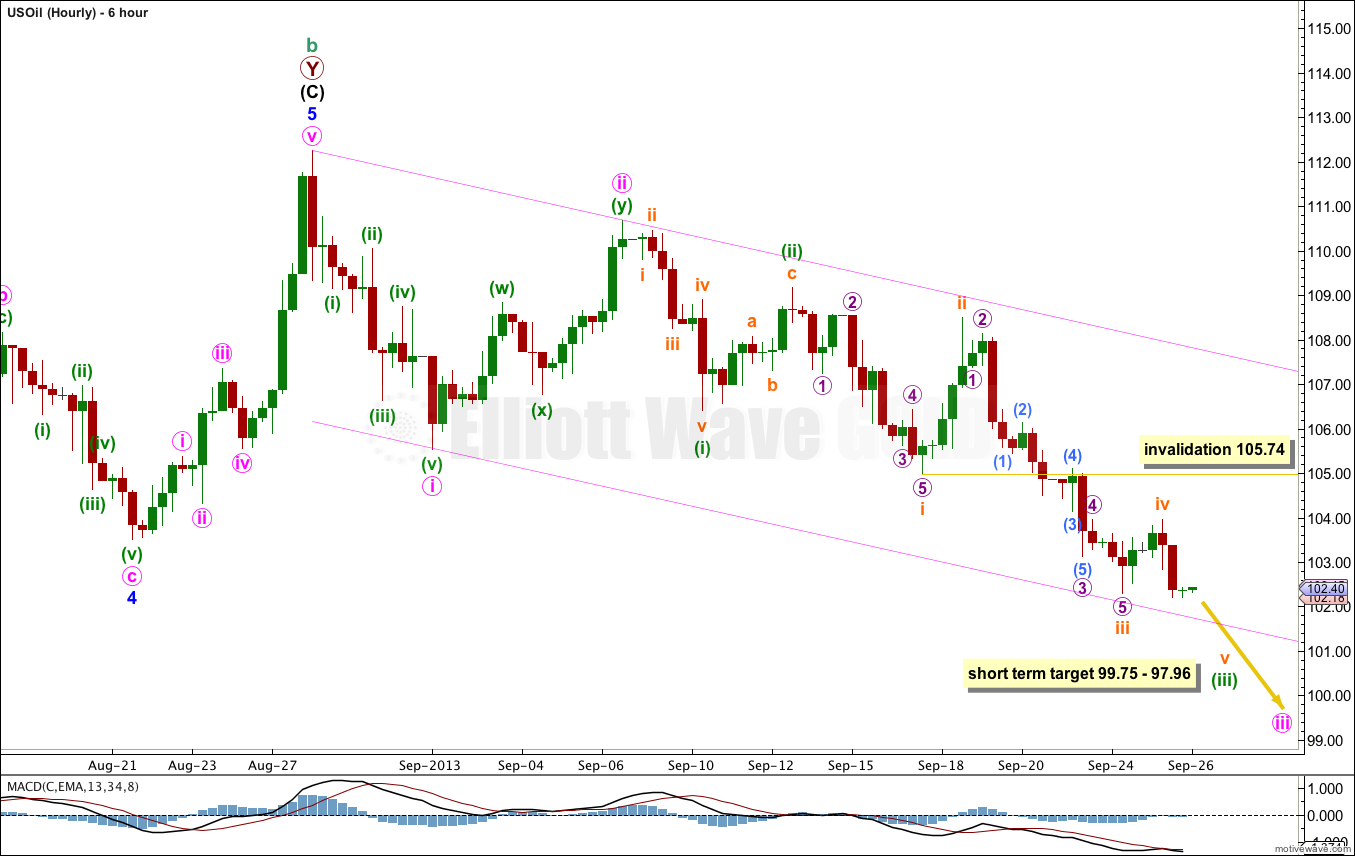
Within recent downwards movement the middle of a third wave may have just passed.
Subminuette wave iii is just 0.62 short of 1.618 the length of subminuette wave i.
At 99.75 subminuette wave v would reach equality in length with subminuette wave i. Subminuette wave i lasted 3.25 days. This target may be about three days away.
At 97.96 minuette wave (iii) would reach 2.618 the length of minuette wave (i). This gives a short term target range of 1.79.
I have drawn an acceleration channel about minute waves i through to iii. The channel should be breached towards the end of minute wave iii. When this channel is breached I will have some more confidence in this wave count.
While minuette wave (iii) is incomplete subminuette wave iv may not move into subminuette wave i price territory. This wave count is invalidated with movement above 105.74.


