
US OIL: Elliott Wave and Technical Analysis | Charts – June 12, 2020
Price has remained mostly within a channel this week, until the final session. This supports the main Elliott wave count. An alternate is discarded.
Summary: Oil may have found a major sustainable low. For the mid term, a deep multi-week pullback may have begun. The target is 21.78. When this pullback may be complete, then an upwards trend should resume with increased strength.
ELLIOTT WAVE COUNT
MONTHLY CHART
Click chart to enlarge.
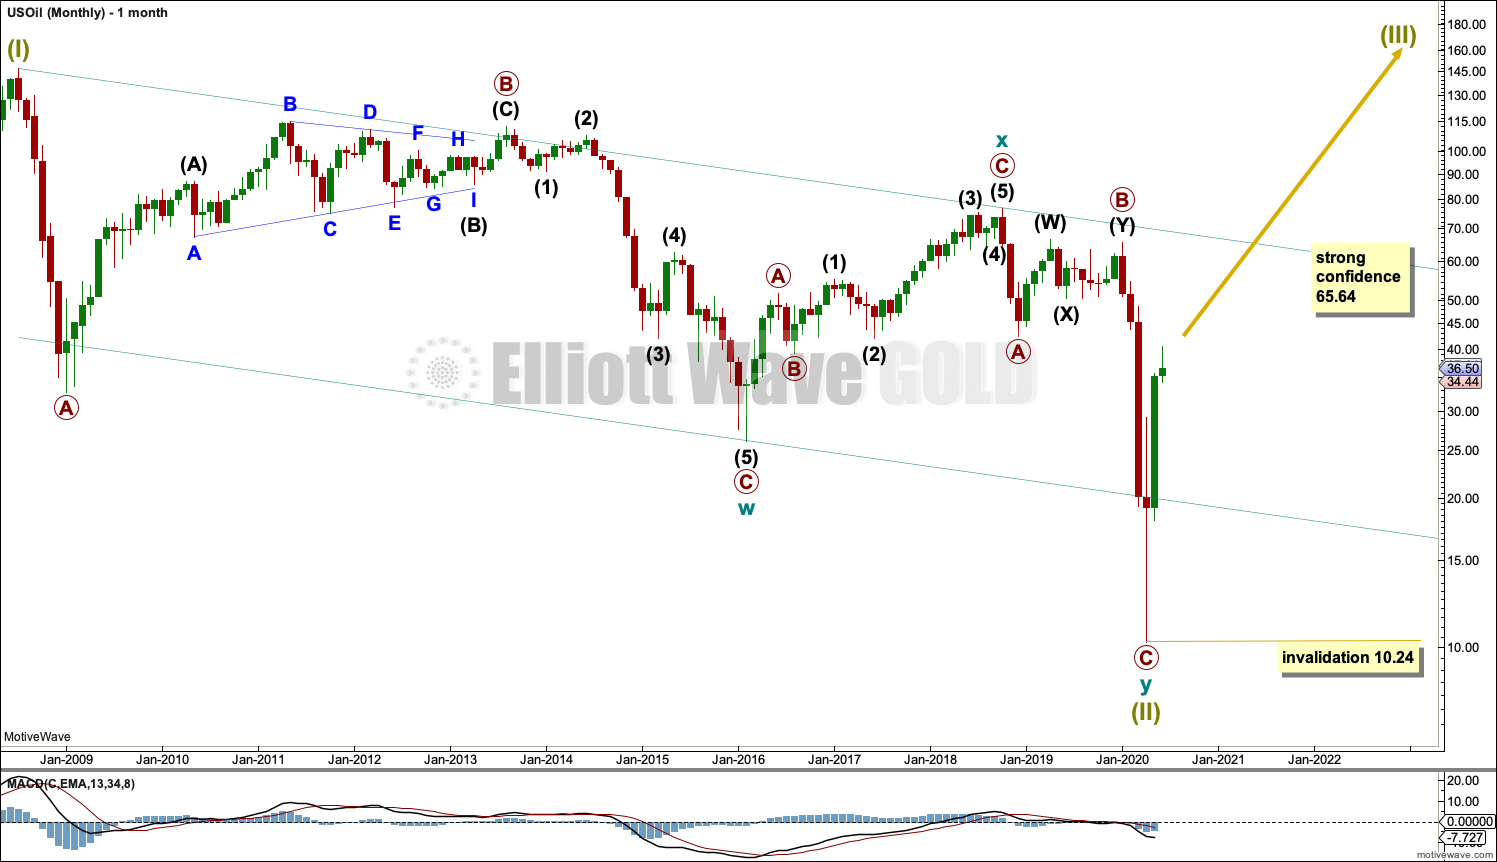
The basic Elliott wave structure is five steps forward and three steps back. This Elliott wave count expects that US Oil has completed a three steps back pattern, which began in July 2008. The Elliott wave count expects that the bear market for US Oil may now be over.
A channel is drawn about Super Cycle wave (II): draw the first trend line from the start of cycle wave w to the end of cycle wave x, then place a parallel copy on the end of cycle wave w. Price has bounced up off the channel. This trend line is breached, which is a typical look for the end of a movement for a commodity.
The upper edge of the channel may provide resistance.
Following five waves up and three steps back should be another five steps up; this is labelled Super Cycle wave (III), which may only have just begun. Super Cycle wave (III) may last a generation and must make a new high above the end of Super Cycle wave (I) at 146.73.
Super Cycle wave (III) may only subdivide as a five wave impulse. New trends for Oil usually start out very slowly with short first waves and deep time consuming second wave corrections. Basing action over a few years may now have begun.
WEEKLY CHART
Click chart to enlarge.
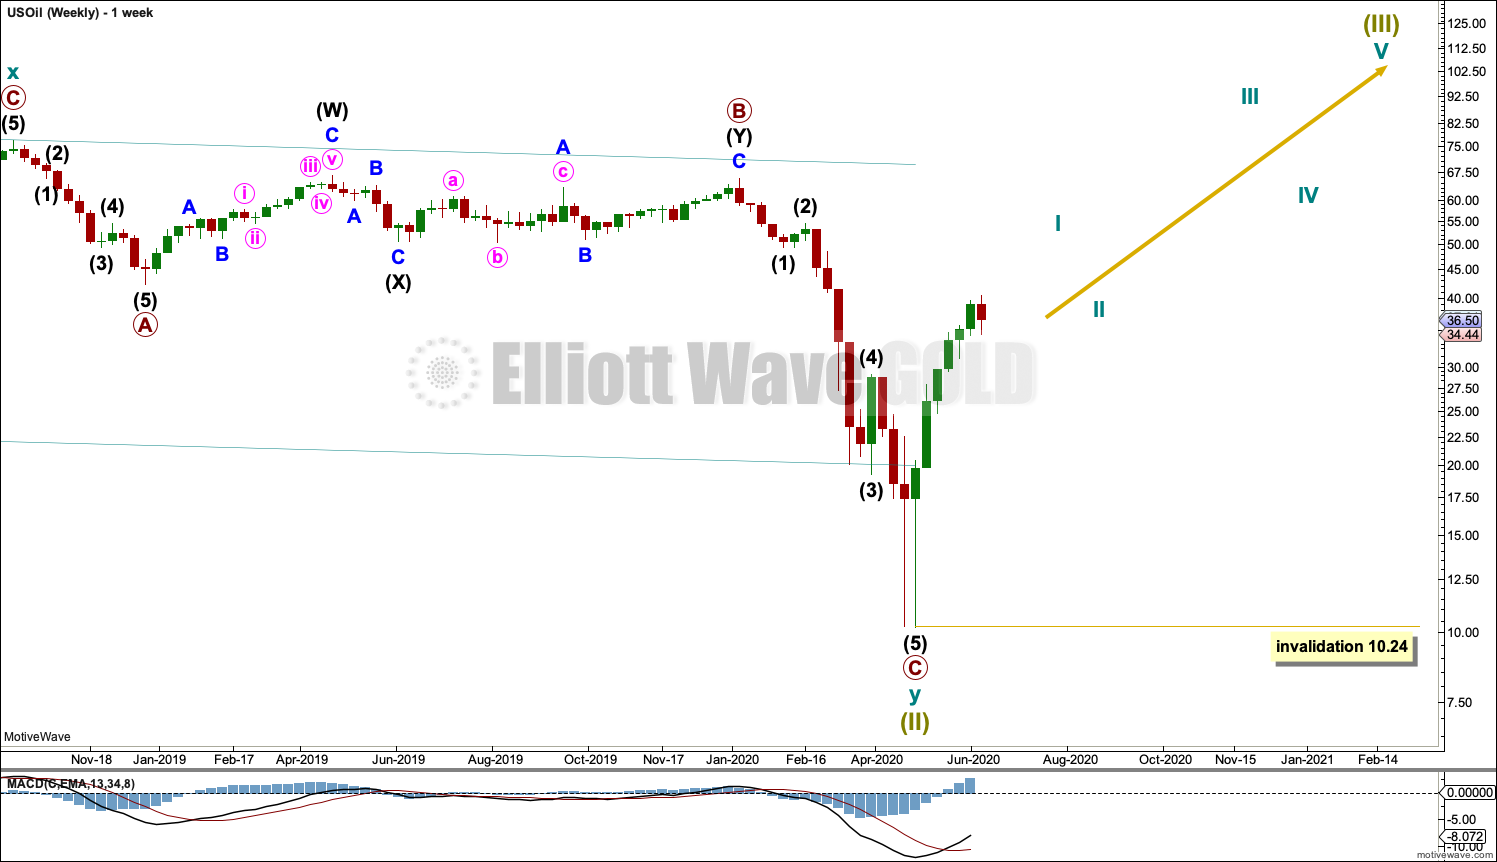
Super Cycle wave (III) must subdivide as an impulse. Cycle wave I within the impulse may now be unfolding higher. Cycle wave II may not move beyond the start of cycle wave I below 10.24.
DAILY CHART
Click chart to enlarge.
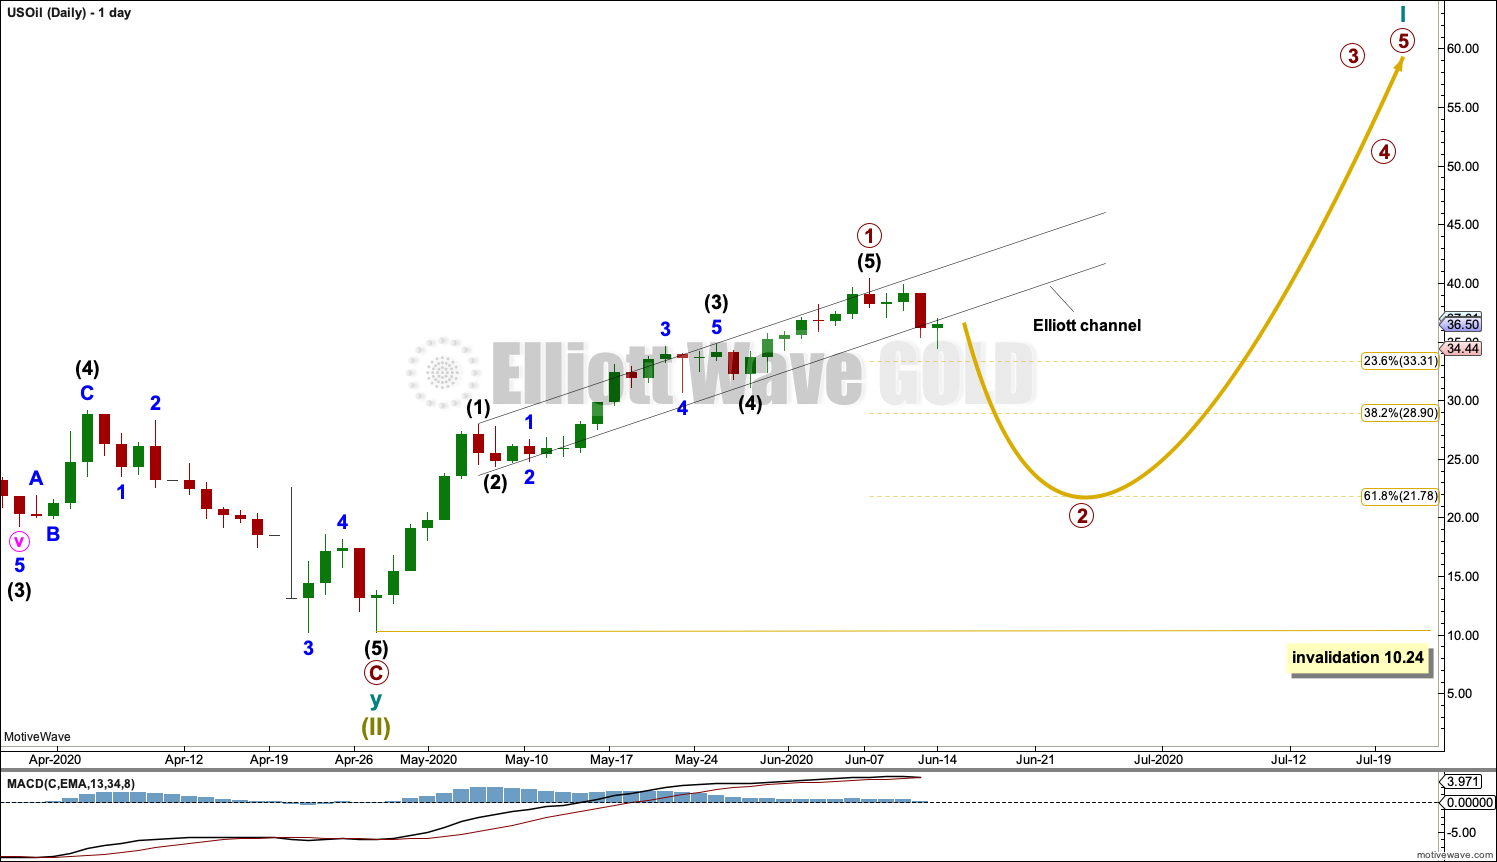
Labels are added for cycle wave I. This week the degree of labelling is moved up one degree; within an impulse for cycle wave I, primary wave 1 may now be complete.
A small channel is drawn about primary wave 1. Friday’s candlestick is below the channel; although it still touches the lower edge, this may indicate primary wave 1 may be over and primary wave 2 may have begun.
Primary wave 2 may not move beyond the start of primary wave 1 below 10.24. Primary wave 2 may be reasonably expected to be very deep and last at least five weeks.
ALTERNATE DAILY CHART
This week the alternate daily chart is discarded because, as it was labelled, downwards movement for Friday would be a fourth wave correction that overlaps into first wave price territory.
Now some further confidence may be had in the main wave count.
TECHNICAL ANALYSIS
WEEKLY CHART
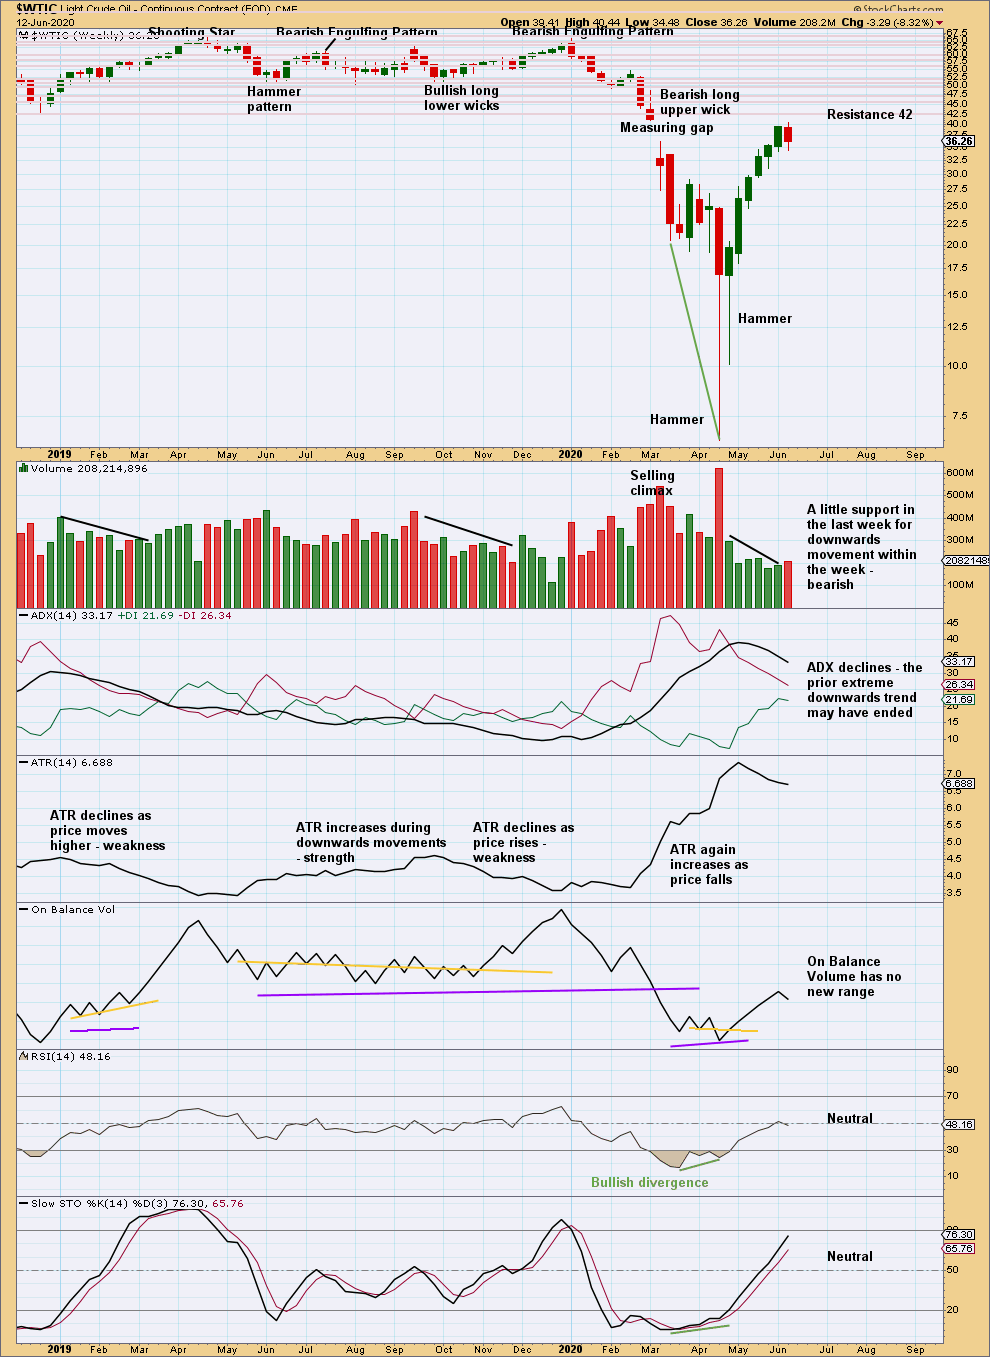
Click chart to enlarge. Chart courtesy of StockCharts.com.
After upwards movement exhibited a decline in volume and range, now a red weekly candlestick with a slight increase in volume suggests the risk of a pullback here is higher.
DAILY CHART
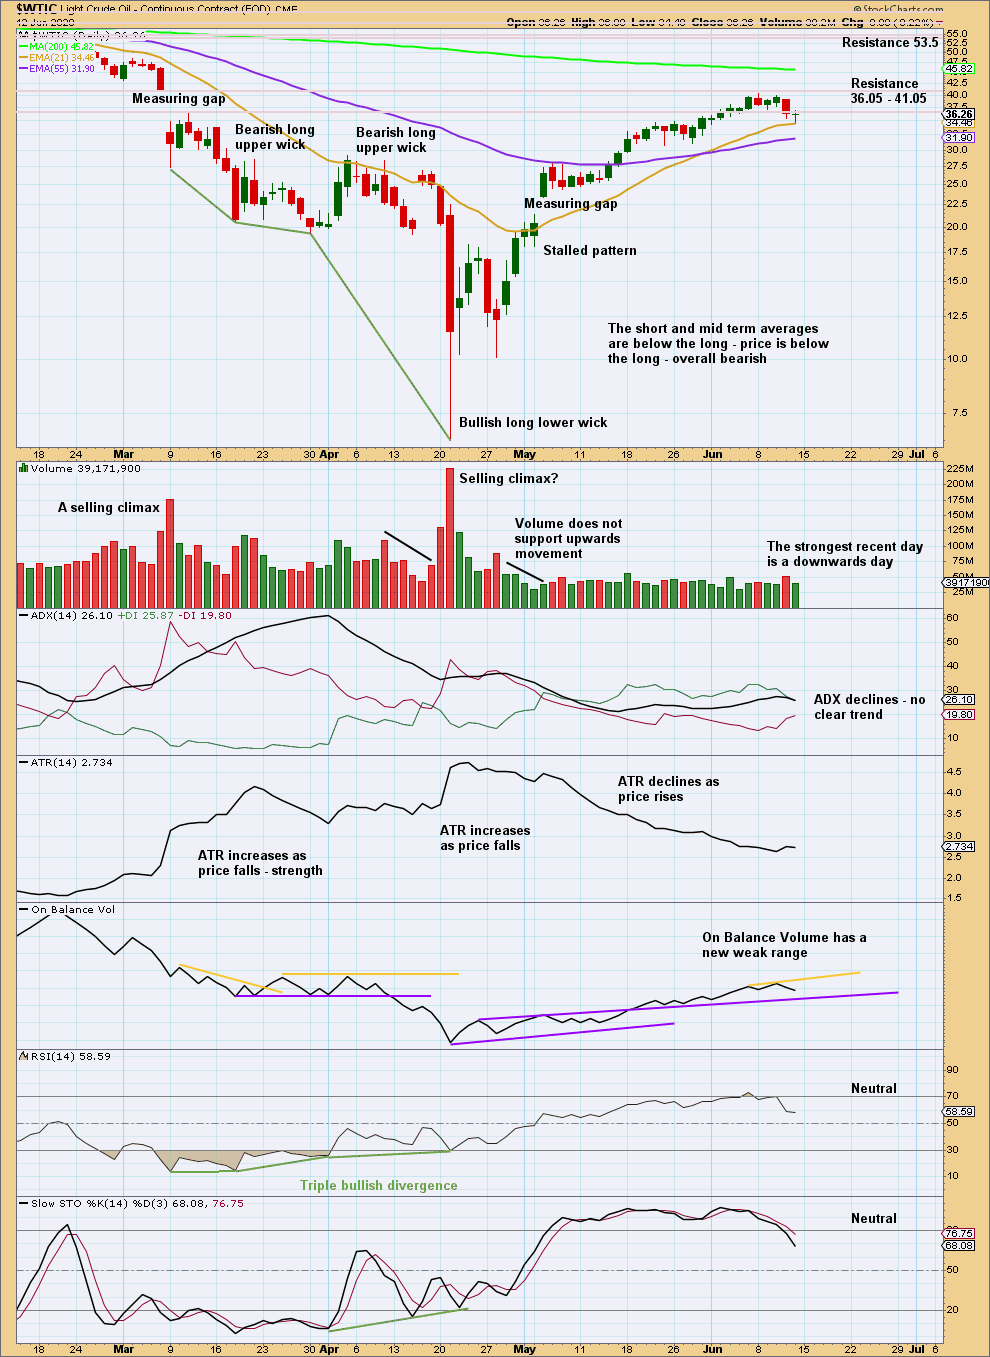
Click chart to enlarge. Chart courtesy of StockCharts.com.
A pullback may have begun. But at this stage the pullback lacks strength.
Published @ 06:28 p.m. EST.
—
Careful risk management protects your trading account(s).
Follow my two Golden Rules:
1. Always trade with stops.
2. Risk only 1-5% of equity on any one trade.
—
New updates to this analysis are in bold.