
Yesterday’s analysis expected downwards movement. This is not what happened. Movement above 1,244.74 invalidated the hourly wave count. The daily wave count remains valid.
Click on the charts below to enlarge.
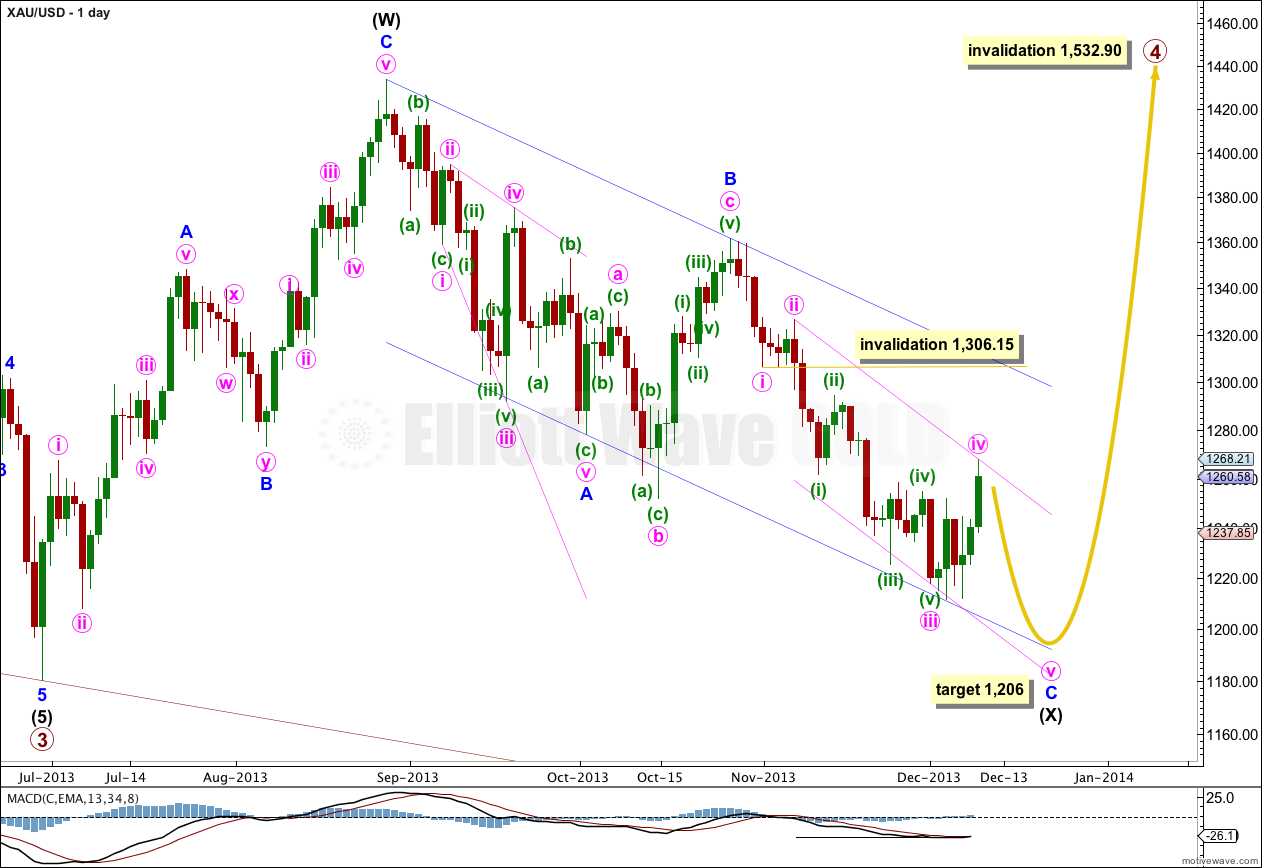
Gold is still within a large fourth wave correction at primary wave degree which is incomplete. To see a full explanation of my reasoning for expecting that primary wave 4 is not over and is continuing see this.
Primary wave 2 was a rare running flat correction, and was a deep 68% correction of primary wave 1. In order to show alternation in structure primary wave 4 may be a zigzag, double zigzag, combination, triangle or even an expanded or regular flat. We can rule out a zigzag because the first wave subdivides as a three. This still leaves several structural possibilities.
If primary wave 4 is a combination, expanded flat or running triangle then we may see a new low below 1,180.40 within it. This is why there is no lower invalidation point for intermediate wave (X).
If price reaches 1,205.74 then downwards movement labeled intermediate wave (X) would be 90% of upwards movement labeled intermediate wave (W). I would relabel primary wave 4 as an A-B-C flat correction. If price does not reach 1,205.74 then primary wave 4 is most likely a double combination.
Within intermediate wave (X) zigzag downwards minor wave C has an extended third wave which is now complete. So far a count of minor wave C gives a count of eight, and one more downwards wave is required to complete an impulsive wave, with a count of nine.
Redraw the parallel channel about minor wave C downwards with the first trend line from the highs labeled minute waves ii to iv, then place a parallel copy upon the low labeled minute wave iii. As minute wave iv moves a little higher redraw the channel. The lower edge should be where minute wave v ends.
I would expect downwards movement to also find support at the lower edge of the parallel channel drawn here about intermediate wave (X).
Draw a parallel channel about the zigzag of intermediate wave (X): draw the first trend line from the start of minor wave A to the end of minor wave B, then place a parallel copy upon the end of minor wave A. When this channel is finally breached by upwards movement then I would consider that final confirmation that intermediate wave (Y) is underway.
Primary wave 4 may not move into primary wave 1 price territory. This wave count is invalidated with movement above 1,532.90.
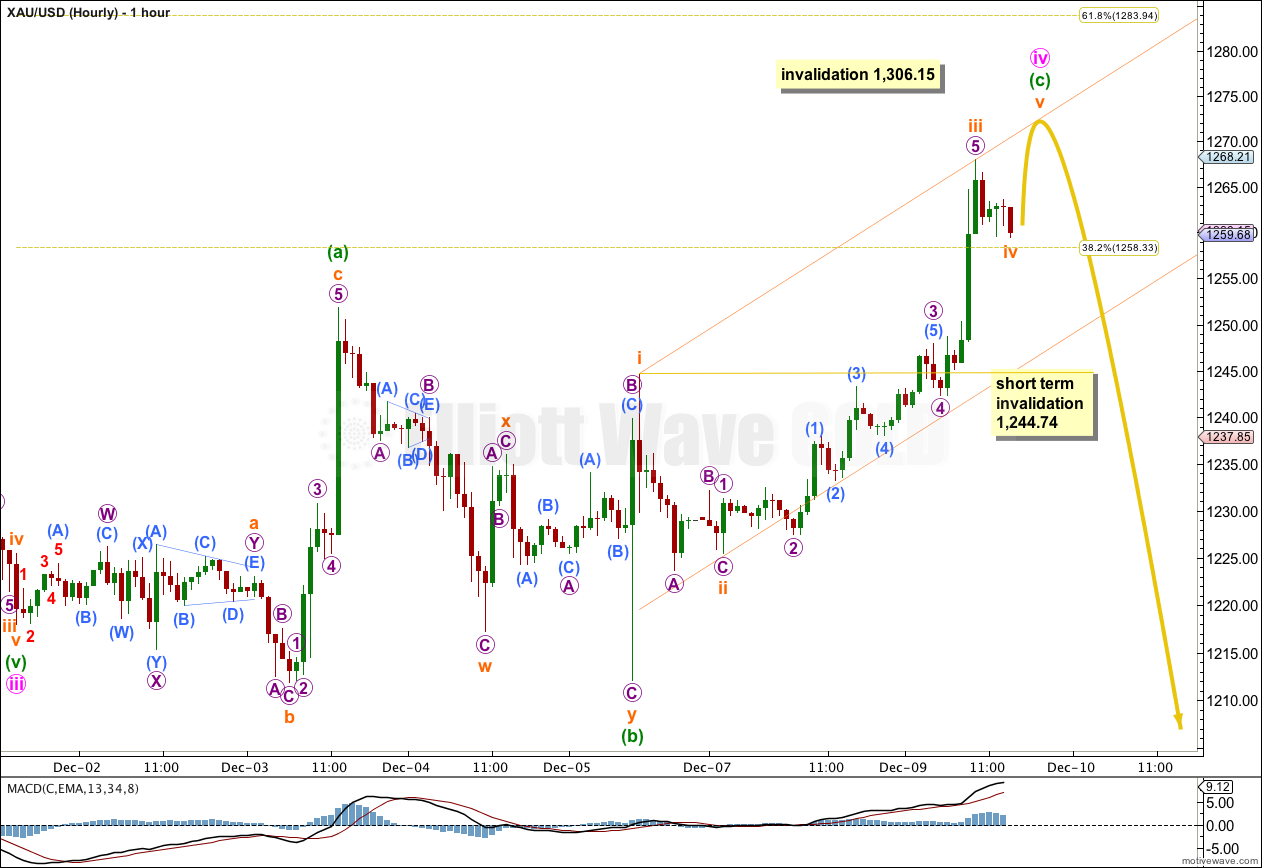
Upwards movement was unexpected and had a low probability. I had expected this fourth wave to have the same duration as its counterpart second wave, and to end within the price territory of the fourth wave of one lesser degree, because that would have been the most common scenario. However, minute wave iv is now two days longer in duration that minute wave ii, and is above the price territory of the fourth wave of one lesser degree.
I have relabeled the structure of minute wave iv. It does not look like a combination because those move price sideways. This one is trending upwards.
It is more likely to be an expanded flat correction. Within it minuette wave (b) is a 117% correction of minuette wave (a). Minuette wave (c) passed 1.618 the length of minuette wave (a) at 1,267. Minuette wave (c) may not exhibit a Fibonacci ratio to minuette wave (a).
The best way to calculate a target for minuette wave (c) to end would be to use the ratios of subminuette wave degrees within it. There is no Fibonacci ratio between subminuette waves i and iii, so it is very likely that subminuette wave v would exhibit a Fibonacci ratio. However, at the time this analysis is published subminuette wave iv is incomplete and should move price lower. I cannot calculate a target for you until I know where the fifth wave begins.
I would expect the most likely length for subminuette wave v to be 32.63, equality with subminuette wave i. If this length takes price up to the 0.618 Fibonacci ratio at 1,283.94 then that would be the highest probability target.
The next likely wave length would be 26.30, 0.618 the length of subminuette wave iii.
I have drawn a parallel channel using Elliott’s first technique about minuette wave (c). Draw the first trend line from the highs of subminuette waves i to iii, place a parallel copy upon the low of subminuette wave ii. I would expect subminuette wave iv to end either mid way within the channel or to find support at the lower edge. I would also expect subminuette wave v to end about the upper edge. This channel may be the easiest way to find where this fifth wave ends.
Minute wave iv may not move into minute wave i price territory. This wave count is invalidated with movement above 1,306.15.
Alternate Daily Wave Count – Triangle.
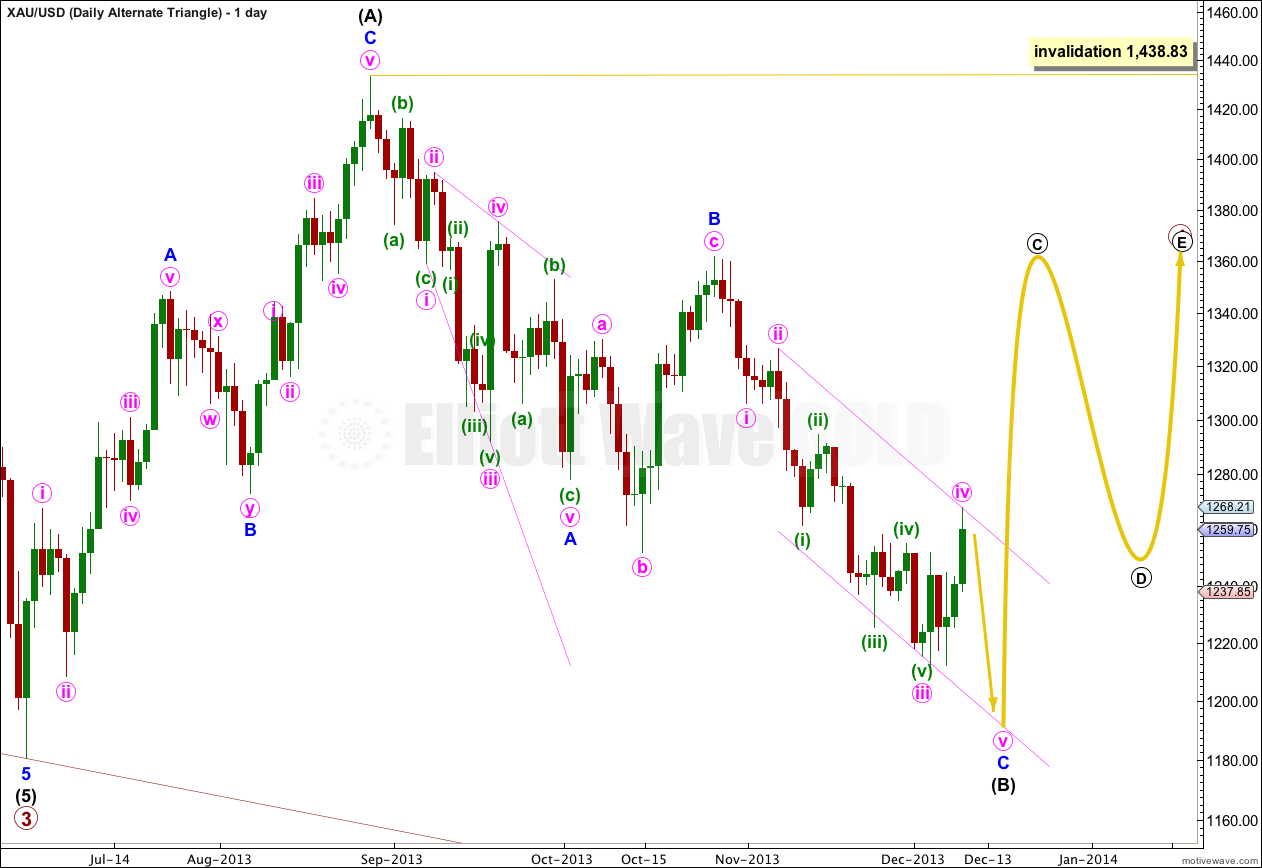
It is also possible that primary wave 4 may continue as a regular contracting (or barrier) triangle.
The expected direction and structure of this next upwards wave is the same, but for this alternate intermediate wave (C) of the triangle may not move beyond the end of intermediate wave (A). The triangle is invalidated with movement above 1,438.83.
The final intermediate wave (E) upwards may not move above the end of intermediate wave (C) for both a contracting and barrier triangle. E waves most commonly end short of the A-C trend line.
All five subwaves of a triangle must divide into corrective structures. If this next upwards movement subdivides as a zigzag which does not make a new high above 1,438.83 then this alternate would be correct.
Triangles take up time and move price sideways. If primary wave 4 unfolds as a triangle then I would expect it to last months rather than weeks.