
Yesterday’s short term target was at 1,237. Price did move higher, but not before making a new low.
I had expected choppy, overlapping movement for about four days towards the eventual target at 1,242.74.
Price has moved above this target to reach 1,251.84 so far.
Click on the charts below to enlarge.
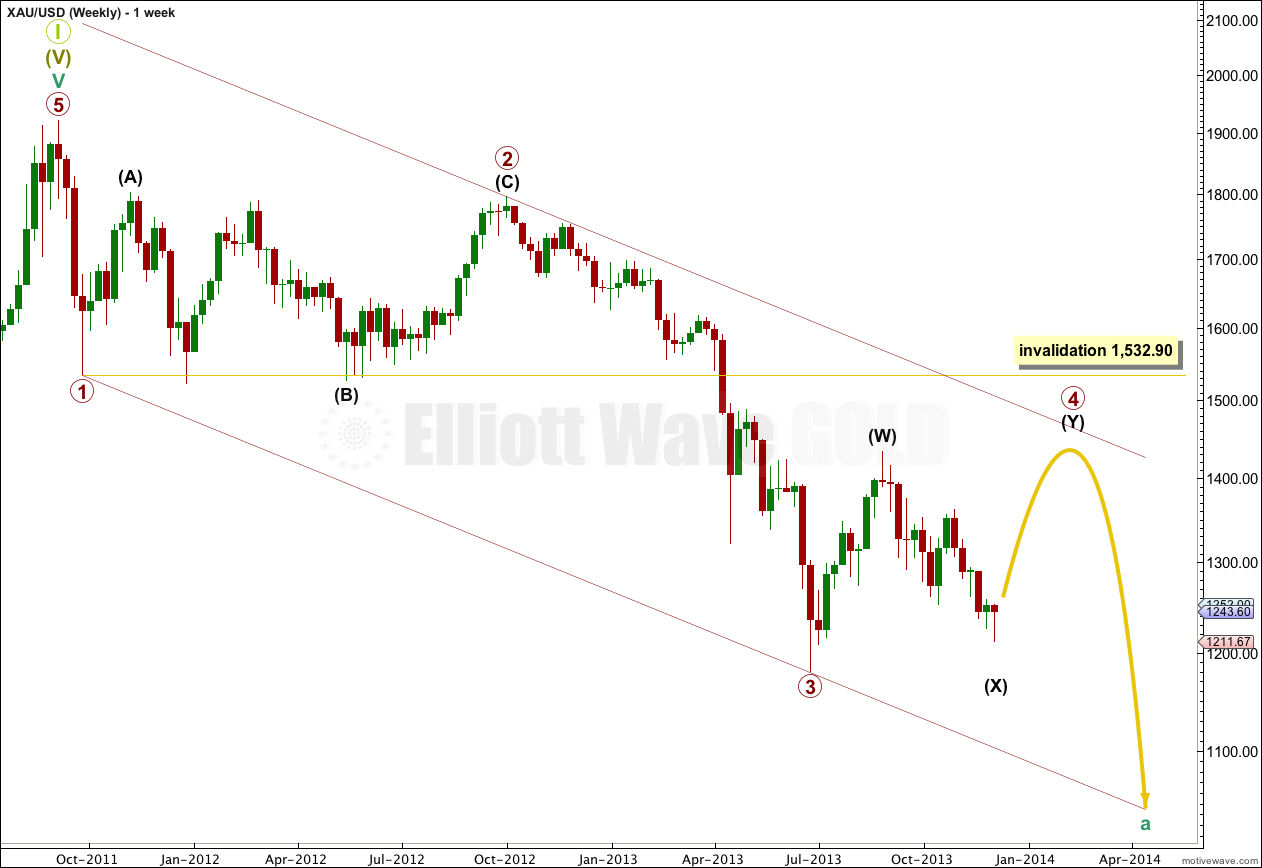
I have been asked the same question numerous times about whether or not primary wave 4 is over. Just so members are clear on my reasoning I’ll today publish an updated weekly chart.
Primary wave 1 must have ended at 1,532.90 in September 2011. Trying to see it as ended at 1,522.75 in December 2011 (the next low) would give it a strong three wave look. First waves must subdivide as fives, and should look like fives on a monthly chart, particularly for Gold which has the most typical looking Elliott wave structures of any market I have analysed.
Primary wave 2 begins at 1,532.90 in September, 2011 and lasts 53 weeks. The structure is a running flat: intermediate wave (C) ends just 7.08 below the end of intermediate wave (A), and intermediate wave (B) was a 102% correction of intermediate wave (A). I have checked the subdivisions of this structure on the daily chart and it fits perfectly. So although it is rare, that is how it subdivides. Particularly the B wave within the flat, because trying to see that movement as anything other than a “three” would not fit.
For this wave count to have the right look on a weekly chart it is most likely that primary wave 4 was not over in a mere nine weeks. It is most likely to continue further to take up more time, and may find resistance at the upper edge of the big maroon parallel channel.
It is possible that primary wave 4 is over and that primary wave 5 is underway. However, that scenario has such a low probability I do not want to chart it.
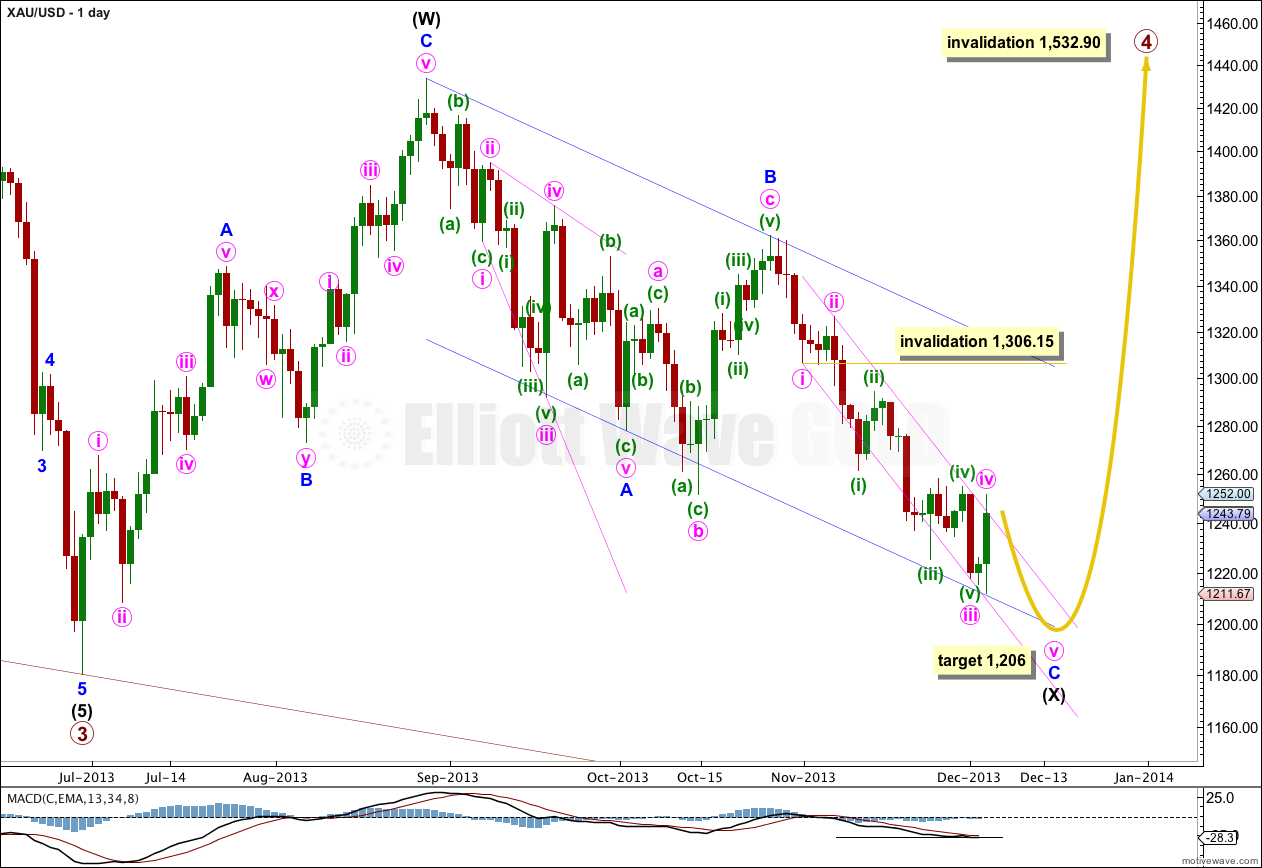
Gold is still within a large fourth wave correction at primary wave degree which is incomplete. It is unlikely that primary wave 4 was over at 1,433.83 as a single zigzag because it would have lasted only nine weeks. Its counterpart primary wave 2 lasted 53 weeks. This is too big a difference for the wave count to have the “right look”.
Primary wave 2 was a rare running flat correction, and was a deep 68% correction of primary wave 1. In order to show alternation in structure primary wave 4 may be a zigzag, double zigzag, combination, triangle or even an expanded or regular flat. We can rule out a zigzag because the first wave subdivides as a three. This still leaves several structural possibilities.
If price reaches 1,205.74 then downwards movement labeled intermediate wave (X) would be 90% of upwards movement labeled intermediate wave (W). I would relabel primary wave 4 as an A-B-C flat correction. If price does not reach 1,205.74 then primary wave 4 is most likely a double combination.
Within intermediate wave (X) zigzag downwards minor wave C has an extended third wave which is now complete. So far a count of minor wave C gives a count of eight, and one more downwards wave is required to complete an impulsive wave, with a count of nine.
Draw the parallel channel about minor wave C downwards with the first trend line from the lows labeled minute waves i to iii, then place a parallel copy upon the high labeled minute wave ii. Minute wave iv has slightly overshot this channel so far. When minute wave iv is complete I will redraw the channel using Elliott’s second technique.
I would expect downwards movement to find support at the lower edge of the parallel channel drawn here about intermediate wave (X).
Draw a parallel channel about the zigzag of intermediate wave (X): draw the first trend line from the start of minor wave A to the end of minor wave B, then place a parallel copy upon the end of minor wave A. When this channel is finally breached by upwards movement then I would consider that final confirmation that intermediate wave (Y) is underway.
Primary wave 4 may not move into primary wave 1 price territory. This wave count is invalidated with movement above 1,532.90.

I had expected price to move higher, but had not expected a new low before it did. I had warned yesterday though that with the many structural possibilities for this correction the labeling may change as it becomes clearer.
Within this correction minuette wave (a) is complete as a double combination: zigzag – X – triangle. Minuette wave (b) is a zigzag and is a 220% correction of minuette wave (a). This is much longer than the maximum common length of 138% for a B wave within a flat, but this is the only labeling I can see which fits all the rules for Elliott Wave structures.
Minute wave iv may be very close to completion as a single expanded flat, or this may be only the first structure in a double.
Minute wave ii was a shallow 36.5% regular flat correction. So far minute wave iv is showing alternation in structure. This expanded flat is a sharply trending correction, whereas minute wave ii regular flat was a sideways moving correction. If minute wave iv ends close to the 0.382 Fibonacci ratio at 1,258 then it will not show much alternation in depth. That’s okay, alternation is a guideline and not a rule; I often see alternation in only depth or structure and not both.
Within minuette wave (c) the structure is incomplete, and requires one final fifth wave up to end it. At 1,256 subminuette wave v within minuette wave (c) would reach 0.618 the length of subminuette wave i.
When the expanded flat is completed then I will have to consider an alternate idea of a combination or double flat for minute wave iv. The alternate will move the labeling of this expanded flat all down one degree and consider the possibility of another two to three days of sideways movement. I will have to consider this because if minute wave iv is over in just two days it is half of the duration of all the other corrections within minor wave C.
Minute wave iv may not move into minute wave i price territory. This wave count is invalidated with movement above 1,306.15.
Alternate Daily Wave Count – Triangle.
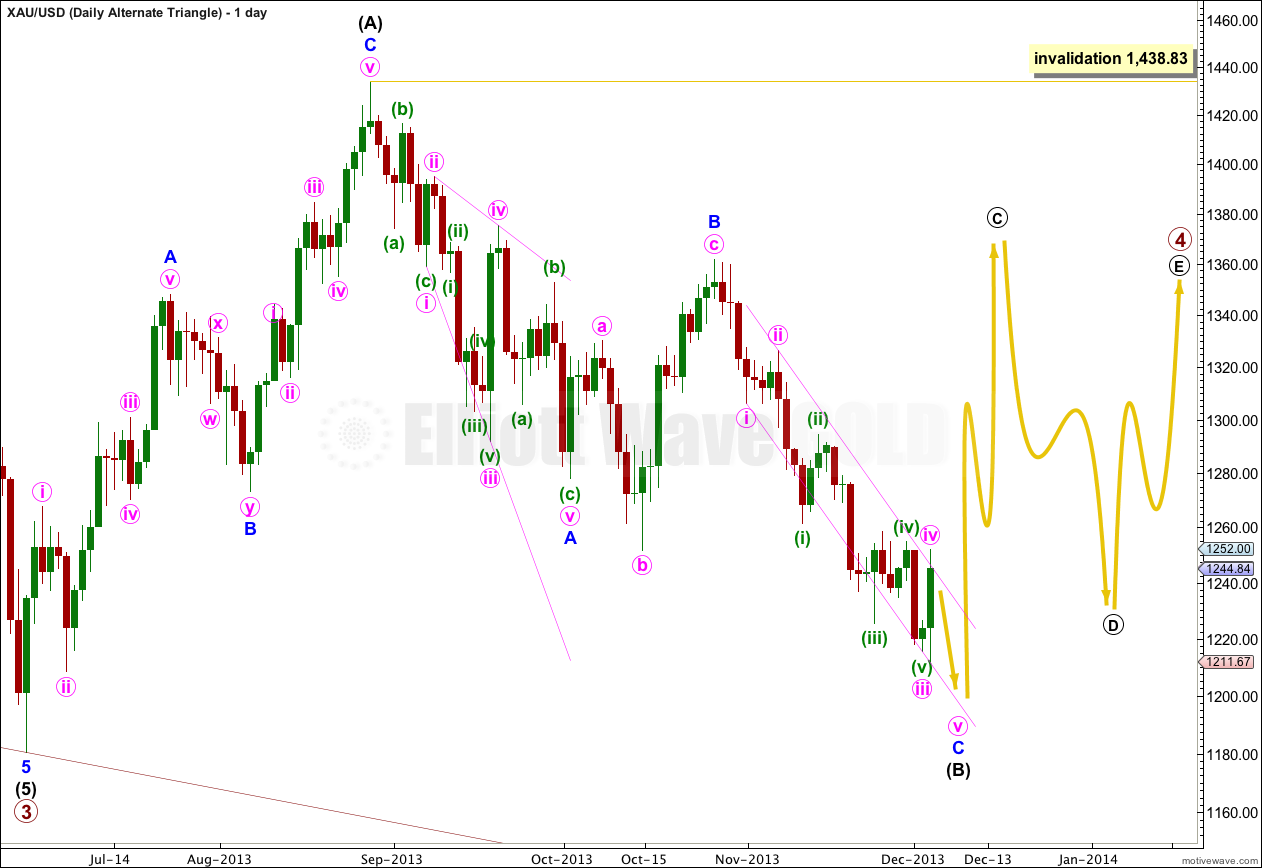
It is also possible that primary wave 4 may continue as a regular contracting (or barrier) triangle.
The expected direction and structure of this next upwards wave is the same, but for this alternate intermediate wave (C) of the triangle may not move beyond the end of intermediate wave (A). The triangle is invalidated with movement above 1,438.83.
The final intermediate wave (E) upwards may not move above the end of intermediate wave (C) for both a contracting and barrier triangle. E waves most commonly end short of the A-C trend line.
All five subwaves of a triangle must divide into corrective structures. If this next upwards movement subdivides as a zigzag which does not make a new high above 1,438.83 then this alternate would be correct.
Triangles take up time and move price sideways. If primary wave 4 unfolds as a triangle then I would expect it to last months rather than weeks.
Do you have the hourly chart with detail of minute wave iv? Thanks
If you mean minuette wave (iv) green it is here:
http://elliottwavegold.com/2013/12/gold-elliott-wave-technical-analysis-4th-december-2013/
if you mean minute wave iv pink it’s on the hourly chart above