
Last Elliott wave analysis expected at least some more downwards movement from Silver for both the main and alternate wave counts. Price has moved lower as expected and now the wave counts diverge.
Click on charts to enlarge.
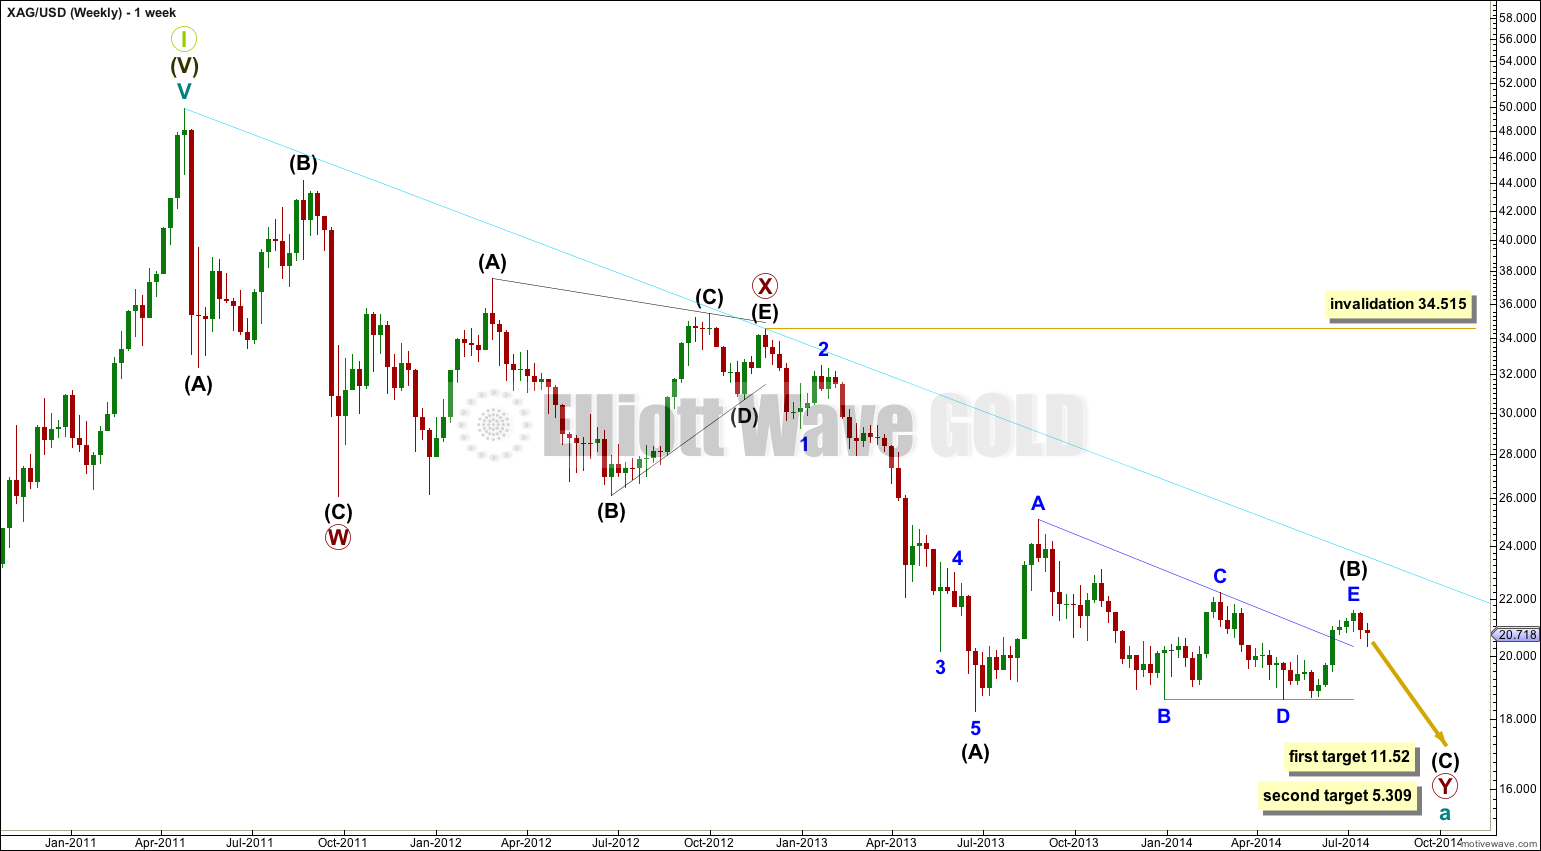
Downwards movement subdivides so far as an incomplete double zigzag. This cannot be an impulse if the movement which I have labeled primary wave X is correct as a triangle because a triangle may not be the sole structure in a second wave position.
The first zigzag in the double is labeled primary wave W. The double is joined by a “three”, a triangle, in the opposite direction labeled primary wave X.
The second zigzag for primary wave Y is moving price lower to deepen the correction, and so this structure has a typical double zigzag look in that it has a clear slope against the main trend.
Within primary wave Y the triangle for intermediate wave (B) is now a complete barrier triangle.
Within primary wave Y at 11.52 intermediate wave (C) would reach 0.618 the length of intermediate wave (A). This first target has a higher probability. At 5.309 intermediate wave (C) would reach equality in length with intermediate wave (A).
Within primary wave Y intermediate wave (A) lasted 30 weeks, and intermediate wave (B) lasted exactly a Fibonacci 54 weeks. I would expect intermediate wave (C) to end in a total 21 or 34 weeks.
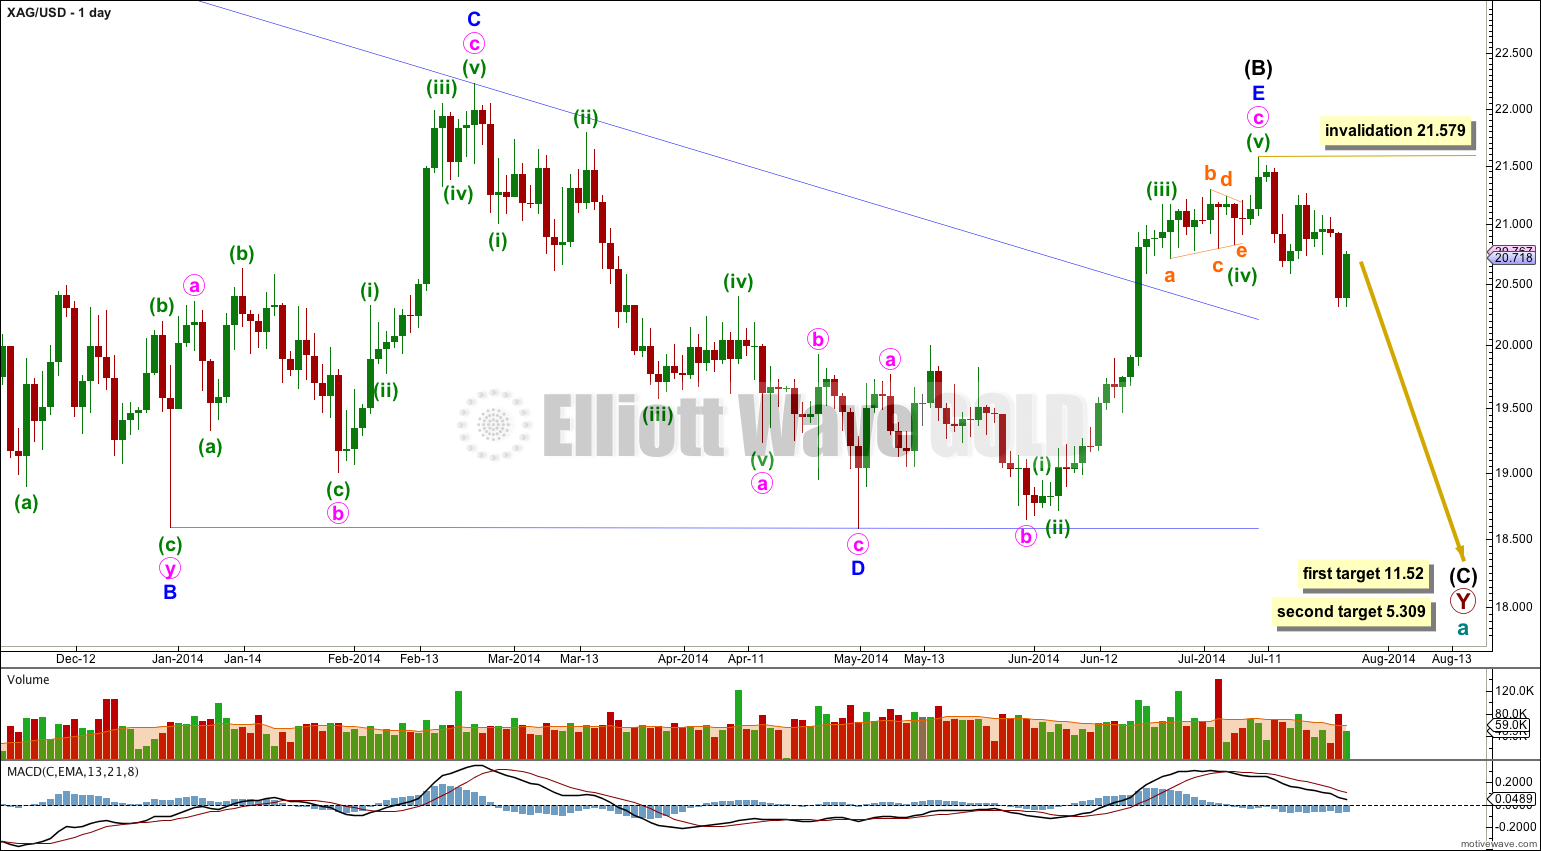
The triangle for intermediate wave (B) is complete.
Intermediate wave (C) downwards should subdivide as a five wave structure, either an impulse (most likely) or an ending diagonal (less likely). At this stage it is far too early to tell which structure may unfold.
Within intermediate wave (C) no second wave correction may move beyond the start of its first wave above 21.579.
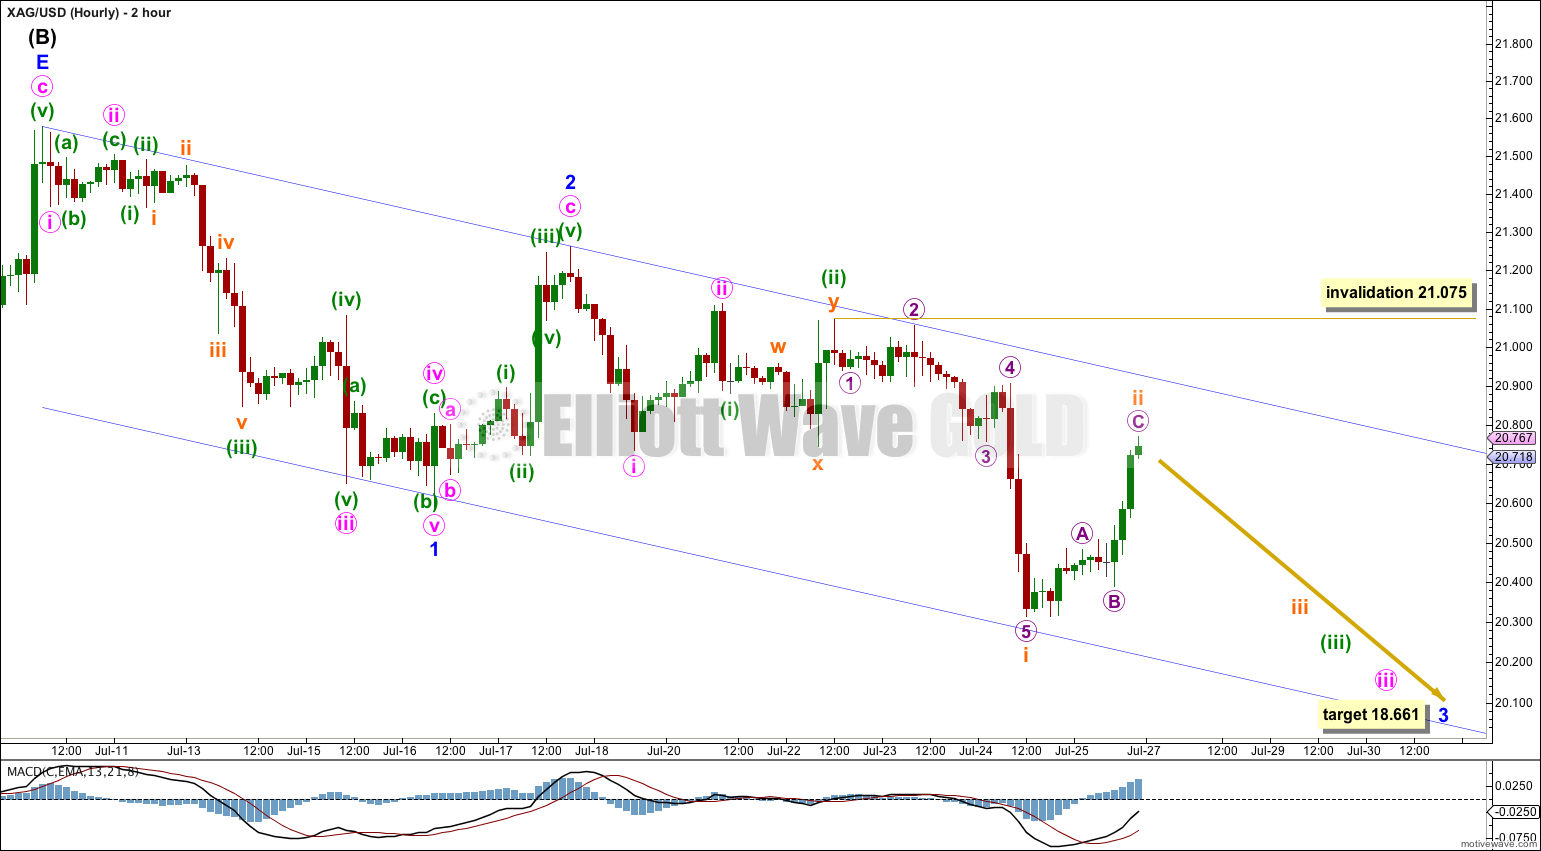
So far to the downside there may be a series of four first and second waves. This indicates we may see a strong increase in downwards momentum some time in the next couple of weeks or so.
At 18.661 minor wave 3 would reach 2.618 the length of minor wave 1.
The dark blue channel is a base channel drawn about minor waves 1 and 2. Upwards corrections should continue to find resistance at the upper edge of the channel. When the middle of the third wave arrives it should have the power to break through support at the lower edge of the channel. This would be the first indication that the strongest downwards movement has arrived.
Subminuette wave ii may not move beyond the start of subminuette wave i above 21.075.
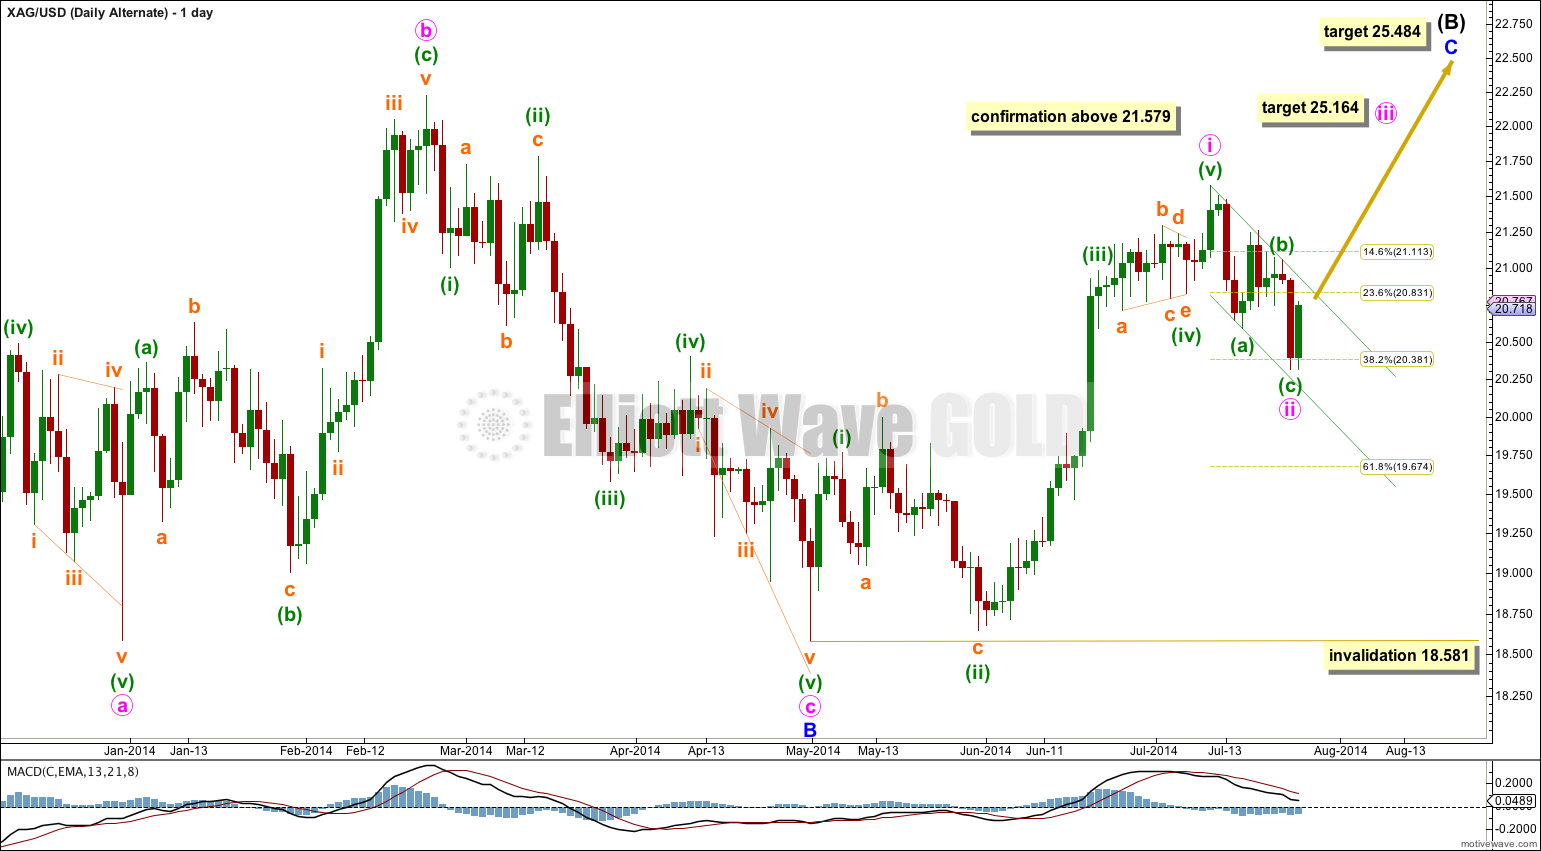
This alternate sees intermediate wave (B) as an incomplete zigzag. Within it at 25.484 minor wave C would reach equality in length with minor wave A. Minor wave C is extremely likely to make at least a slight new high above 25.118 to avoid a truncation.
I am still considering this alternate idea because for the main wave count (at the daily chart level) minor wave E of the triangle is such a strong overshoot. Sometimes E waves overshoot the A-C trend line of triangles when they come to an end, but not by that much. It has a slightly strange look.
I would judge this alternate to have only about a 20 – 30% probability. It does not fit with the main wave count for Gold or GDX.
If the main wave count is invalidated with movement above 21.579 then this is the alternate wave count I would use.
At 25.164 minute wave iii would reach 1.618 the length of minute wave i.
I have drawn a small best fit channel about the downwards zigzag of minute wave ii. If this channel is clearly breached by a full daily candlestick above it and not touching the upper green trend line that would provide earliest indication that this alternate wave count could be correct.
Minute wave ii may not move beyond the start of minute wave i below 18.581.
Hi Lara … I’m 100% on your alternate count with incomplete ZZ. But I don’t have the B leg on that complete, so perhaps from a lower start it may look less strange. I have us rolling over near term; then the C leg.
Pedro
Hi Lara. That has been wonderful work. I am just wondering about your labeling for the main wave count though. Intermediate B ended at 21.579. The higher target for Intermediate C to end is 11.52. The 2-hourly chart indicates that Minor 3 target is 18.661. This would then require a very extended Minor 5 wave to bring the price to 11.52. Is it possible that the wave count is actually one degree lower? That is, the minor waves are minute waves instead? That would yield a better look to the chart.
Both are possible. My degree of labeling may very well be too high, and I think this is most likely.
We may also see an extended fifth wave. This is pretty common for commodities.