
Movement below 104.51 confirmed the main wave count and invalidated the alternate wave count. The trend is down at cycle degree.
Summary: The target remains at 74.53 and this target may be still a few weeks away. A short term target is at 98.90 and may be met in about one or two weeks.
Click on charts to enlarge.
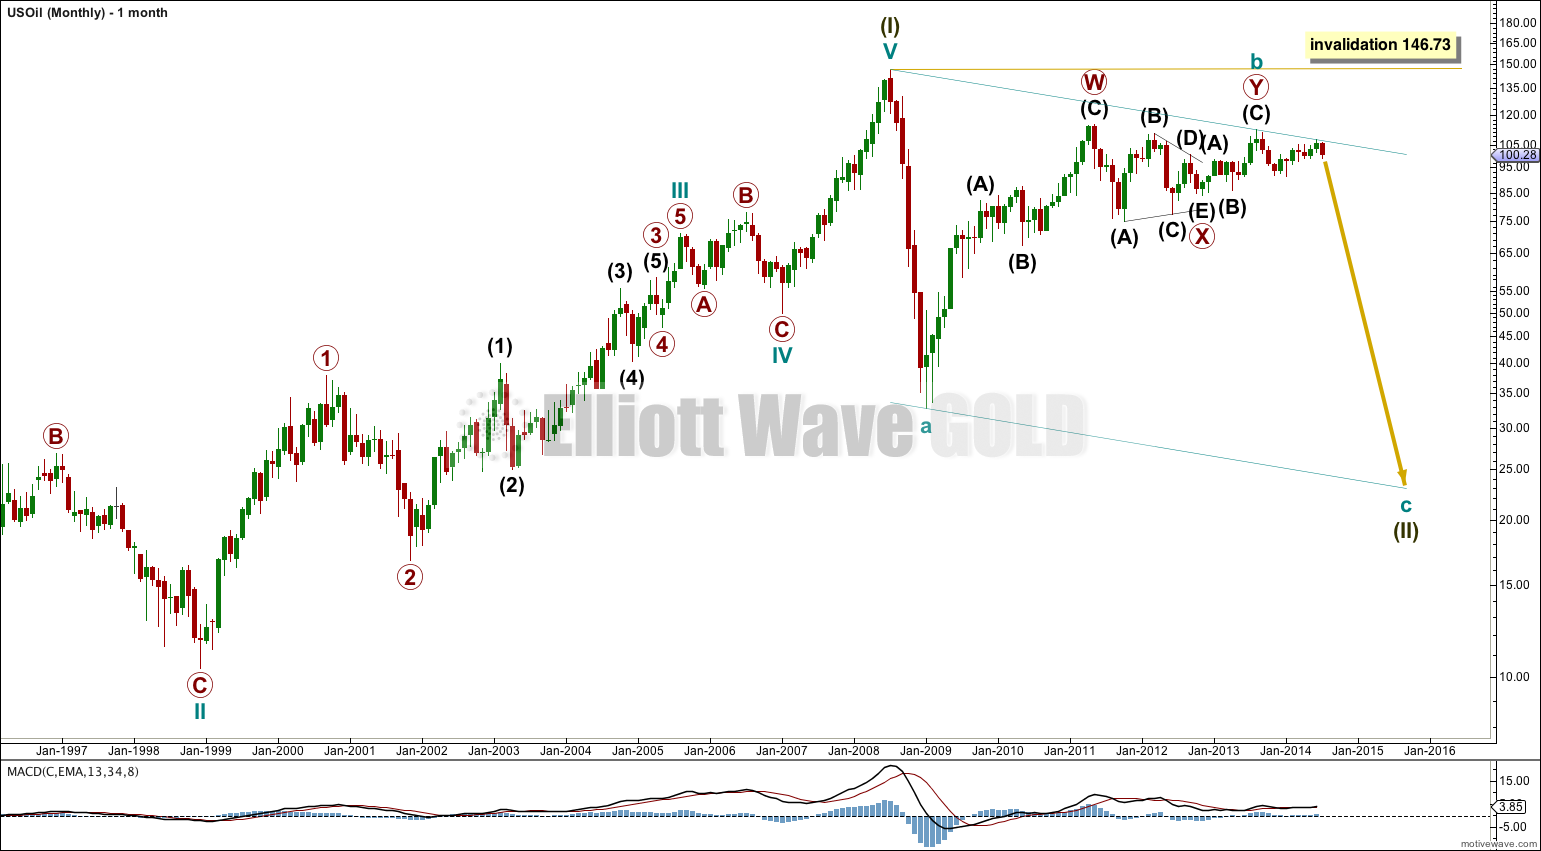
Upwards movement has hit the upper teal trend line. Since price bounced down from that trend line this provides some confidence in this main wave count.
The one thing which looks most certain in this wave count is cycle wave a downwards is a five wave impulse. This means cycle wave b may not move beyond the start of cycle wave a above 146.73. Cycle wave b should subdivide as a three wave structure. It looks like a double zigzag which should now be complete.
Within the double zigzag this wave count sees primary wave X as a regular contracting triangle, ending at 84.07 where intermediate wave (E) typically undershot the B-D trend line.

Within cycle wave c primary wave 1 is incomplete.
Within primary wave 1 intermediate waves (1) and (2) are complete. Intermediate wave (2) is a double combination: expanded flat – X (triangle) – zigzag.
At 74.53 intermediate wave (3) would reach 1.618 the length of intermediate wave (1). Intermediate wave (3) may only subdivide as a simple impulse.
Within intermediate wave (3) minor wave 4 may not move into minor wave 1 price territory above 105.11.

I am not certain that my labeling of minor wave 1 is correct, but this movement does not subdivide as an impulse. It may be an atypical leading diagonal.
At 98.90 minor wave 3 would reach 4.236 the length of minor wave 1. This target may be too high however. It expects that minor wave 5 should be a long extension, and this may not be the case. Minor wave 3 may turn out to end lower and may be the longest extended wave down.
Within minute wave iii minuette wave (iii) is 0.41 short of 4.236 the length of minuette wave (i).
Ratios within minuette wave (iii) are: subminuette wave iii is just 0.12 short of 0.618 the length of subminuette wave i, and subminuette wave v has no Fibonacci ratio to either of subminuette waves i or iii. Subminuette wave iii shows the strongest downwards momentum within minuette wave (iii).
Ratios within subminuette wave i are: there is no Fibonacci ratio between micro waves 3 and 1, and micro wave 5 is just 0.16 longer than 1.618 the length of micro wave 1.
I have used Elliott’s first technique to draw a parallel channel about minute wave iii. Draw the first trend line from the ends of minuette waves (i) to (iii), then place a parallel copy on the end of minuette wave (ii). I would expect minuette wave (iv) to be very likely to remain contained within this channel.
Minuette wave (v) may end either at the lower edge of the channel, or it may overshoot the lower edge of the channel.
Minuette wave (iv) would most likely end just below the end of the fourth wave of one lesser degree at 101.18. It may not move into minuette wave (i) price territory above 105.04.
Hi Lara, can you do an update for oil? We’ve barely bounced now off 98.17. Is there going to be a lengthy correction? Thanks much.
“Summary: The target remains at 74.53 and this target may be still a few weeks away. A short term target is at 98.90 and may be met in about one or two weeks”
Lara, would you please clarify probable time to reach target of 74.53 ? I am no EW expert so do not question your analysis but a 25% drop in oil prices over a few weeks is hard to see. Would be very rare occurrence and a once in a lifetime investment opportunity even if it took 4 or 5 or 6 weeks. Shorting a 25% drop in oil over a short time-frame would be tremendous return–maybe enough to live on the beach and surf every day!
Would you look at / verify (1) time to reach 74.53 and (2) give your opinion based on EW experience on probability of this analysis.
A fair point. I’ve not been very clear.
Intermediate wave (1) lasted 65 days, 3 monthly candlesticks. So I would expect intermediate wave (3) to be longer. It may be a Fibonacci 5 or 8 months in total. I would favour neither of these possible durations at this stage, both could be equally likely. Or it may not exhibit a Fibonacci duration.
Minor wave 3 end at 98.90 may a lot closer though, that may be one or two weeks away.