
While the Elliott wave monthly chart looks fairly clear at this time, the Elliott wave daily chart is not. With GDX data I cannot look at subdivisions on any time frame below daily.
I have one monthly wave count and three alternate ideas for the daily chart for you this week.
Click charts to enlarge.
Main Wave Count.
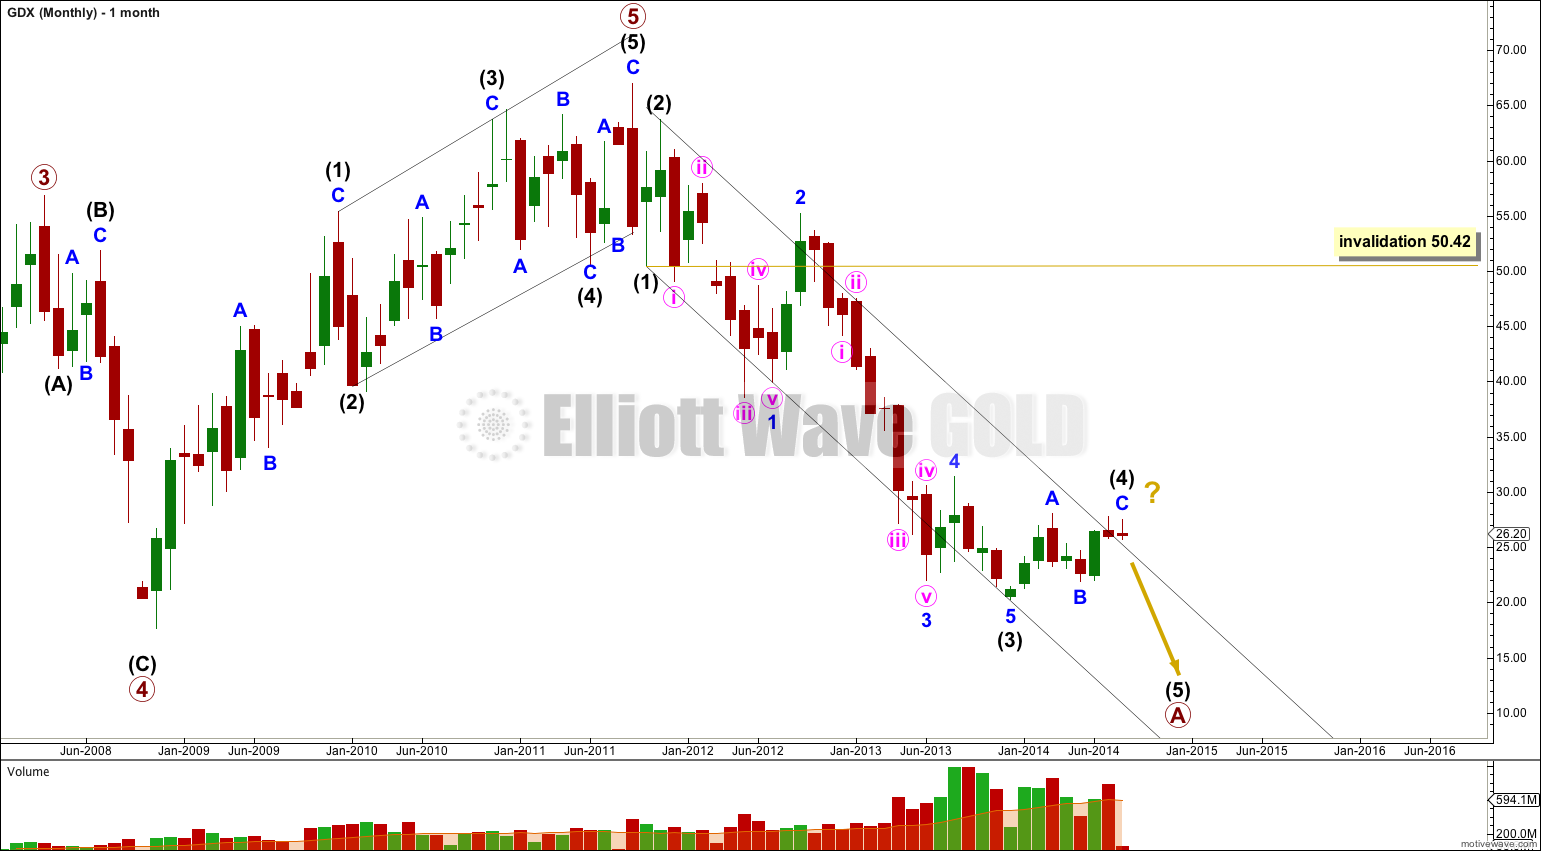
The clearest piece of movement is the downwards movement from the high. This looks most like a first, second and third wave. This may be the start of a larger correction.
Intermediate wave (3) is $1.06 longer than 2.618 the length of intermediate wave (1).
Within intermediate wave (3) there are no Fibonacci ratios between minor waves 1, 3 and 5.
Ratios within minor wave 1 of intermediate wave (3) are: minute wave iii has no Fibonacci ratio to minute wave i, and minute wave v is $2.19 longer than 0.618 the length of minute wave i.
Ratios within minor wave 3 of intermediate wave (3) are: minute wave iii has no Fibonacci ratio to minute wave i, and minute wave v is $0.63 longer than 0.382 the length of minute wave iii.
Draw a parallel channel about this downwards movement. Draw the first trend line from the lows of intermediate waves (1) to (3), then place a parallel copy upon the high of intermediate wave (2). Intermediate wave (4) found some resistance just above the upper edge of the channel.
Intermediate wave (4) may be over already, or it may continue further sideways or higher for another one to few weeks. Only movement below 21.93 would confirm that intermediate wave (4) is over and intermediate wave (5) is underway.
The three daily wave counts below are in no particular order. I am not confident that I know this market well enough at this stage (I only began analysing GDX in October 2013) to be able to judge how its structures normally look.
Daily Wave Count I.
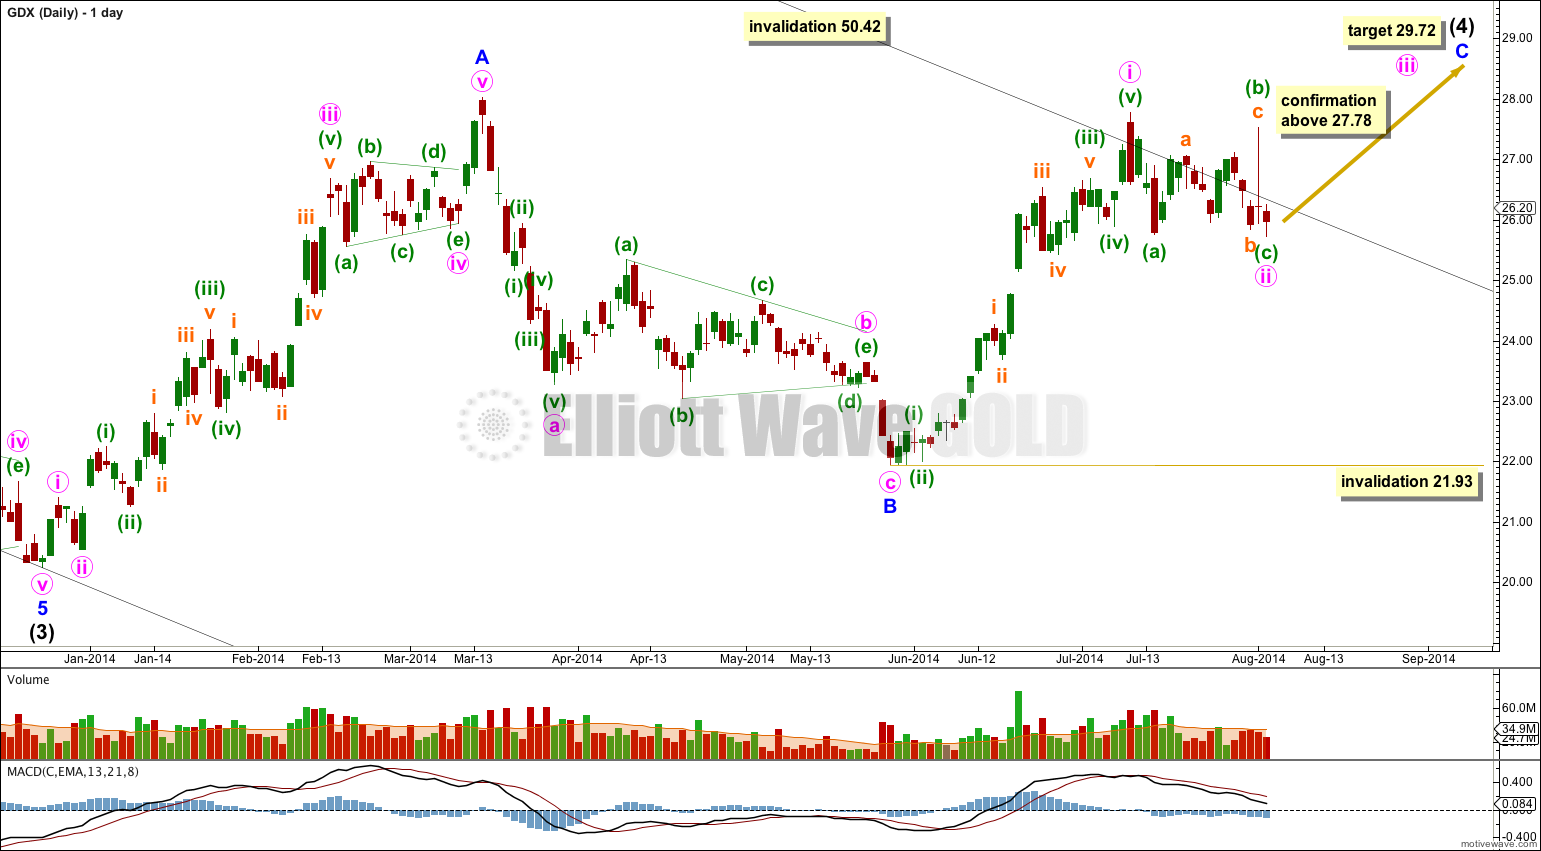
I have moved the degree of labelling within minor wave B all up one degree. It looks better for minor wave B to have been over at 21.93 as a zigzag.
At 29.72 minor wave C would reach equality in length with minor wave A.
This would see intermediate wave (4) move comfortably outside the parallel channel on the monthly chart, copied over here to the daily chart (black trend line). I do not know how common this is for GDX.
Within minor wave C minute waves iii and v may be shorter than minute wave i.
This wave count would be confirmed with movement above 27.78.
This main wave count sees the upwards wave for minor wave A as a five wave impulse. I think this has a slightly better fit than seeing this movement as a three.
Within minor wave C minute wave ii may not move beyond the start of minute wave i below 21.93.
Daily Wave Count II.
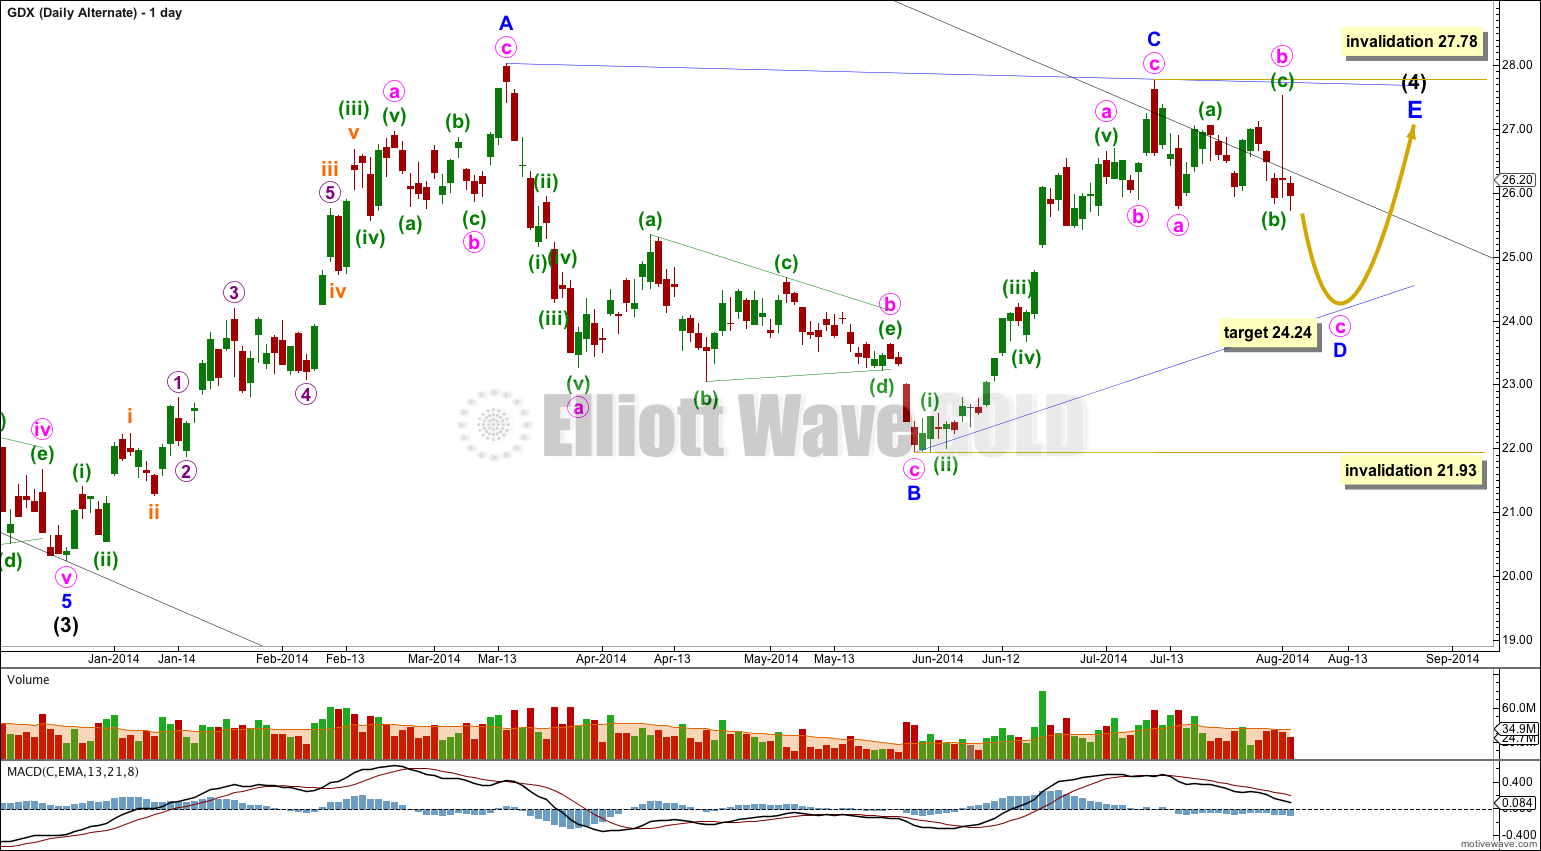
This idea follows on directly from a prior wave count. Intermediate wave (4) may be an incomplete regular contracting triangle.
This would see intermediate wave (4) have better structural alternation with intermediate wave (2) which fits best as a double zigzag.
However, this triangle is not typical looking. The A-C trend line is close to flat; normally, the A-C trend line has a clear slope for a contracting triangle. If one of the triangle trend lines is flat it is the B-D trend line within a barrier triangle. This is not a barrier triangle.
At 24.24 minute wave c within minor wave D would reach 1.618 the length of minute wave a.
Minor wave D may not move beyond the end of minor wave B below 21.93.
Within minor wave D minute wave b may not move beyond the start of minute wave a above 27.78.
Daily Wave Count III.
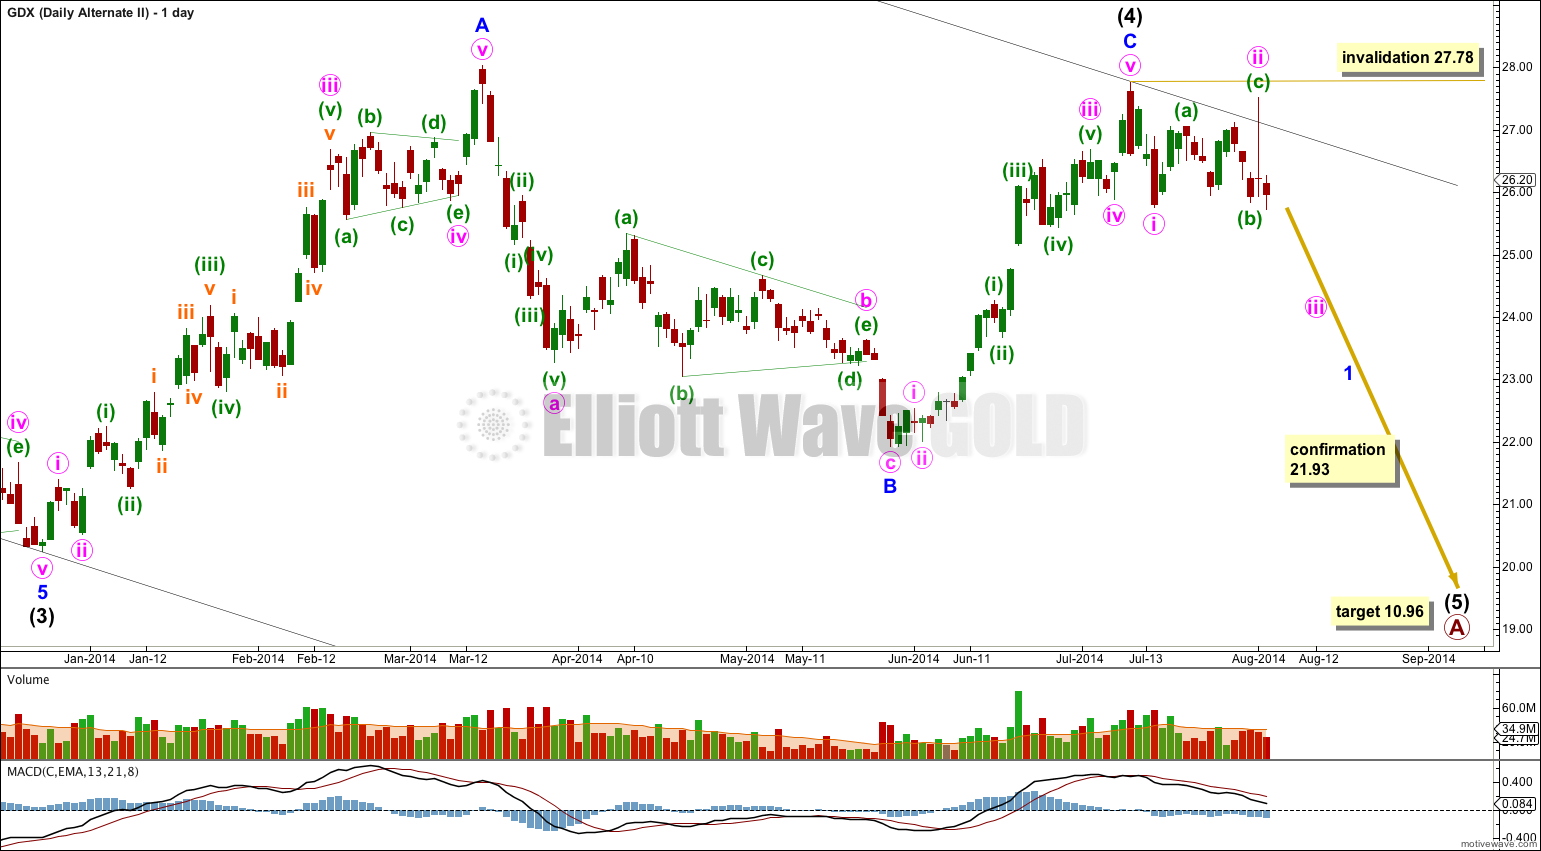
Finally, this third wave count is the same as the first wave count except the degree of labelling within minor wave C is moved up one degree. This sees intermediate wave (4) as a complete single zigzag with a slightly (0.25) truncated C wave.
I do not know how common truncations are for GDX, but so far I have seen a few. I suspect that GDX exhibits truncations a little more readily than the Gold cash market does.
This wave count again sees minor wave A as a five wave structure, which has the best fit.
Within intermediate wave (5) no second wave correction may move beyond the start of its first wave above 27.78.
Overall if I had to pick a winner it would be this third wave count because it has the best fit and proportions.
That data is the same. The high for 1st August has that spike to 27.52.
The data has to be in .csv format, and within that it has to have the right information in the right columns, for me to be able to import it into Motive Wave and do a wave count.
Yahoo Finance data is the easiest for me to do this.
Seems odd that your data feed only gives you daily pricing updates on GDX because the free sites I use give me as low as one-minute bars updating throughout the day.
I’m using a Google/Yahoo data feed and it gives me no GDX data at all actually.
I’m manually importing GDX data from the Yahoo Finance website.
Why not use http://stockcharts.com/h-sc/ui ??
That thin spike up on last Friday, 8/1 was due to ‘phantom quote’ and is not a valid date. It is not seen in any other miner index. The bogus phantom quote happened near the close – at the last 1 minute of trading. It should be disregarded, IMO and should not be used for Elliott wave reading!
I’ll look at Google data to see if I can replace my Yahoo data with something that takes it out.
If I can’t get rid of it with a different data source, if its in Google and Yahoo, then it will have to stay as part of the wave count.
There was no real trade that occurred at that price! I don’t know how these noisy data gets into the system. But take a look at other miner indices. That data point is simply not there!! It should not be used in any serious analysis.
There were actual trades at that price. I was watching time and sales of GDX at that time, and there were several prints between 26.20 and 27.50 in just a few seconds. It was obviously a fat finger trade, where someone lost a bunch of money. That’s why you don’t see it in other correlated indices. Don’t know about its implications into the wave count though… but the chart is correct.
It is likely to be insider shenanigans trying to paint the tape, what I call ‘phantom quotes’. I don’t think they should be used to analyze the market. But thanks for pointing out your observation.
Okay, so I’ve checked Google’s data and its the same. Both Google and Yahoo have a high at 27.52 on 1st August, 2014.
I’m going to assume its most likely right and leave it be.