
The main Elliott wave count expected a strong upwards day for Wednesday, but this is not what has happened.
Summary: It is still more likely that the correction is incomplete, but this has decreased in probability today and should be discarded below 1,196.24. The target for a wave up is still at 1,243. The target for the alternate idea, a strong fifth wave down, remains at 1,146.
Click on charts to enlarge.
Main Daily Wave Count
At this stage I judge this main wave count to have an even probability with the alternate below. I will let the structure of downwards movement, and momentum, tell us which wave count is correct over the next few weeks. At this stage they both expect more downwards movement so there is no divergence in the expected direction.
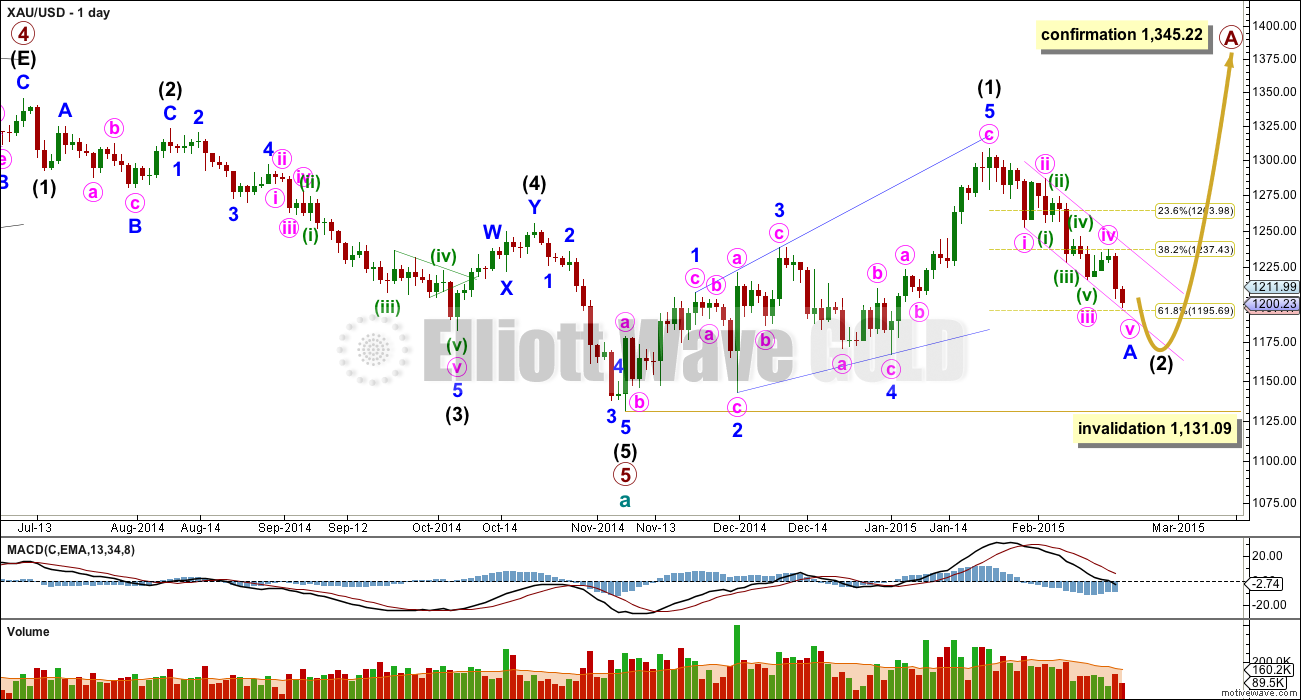
This wave count sees a five wave impulse down for cycle wave a complete, and primary wave 5 within it a completed five wave impulse. The new upwards trend at cycle degree should last one to several years and must begin on the daily chart with a clear five up.
The first five up may be a complete leading expanding diagonal. Within leading diagonals the second and fourth waves must subdivide as zigzags. The first, third and fifth waves are most commonly zigzags but they may also be impulses. This wave count sees minor waves 1, 3 and 5 as zigzags.
Leading diagonals are almost always followed by deep second wave corrections, sometimes deeper than the 0.618 Fibonacci ratio. This wave count expects a big deep correction downwards, and it should subdivide as a clear three on the daily chart (the alternate below expects a five down).
My biggest problem with this wave count, and the reason I will retain the alternate, is the structure of intermediate wave (2) within primary wave 5. This is a rare running flat but the subdivisions don’t fit well. Minor wave C should be a five wave structure, but it looks like a clear three on the daily chart. If you’re going to label a running flat then it’s vital the subdivisions fit perfectly and this one does not. This problem is very significant and this is why I judge the two wave counts to be about even in probability.
Intermediate wave (5) looks like a zigzag rather than an impulse, and has a corrective wave count. This is also a problem I have with this wave count.
Intermediate wave (2) is most likely to subdivide as a zigzag, which subdivides 5-3-5 at minor degree. When this 5-3-5 is complete then how high the following movement goes will tell us which wave count is correct.
It is possible to move the degree of labelling within intermediate wave (2) all up one degree and see it as over. However, I will not publish this idea as it is extremely unlikely and publishing it would give it undue weight. That would see intermediate wave (2) as far too brief and too shallow in comparison to intermediate wave (1). Only if price breaks above 1,251.97 will I seriously consider this idea.
Intermediate wave (2) of this new cycle degree trend may not move beyond the start of intermediate wave (1) below 1,131.09.
From January 23rd onwards, since the expected trend change, volume is highest on down days. This supports the idea that we may have seen a trend change and the trend is now down. Volume for Silver is even clearer, with a big spike on the down day there for 29th January.
The two hourly charts below work for both daily wave counts.
Main Hourly Wave Count
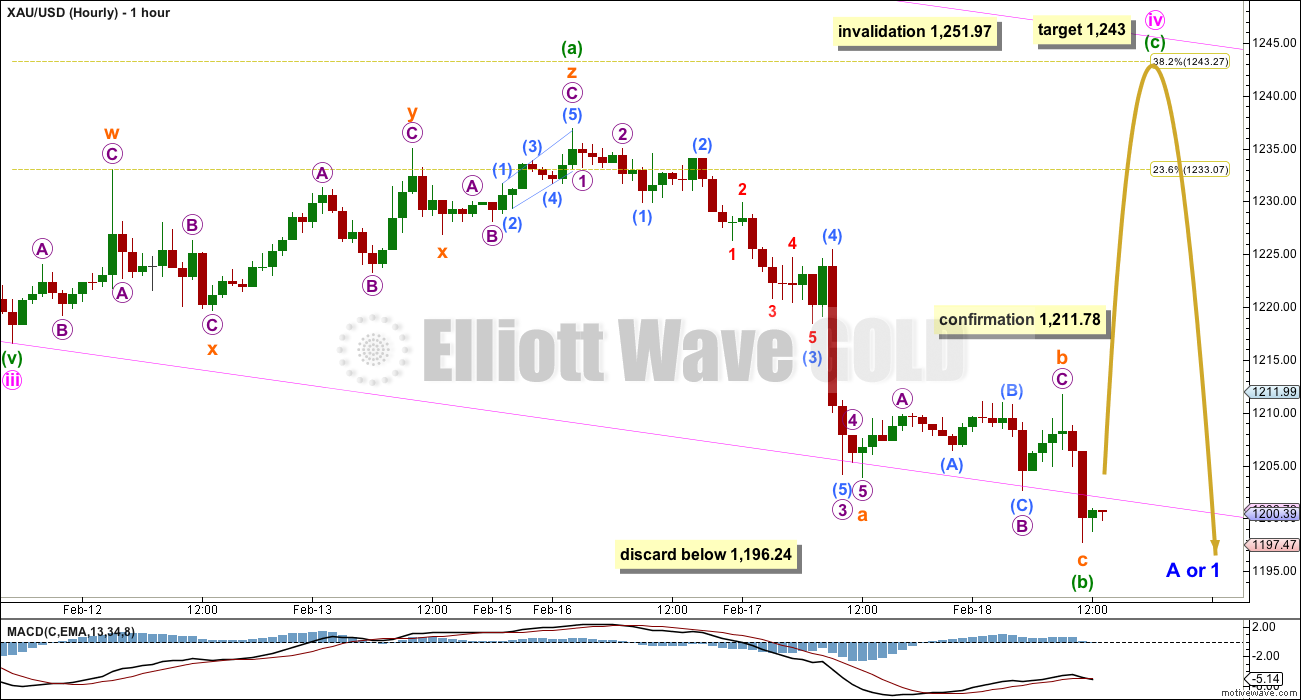
Further downwards movement confirms that the last correction must be a rare triple zigzag, which is the only structure now that fits and has the right look.
The only difference today between this main wave count and the alternate hourly below is the degree of labelling within minute wave iv. This main wave count sees minute wave iv as still an incomplete expanded flat correction.
Expanded flats are very common structures. They subdivide 3-3-5. The maximum common length of a B wave within a flat is 138%, but I have seen plenty of flats with B waves longer than this. There is no rule stating a maximum length for a B wave with a flat, but convention states when it becomes twice as long as the A wave the wave count should be discarded because the probability is extremely low. Minuette wave (b) would reach twice the length of minuette wave (a) at 1,196.24, and if we see a new low below this point I will discard this wave count in favour of the alternate below.
Minute wave iv has now lasted four days. It is possible that it may be able to complete in just one more day to total a Fibonacci five, or it may not exhibit a Fibonacci duration. The most likely point for minute wave iv to end is still the 0.382 Fibonacci ratio of minute wave iii at 1,243.
Minute wave ii was a deep double zigzag correction. In order to exhibit alternation it is still more likely that minute wave iv is an incomplete flat correction which should be shallow.
Minute wave iv may not move into minute wave i price territory above 1,251.97.
Alternate Hourly Wave Count
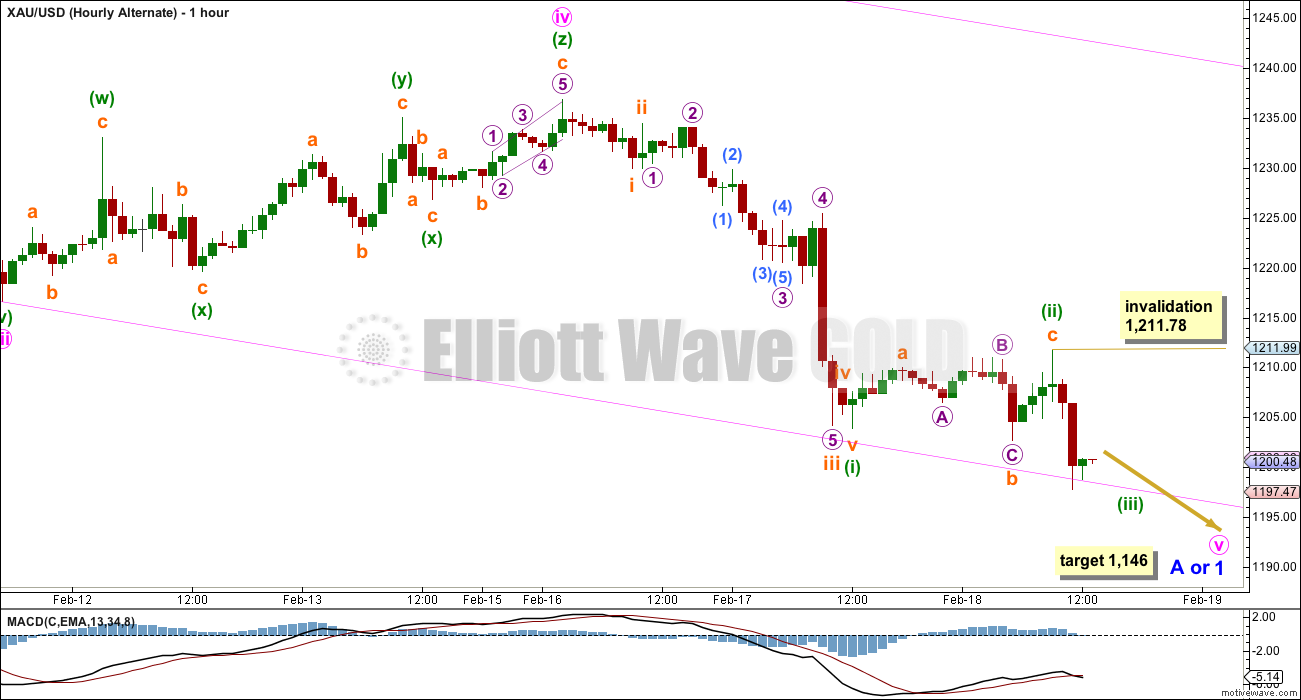
This alternate will become the only hourly wave count if price breaks below 1,196.24.
This wave count sees minute wave ii as a deep double zigzag lasting a Fibonacci three days, and minute wave iv a shallow triple zigzag also lasting a Fibonacci three days. There is alternation in depth but little alternation in structure. This is unusual for Gold.
Because minute wave iii was shorter than 1.618 the length of minute wave i, and because there is no Fibonacci ratio between minute waves i and iii, I would expect to see a Fibonacci ratio between minute wave v and either of i or iii, and I would expect minute wave v to be a long strong fifth wave typical of commodities. At 1,146 minute wave v would reach 1.618 the length of minute wave i. Minute wave v may break below support at the lower edge of the pink channel about minor wave 1 or A.
Alternate Daily Wave Count
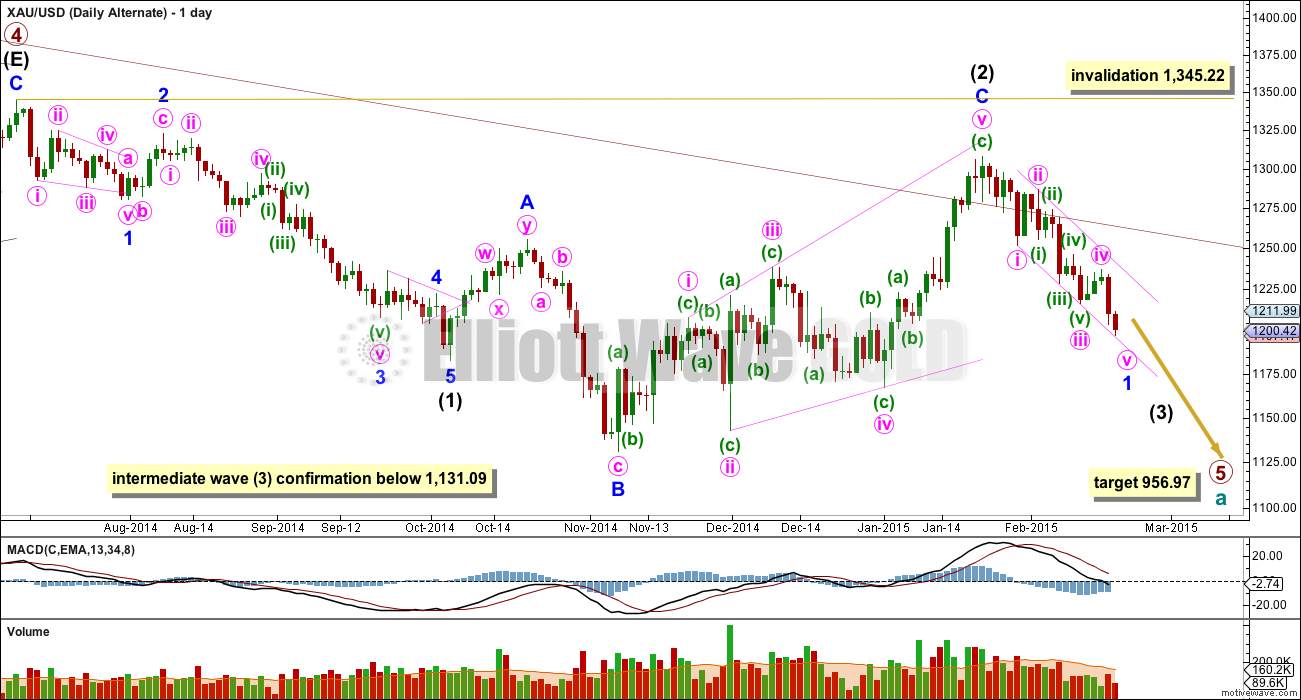
The maroon channel about cycle wave a from the weekly chart is now breached by a few daily candlesticks, and is now also breached on the weekly chart by one weekly candlestick. If cycle wave a is incomplete this channel should not be breached. For this reason and this reason only this wave count, despite having the best fit in terms of subdivisions, only has an even probability with the main wave count. It will prove itself if we see a clear five down with increasing momentum on the daily chart.
Draw the maroon trend line on a weekly chart on a semi-log scale, and copy it over to a daily chart also on a semi-log scale (see this analysis for a weekly chart).
Within primary wave 5 intermediate wave (1) fits perfectly as an impulse. There is perfect alternation within intermediate wave (1): minor wave 2 is a deep zigzag lasting a Fibonacci five days and minor wave 4 is a shallow triangle lasting a Fibonacci eight days, 1.618 the duration of minor wave 2. Minor wave 3 is 9.65 longer than 1.618 the length of minor wave 1, and minor wave 5 is just 0.51 short of 0.618 the length of minor wave 1.
Intermediate wave (2) is an expanded flat correction. Minor wave C is a complete expanding ending diagonal. Expanded flats are very common structures and ending diagonals are more common than leading diagonals.
This wave count has more common structures than the main wave count, and it has a better fit.
For this alternate wave count the diagonal is an ending diagonal for minor wave C. Within an ending diagonal all the sub waves must subdivide as zigzags. The fourth wave should overlap first wave price territory. The rule for the end of a fourth wave of a diagonal is it may not move beyond the end of the second wave.
Although Gold almost always adheres perfectly to trend channels, almost always is not the same as always. This wave count is still entirely possible. The trend channel breach is a strong warning that this wave count may be wrong and we need to heed that warning with caution at this stage. For this wave count once minor waves 1 and 2 are complete (which would be labelled minor waves A and B for the main wave count) minor wave 3 downwards should be very strong and extended, and would probably take price below 1,131.09.
A new low below 1,131.09 would confirm that a third wave down is underway.
At 956.97 primary wave 5 would reach equality in length with primary wave 1.
Intermediate wave (2) may not move beyond the start of intermediate wave (1) above 1,345.22. If this invalidation point is passed this wave count would be fully invalidated.
The short to mid term outlook for both wave counts is identical. The structure and labelling on the hourly chart is identical, so I will publish only the one hourly chart while the wave counts do not diverge.
This analysis is published about 02:10 p.m. EST.
Feb 19 is out.
Hi Lara, seems to be a tug of war between the Bulls and Bears. Is there a chance we could test yesterday’s lows? Ty
I’m going to let Gold lead here, not take the cue from Silver or GDX.
But yeah, I probably should rename the main and alternate, swap them over, and state the new main would have a slightly better probability than the other.
It does look like primary wave 5 is incomplete.
We really need to see gold price break below pivot/1207 to target 1200 and lower possibly 1195-93….
Anyone have a clue where gold is at right now? I’m stumped. Lara? Thanks.
The main hourly wave count was confirmed, and the alternate invalidated, when price moved above ,1211.78
I think it is either wave IV minute or wave 2 minuette within minute V. If it is IV then I will be looking for new highs of this correction and 1230 tomorrow. If this is 2 of V then I don’t expect new high. I just don’t believe in this expanded flat anymore and don’t expect 1243
I calculated .618 retrace of up movement yesterday )1223.08 – 1197.69 = 15.69 – 1,223.08 = 1207.39) would bring gold back down to 1,207.39 and gold just reached 1,207.33 at 11:06 am. I fugure gold should bounce from here if my calculations are correct???
I could kiss you Richard.
Yes. Once this move down looks like a clear three then a third wave up should begin.
It looks to me like gold still has one short move down to make it a clear three. Do you concur? Thanks.
Yes.
This double zig zag was 61.8 fibo retracement. Looks like a wave minute II. Could be that gold is now in 3rd minuette of minute V.
What will be wave count if gold below 1197?
It will be a fifth wave ending diagonal.
A live chat feed would be awesome on this site – I follow these comments live and would really benefit from people’s views as moves happened. For example, this move from 1223-1214 – does this affect our wave count? I am assuming not as we have progressed beyond the validation point.
However, I am not skilled enough yet to recognise/ appreciate the various waves.
This should be impulse wave. In my opinion it is not. It looks more like double zig-zag.
Agree but still think we move higher than $1223. I would consider just wave (a) and now in (b)
This is my view as well. My goal is 1230. Maybe tomorrow. I closed L @ 1218 and now wait.
What do you think about the wave count below?
Lara’s daily chart sure looks like a clean 5 waves down pending the decline from $1236-$1197 can be counted as an impulse which I think it can. If the alt count is correct, I would not expect wave 2 to retrace beyond 38.2% retrace or $1237ish. If the main count is correct, I would expect wave B to break the daily channel and hit $1252ish. I have no idea which count is correct so just need to watch price action.
But Lara said Gold almost always adheres to the trend channel. Then I don’t see it breaking above 1230. I think exactly this aspect should be now taken into consideration when evaluating possibilities. Then, if it doesn’t break above trend channel, the wave count should be changed.
Simply: It is too late now for 1243.
If wave IV has only begun from 1198, there will be choppy trading for the next couple of days (and the new low is possible).Hmmm
Almost always is not always
No, not this trend channel. I know that’s confusing!
When waves 1-2-3-4 are still forming then sometimes wave 4 doesn’t remain contained within the channel drawn using Elliott’s first technique. That’s why Elliott had a second technique.
In this case it looks like minute wave iv may overshoot this channel, and that’s okay. We’ll redraw it.
Once the channel is redrawn then the fifth wave is the wave which almost always adheres to the channel.
At this stage the channel can be a bit fluid, because fourth waves are like that. Annoying.
Trading tip to time the trade for DUST/NUGT/JDST/JNUG.
At 2:01 I used this and bought JNUG and unloaded some JDST.
The super momentum indicators are short time TSI (7,4,7) and log term TSI (25,13,7).
Having bullish divergence in intraday 15 min period it is a buy. Below is the chart of GDXJ.
I was watching all day long waiting for divergence and it happend.
The comment in the chart is some one else.
From the looks of price action I can deetrmine the expanded/running flat (ABC Structure).
1) In alt daily count why int A,B and C is not considered as completed expanded flat?
2) How do you determine before wave A is completed that following wave will be flat?
Yes Lara always provides several possibilities of developing wave unfolding.
Now main and alt hour wave is almost declared to be expanded flat. what made it to be expanded flat?
Lara, why didn’t you update your charts today based on your response to my inquiry if the GDX breaks $20.42, which it did today. See your full response below posted on 2/11/15. Based on your response, the alternate wave count now has higher probability and should be the new main wave count which see primary wave 5 not over. Given that both wave counts had even probability, shouldn’t your added confidence with the GDX invalidation increase the probability in Gold downward trend to now switch the charts? Please advise ASAP!
“If the GDX alternate wave count is invalidated by GDX moving below 20.42 then I would have added confidence in the Gold alternate wave count which sees Gold still in primary wave 5 down.
But no, it wouldn’t be enough to fully confirm the alternate for Gold.
Please let me know if GDX does break 20.42 and I’ll update my charts and publish for you.”
JAK
GDX $20.42 was not an exact deciding point that would change gold’s trends even though it was in writing. It was just a guesstimate. I had mentioned there was a $60 difference in gold as for GDX or Gold changing their main/alternate wave counts. GDX is not as accurate as gold as far as forecasting it with Elliott Wave. So today GDX going below $20.42 doesn’t make any difference at all in deciding gold’s main/alternate wave count. GDX charts are also an added bonus and not a requirement so Lara will get around to it when she can now that you have asked.
I know your Lara’s biggest fan, but why would Lara make that specific comment about updating the charts when it breached the invalidation point and that she has added confidence in the trend down of primary wave 5 now? I would leave that for Lara to answer.
As members, we pay for decisive accurate analysis and it seems, at times of trend changes, the analysis gets very cloudy and very muddy with Gold possibly going both directions with even probaility. As a paying member, I expect a strong opinion on the most accurate direction and not one of mixed opinion. As you mentioned yourself, the GDX is an added bonus and it just might have clued us to the longer term trend of gold and I would be remissed not to mention this to the other members. I believe Lara is great at what she does, but she needs to be more decisive and less influenced by her readers. She is the expert, so let’s let her lead us in the right direction and not two directions based on EW fundamentals and facts. Bottom line, pick a direction with confidence based on your experience with the EW. After all, that’s why I’m a member. Lara, please take this as constructive feedback. Thanks.
Please realise that this is not FACT. If it was everyone would do it and we would only require one trade to be infinitely wealthy. While I am sure Lara really appreciates for $40 a month this covers the markets in the title G/S/O and is a daily update.
I am sure Lara would welcome the offer of a more personal service to meet your requirements. Please ask your PA to send over a 7 figure salary offer and I am sure it will be considered. If this is outside your budget, then may I suggest you put your dummy back in and appreciate that you get expert analysis every day for $40.
Please take this as constructive feedback.
Thanks
ummm…. actually the $40 a month covers only Gold. Silver and US Oil, and GDX, are extras. And I do them only when I have the time comfortably.
That’s the nature of trend changes. Sometimes I can give you a decisive answer, but like all TA a trend change requires confirmation. I have not come across a TA method yet which can pick the price point at which the trend changes, I don’t think such a method exists.
So I am to provide you with specific price points which confirm or deny a trend change. That’s the best I can do.
And I’m also trying to provide you with a road map of what should happen next.
So use your own TA to supplement my EW analysis. That should help you decide on probability for my wave counts.
Patience grasshopper .
🙂
I’m letting Gold lead. I’m never going to let GDX determine the probability of a Gold count, it’s just not reliable enough.
Also, after I did the analysis for Gold and S&P I went surfing. And didn’t have time to do any GDX analysis.
I need to surf for my soul.
*edit to add: I’ve tried to state that I consider the main and alt daily counts to have about an even probability, but I guess the labelling of “main” and “alternate” muddies that message
I took profits 3 times yesterday on JDST to close out my position. Bought one portion of Jnug late yesterday and another today after the break up. Option expire this Friday and max pain looks to be GDXJ in the 27’s. Still long oil and picked up a position in TVIX also.
Long oil is a good trade. I do have TVIX hoping for market to correct here. Small JNUG but mostly waiting for DUST and JDST short gold DGLD/DSLV for long howl .
We may have a buying opportunity in oil in the morning. Tight stop though, there is a trendline in oil etfs that will probably get tested tomorrow based on futures right now.
Great trading with JDST. Congratulations.
That last JDST position which was a full position took a long time to make 8%. I held that for almost a week, and was down about 5% on it for a day or two. Lara’s work makes it easier to hold and be patient.
What etf is traded for OIL? UWTI,OCO, SCO,DWTI???
UWTI is what I use.
With gold movement above $1,211.78 the Main hourly wave count is validated going up to 1,243.27 in 1 day or longer and the alternate hourly wave count is invalidated. If it takes longer than a day it is probably most likely going to overshoot the upper trend line. As per Lara.
It is hard to figure when 1243 will be reached. If it does during NY trading hour than trading is easy.
If 1243 or the target is reached prior to NY market opening GDX will open with gap down because gold will be already in wave v and tanking.
Stay short and as appropriate add more shorts once the target is reached. Long side trade is done and risky.
Papudi – I understand this approach IF gold halts at 1243. Without wanting to place doubt in your mind, there are a number of analyst projecting a strong move above 1243.
Hi Richard. I hope you can clarify, what will follow each of the two scenarios you’ve described above? Thanks.
Once gold hits $1,243.27 or overshoot.
What will follow is.
“Once minuette wave iv circle is complete, wave v circle down probably will be quite strong.” down to A or 1.
Hi Lara, Silver has violated 17.3 and GDX 20.4. Is it time to see the alternate daily count as the main wave count?
Lara, is there any chance that minor 1 has ended and that gold is headed back to the 1260s (0.618 of entire move down from 1308)? Thanks.
I guess it’s possible…. but you’d have minute ii a double zigzag and minute iv a triple, and you’d have minute v looking like a three on the hourly chart….
and the whole thing would fit into the base channel
very unusual
I’ll take a closer look… but I have a really big problem with that idea
Gold may top on Friday and close down for the weekend. Just speculating : Thursday a green candle and Friday doji or inverted hammer a reversal candle.
Is there any fib for duration of this wave up??? Need help?
Lara , what about an alternate count where we just completed Minuette V at 1197 and are just now in Minute IV . This is the count you had a week or so a go . Has this been completely discarded and disproved ? I like your count better because I am hoping to catch a strong 5th wave down but just wondering if there is any chance of my alternate possibility .
For clarity , it should say “I like your current count better ..” .
the downwards wave for minuette wave (v) would look like a three…. to add to all the other problems; lack of alternation, doesn’t look right on the daily chart…. I don’t want to give this idea undue weight by publishing it
I guess my scenario would lack alternation between Minuette IV and Minuette II .
There is already confirmation for the Main Hourly chart above $1,211.78
Agreed Richard – does this suggest we are still looking for a strong movement up?
It means the Main hourly wave count is validated and the alternate hourly wave count is invalidated.
Read the analysis and watch the video as per strength of movement up.
Wouldnt be so sure. This upsurge looks a bit like abc spike…Id rather wait for new highs to increase positions.
I am nervous that we are yet to break back above $1212. I have help my JNUG position over night with the view of holding if we break $1212 over night or selling if we don’t. Good day today as bought low.
Why $1211.78 is considered confirmation?
it can’t be a second wave correction within a developing third wave down; this means that the last downwards wave down now looks like a three which fits the main wave count perfectly