
Another red candlestick was expected. However, a little upwards movement to 1,176 was expected first and this did not happen. Price moved sideways to complete a small triangle for the fourth wave correction and not a zigzag.
Summary: The trend remains down at minor and intermediate degree. The structure is incomplete. The short term target for minuette wave (iii) to end is at 1,142. I expect another red candlestick for Thursday’s session.
Click on charts to enlarge.
Main Daily Wave Count
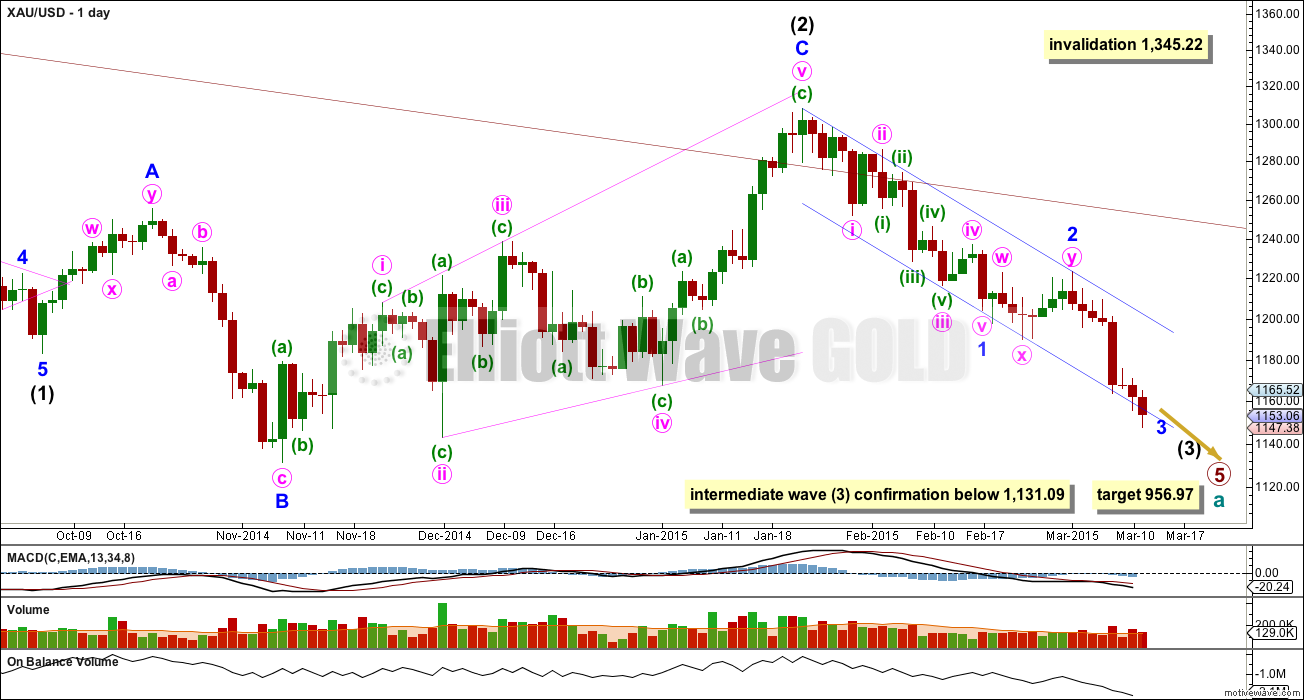
This main wave count sees Gold as still within a primary degree downwards trend, and within primary wave 5 intermediate wave (3) has begun. At 956.97 primary wave 5 would reach equality in length with primary wave 1. For Silver and GDX this idea, that the primary trend is down, is the only remaining wave count. This main wave count has a higher probability than the alternate below.
Within cycle wave a primary wave 1 lasted a Fibonacci 3 weeks, primary wave 2 lasted 53 weeks (two short of a Fibonacci 55), primary wave 3 lasted 37 weeks (three more than a Fibonacci 34), and primary wave 4 lasted 54 weeks (one short of a Fibonacci 55).
Primary wave 5 is now in its 35th week and the structure is incomplete. The next Fibonacci number in the sequence is 55 which would see primary wave 5 continue for a further 20 weeks, give or take up to three either side of this number. Although I am expecting primary wave 5 to be equal in length with primary wave 1 that does not mean it must also be equal in duration.
The maroon channel about cycle wave a from the weekly chart is now breached by a few daily candlesticks and one weekly candlestick. If cycle wave a is incomplete this channel should not be breached. The breach of this channel is a warning this wave count may be wrong, and so I will still retain the alternate.
Draw the maroon trend line on a weekly chart on a semi-log scale, and copy it over to a daily chart also on a semi-log scale (see this analysis for a weekly chart).
To see daily charts showing the whole of intermediate wave (1) from its start at 1,345.22, and an explanation of why this main wave count has a higher probability than the alternate, see the last analysis showing charts to that date here.
A new low below 1,131.09 would confirm that intermediate wave (3) down is underway.
Intermediate wave (2) may not move beyond the start of intermediate wave (1) above 1,345.22. If this invalidation point is passed this wave count would be fully invalidated.
Within intermediate wave (3) minor wave 1 is a completed impulse lasting 18 days. Minor wave 2 is a completed double flat correction which lasted 9 days, exactly half the duration of minor wave 1. Because this is a second wave correction within a third wave one degree higher I would expect it to be more shallow than normal.
Minor wave 3 may total either a Fibonacci 21 or 34 days, depending on how long the corrections within it take. So far it has lasted only 7 days.
Draw a base channel about minor waves 1 and 2. Minor wave 3 should have the power to break through support at the lower edge. Along the way down upwards corrections should find resistance at the upper edge. Copy this channel over to hourly charts. While the lower edge continues to provide support the alternate wave count should be considered as a possibility.
Since the top labelled intermediate wave (2) volume is still strongest on down days.
On Balance Volume continues to agree with the downward trend for price.
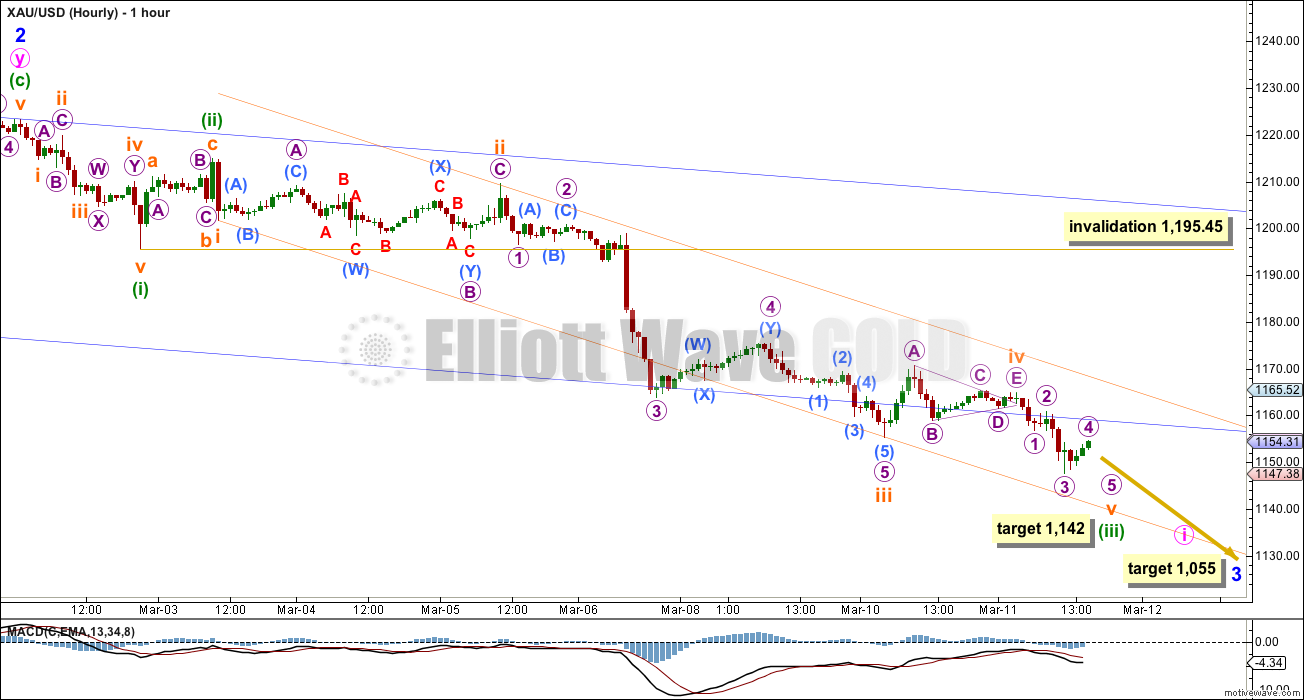
Yesterday’s analysis expected subminuette wave iv to complete as a quick zigzag up to 1,176. This did not happen as price moved sideways before continuing down. I had failed to consider other structural possibilities which would still provide alternation with the flat correction of subminuette wave ii.
Subminuette wave iv is most likely complete as a regular contracting triangle. Micro wave E overshoots the A-C trend line, which is less common than an undershoot of the trend line but perfectly acceptable (E waves either undershoot or overshoot that line).
So far within subminuette wave v it looks like an incomplete impulse. It will remain most likely incomplete while micro wave 4 remains below micro wave 1 price territory. If price moves above 1,156.84 then I would expect that subminuette wave v was actually over and minuette wave (iii) would also be complete. Minuette wave (iv) would at that stage be underway.
At 1,142 minuette wave (iii) would reach 2.618 the length of minuette wave (i). As soon as the final fifth wave of micro wave 5 could be seen as complete I would expect Gold to begin another fourth wave correction.
Minuette wave (ii) shows slightly on the daily chart, but it has no green candlesticks or doji. Minuette wave (iv) is unlikely to have green candlesticks or green doji for the wave count to have the right look at the daily chart level. Minuette wave (iv) may have a red doji and still have the right look.
Minuette wave (iv) is most likely to end within the price territory of the fourth wave of one lesser degree, between 1,155 and 1,171.
Minuette wave (iv) may not move into minuette wave (i) price territory above 1,195.45.
Subminuette wave v may be contained within the orange channel drawn about minuette wave (iii). Minuette wave (iv) should break out of this channel with upwards movement.
When minuette wave (iii) is over then the channel must be redrawn about minuette waves. Draw the first trend line from the end of minuette wave (i) to wherever minuette wave (iii) ends, then place a parallel copy on the end of minuette wave (ii). Minuette wave (iv) may find resistance at the upper edge of this channel.
Minuette wave (ii) was a quick and deep 0.70 zigzag. Minuette wave (iv) should show alternation so should be shallow and sideways. Draw a Fibonacci retracement along the length of minuette wave (iii). If the 0.236 or 0.382 Fibonacci ratios end within the target zone of the fourth wave of one lesser degree then that Fibonacci ratio would provide a target for minuette wave (iv) to end.
Minuette wave (iv) is most likely to be a triangle, flat or combination. These are sideways structures. It should be choppy and overlapping, a typical corrective movement.
Looking ahead further, when minuette wave (iv) is complete then one final fifth wave down for minuette wave (v) will complete the entire structure of minute wave i, which is only the first wave within minor wave 3. At that stage minute wave ii should unfold, should show up clearly on the daily chart, should last a few days, and may be relatively shallow. This is the point at which the main and alternate wave counts will diverge, and the price point to differentiate them will be 1,223.33. Minute wave ii cannot move beyond the start of minute wave i. A new high above 1,223.33 would invalidate the main wave count and confirm the alternate at that stage.
The mid term target for minor wave 3 remains the same at 1,055 where it will reach 1.618 the length of minor wave 1. When minute waves i through to iv are complete I can add to the target calculation at a second wave degree, at that stage this target may widen to a small zone or it may change.
Alternate Daily Wave Count
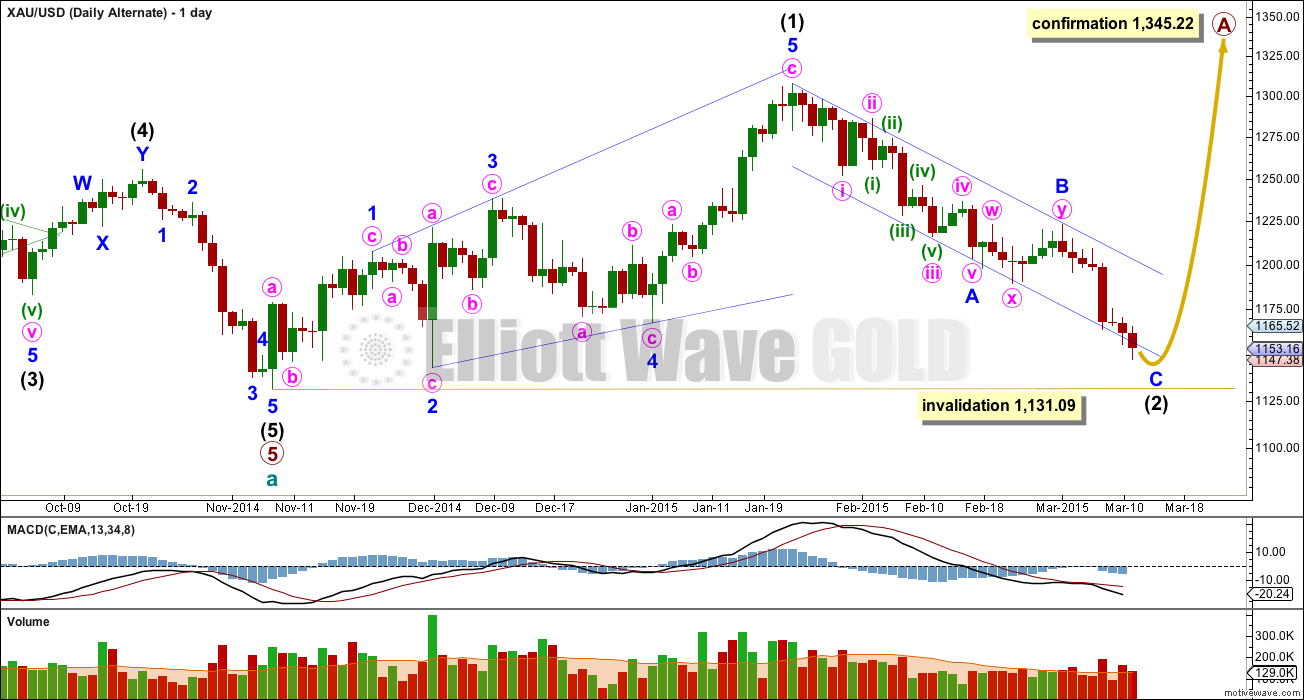
At this stage I judge this alternate wave count to have a lower probability. The structure of downwards movement, and momentum, will determine which wave count is correct over the next few weeks. At this stage they both expect more downwards movement so there is no divergence in the expected direction.
This wave count sees a five wave impulse down for cycle wave a complete, and primary wave 5 within it a completed five wave impulse. The new upwards trend at cycle degree should last one to several years and must begin on the daily chart with a clear five up.
The first five up may be a complete leading expanding diagonal. Within leading diagonals the second and fourth waves must subdivide as zigzags. The first, third and fifth waves are most commonly zigzags but they may also be impulses. This wave count sees minor waves 1, 3 and 5 as zigzags.
Leading diagonals are almost always followed by deep second wave corrections, sometimes deeper than the 0.618 Fibonacci ratio. Intermediate wave (2) is now deeper than the 0.618 Fibonacci ratio and the structure of minor wave C is close to completion.
For this alternate wave count minor wave C down must subdivide as a five wave structure. The hourly chart would see the subdivisions exactly the same as the main wave count above, so to keep the number of charts at a minimum I will publish only one. For this alternate at 1,159 minor wave C would reach 0.618 the length of minor wave A.
Minor wave C is overshooting the lower trend line. Sometimes C waves do this. It is close to an end. When minute wave i for the main wave count can be seen as a completed five wave structure then this alternate would see minor wave C as complete.
Intermediate wave (2) of this new cycle degree trend may not move beyond the start of intermediate wave (1) below 1,131.09.
This analysis is published about 04:10 p.m. EST.
March 12th Lara analysis done at 5:06 pm Thursday.
Lara, hi
You know I’m not a counter yet in EW and have only been in and out of watching the last two days on market but can’t help but notice movement doesn’t look right (except as consolidating NFP’s!). Is there any possibility that subminuette IV is not over yet? Not sure if a SM wave can go this long. I know my data charts display differently than yours. See below. Thanks.
Yes, that’s possible. I’ll chart it and take a closer look at the subdivisions for this idea. If it’s likely I’ll publish it as an alternate.
Lara
Has minuette wave (iv) ended? if not will it end overnight and minuette wave (v) down end Friday? Any possible clarity of ending target or range for either wave please?
I’m looking to buy in for Minute wave ii circle movement up a few days.
That’s the question I’m working on now.
If it was over at the last high then it was a zigzag. Minuette wave (ii) was also a zigzag, so not much alternation.
Or… it’s continuing as either a regular flat or a triangle.
I’m working on price points to determine what’s happening. At this stage a new high above 1,158.22 would indicate minuette wave (iv) is not over. While a new low may not confirm it is complete, that would increase the probability that it is complete.
Analysis will be out within the hour. Off to focus on it now.
TKL
Does this wave c has any fib ratio to wave a ? How high will this wave end from top of wave a?
First target 1159, if breaks it 1166, if breaks that 1177
The way we are going these days it won’t even hit the first target, sure feels like a 3 of 3 down, hardly any retracement these days!
I would think that part C has to be higher than part A 1166.66 is that correct? If so than remaining range would be 1166.66 to 1,171.
If this is part of a triangle, C will end before A. If it is a regular flat, C could end near A.
If you stick with Frost&Prechter than the most likely length is between 135% and 161.8% of wave a. For my count a started at 1150.07 at 01:45UTC and it is the start of the second structure (flat) in a combination. So target: 1170-1175. But: Combinations normally move price sideways. So there should be considered the poss. of a triangle with target c below 1166.
TKL
Like your running commentary like in sports play cricket match.
If you feel some turn is happening pls do not wait for some one to ask ?? just post yr comment for every ones benefits.
At a time i am lost what is happening and guessing only. But your guess is more calculated than my wild guess.
Thanks.
Yes, lots of helpful comments. Its great. Thanks, Tham, papudi & everyone else.
Bot JNUG right after Tham said wave b complete and going up in wave c to avoid truncation above wave a.
Hope it works out overnite.
I’ve made up for 2 weeks ago with some good trades on DUST past few days. Seems to be doing me much better than JDST in previous weeks 🙂 No plans for any longs yet unless/until alternative count starts to look more likely.
Thank you all for your kind comments. I find it easier to work with when I verbalize my thoughts as I trade during the session. It enables me to focus my concentration. And I hope it is beneficial to everyone. I apologize if I intrude on anybody’s privacy. I just hope that if I make a mistake I don’t mislead anyone. I welcome any comments, rebuttals or even rebukes. In that way, we can collectively nip the error when its devastating effects can be capped. It makes the trading hours happier, otherwise it will be a dull session because it will only be me versus the market.
I believe that prosperity should be shared.
I agree whole heartedly.
TKL play by play would be amazing. I can only imagine!!
Yes folks we are sliding into the end of wave b at 1148.69.
Now we’re loading up the bullish ETF’s and we are off in wave C heading for upper target of 1177, where gold switches gears and drops into reverse and now headed down in bear territory with minuette wave (v) and have home plate in sight at 1137. Then we sell our ETFs and prepare for a 3 day journey up in minute 2 circle loaded up with our favorite bull ammunition for an impulsive mountain climb to 1999 making sure to stay under 1223.33.
……………………………………………..
As it stands, would take a break below 1147 to flush out 1140…. I believe gold price ought to break below 1147 for Lara’s given target 1143-42… Then we have a break of both the Wednesday H 1164.3 / L 1146.5
1,142 was target for minuette wave (iii).
Minuette wave (iv) started last night when gold went above 1156.84.
The next bottom will be the end of minuette wave (v), minute i circle, which I would expect to be lower than 1142?????
Then minute ii circle up, which Lara will give us a target for and has a higher invalidation point of 1,223.33
Thanks Richard, hope to see 1142 then! Subject to a break above 1164-65, the upside appears restricted to 1166-67 with 1171-72 on the outside.
I believe that minuette wave (iv) ended at 1166.66 at 2:50 am. It looks like gold may continue down to a new low to end minuette wave (v) and minute i circle. It is now at 1151.08 at 12:21.
However what I am reading here is confusing. It sounds like minuette wave (iv) completed at 1166.66 but is only part A of ABC or a 3 part stucture or 3 options of structures. Now it sounds like minuette wave (v) structure is unknown.
I am curious if minuette wave (v) will be some quick structure down or some lengthy strange structure that tricks most people?
Does it look like minuette wave (v) down will end today at a new low to finish minute i circle? Then we can buy some bullish ETF for minute wave ii circle up as should last a few days.
Minuette iv is definitely ongoing as an ABC structure. A has ended at 1166.66 and B is nearing completion. I don’t think C will complete by today, maybe by tomorrow, earliest during the Asian markets tonight ET. In my experience, C waves last longer than A or B waves. And there is the possibility of a combination in which the first wave is W and not A. That would take even longer.
Either wave ii or wave iv is the time-consuming structure. In this case minuette ii was rather quick, so wave iv would be slow. That’s why I say it cannot have completed at 1166.66. Wave v’s are usually faster structures, normally as quick as wave i’s. Nobody can foretell what structure minuette v will take. It could be an impulse, or it could be an ending diagonal. Rarely, it could take the form of a zigzag. The only thing I am pretty certain is that it will terminate at a price lower than 1147.38, the end of minuette iii. That is to avoid a truncation.
Hope this helps.
Thanks Tham, that does help.
Maybe B part of minuette wave (iv) just ended at 1148.69 at 12:43 pm EST? Then part C began up?
I would guessing maybe minuette (v) to end below 1,142 since that was the target for minuette wave (iii).
Sorry guys. Just took a breather from my sleep as I don’t intend to trade minuette iv subminuette c. It might end in the Asian session and I could be caught.
Anyways, you are correct. Subminuette B ended at 1148,69. As this is close to 94 1% retracement of subminuette a, it looks like a regular flat is playing out. If so, I think subminuette c should rise by 1.0 or 1.382 of subminuette a. At 1.0, it should reach around 1168, and 1175.50 if it is 1.382. Subminurtte c should rise in five waves. Currently, it might have finished micro 1 at 1155.11 and going down in micro 2. The retrace looks like 1.0. If micro 1 is done, and micro 2 nearing completion, I reckon subminuette c and hence minuette 4 could be over before US market reopens tomorrow. I can’t wait to short it then!
Good luck trading, everyone. Now back to my sleep.
Very help for me. Thx
I’ll agree with everything you say here, except that a fifth wave may be a zigzag.
Frost & Prechter are pretty clear on this. Fifth waves may only be five wave structures.
Unless I’m totally missing something? Unless you can point me to the page in EWP which states they can be threes?
I know other people have written many other things about EW, but I would not accept any re-writing of the rules in F&P If anyone else contradicts F&P I’d go with F&P every time.
Hi Lara. I don’t recall saying that the fifth wave is a three. As far as I know, fifth waves must be fives. Flats are 3-3-5’s so it fits nicely.
You are right that the fifth wave of a diagonal may contain a five. What I meant was that it is very rare indeed for a fifth wave to be a zigzag by itself.
It was this comment: “Nobody can foretell what structure minuette v will take. It could be an impulse, or it could be an ending diagonal. Rarely, it could take the form of a zigzag.” which initiated my response. And yeah, if it’s a fifth wave within a diagonal then it can be a zigzag.
So that does make sense when it’s clarified. Cheers.
It looks like minuette iv possibly completed at $1166. It’s in proportion with minuette ii, but unsure if there’s alternation. Either way, a decent bounce is approaching quickly.
Target of 1143 for V wave? That is my target buy price for jnug.
Minuette ii was a quick deep 3-wave zigzag. If minuette iv completed, it would also be a quick 3-wave zigzag, albeit shallower. Exactly the same; no alternation save for the depth. That’s why Lara plumbed for a flat, triangle or combination. These are slower structures. I feel that the first three waves completing at 1166 is only the first wave of one of these three structures. The current pullback must necessarily be deep because otherwise the first wave would become a 5-wave structure which would void the flats and triangles (these always begin with 3 waves).
It is difficult to see this upwards movement to 1166 as a three. I would rather opt for a combination flat-flat or flat-triangle. So the current down move would be just not deep enough. At 1151 a possible B of the second flat would reach 90%. If it were a triangle we may bounce from here already.
I concur. That’s why I wrote that the rise to 1166 is only the first wave, the A wave. It comprises three subwaves and therefore a flat or triangle or combination is in order.
The road map provided by Lara is fascinating and quite awesome to say the least, playing out almost to the tee….! With 1148 holding, requires a break below 1156/pivot to seek 1148-40….Upside risk 1174-75 subject to a break above 1164-65…. Gold price has not really been able to test the previous 1168/67 lows other than a rejection from 1169 the other day…. So at CMP 1157/58 I am wondering what is the play, a Buy or a Sell? Thank you.
Excerpted from my trading journal.
“Kudos to Lara for being able to see the triangle in subminuette 4, even though it had been over for a while. On hindsight, it should have been pretty obvious. I made a sketch of the ongoing price movement and the triangle was staring me in the face. Moreover, the lengthy timeframe have given a good clue. Guess I have been too obsessed and mesmerised by the 1176 target. I thought that an expanded flat would fit the bill nicely. This is a good learning point. Never underestimate the hynoptic power of biases and prejudices. They severely cloud your judgement. I have violated a cardinal principle in engineering design : never assume.”
I do feel apologetic to any one of you guys if you had rigidly traded according to what I had thought was correct. It is always wise to use any information as background reference and form your own judgement. In that way, you have ownership for your own decisions.
I almost bought DUST after the close when I got Lara’s forecast as it looked cheap but I didn’t.
Now I can buy a reasonable quantity of DUST cheap today as long as it stays below invalidation point 1195.40 and appears to be following forecast. I wonder if gold will drop to end minute i (circle) today, although Lara didn’t give a target yet. Prosperous trading to all.
Anybody can estimate where minute i (circle) will bottom?
Minuette 4 is still underway. Until it completes it will be difficult to give an accurate figure for Minute 1 to end. The only possible value I have confidence in is a low below 1147.38, the actual end of Minuette 3 (since as rightly you pointed out, price rose above 1156.84). This is to avoid a truncated 5th wave.
Minuette 4 is currently unfolding as some form of flat or a triangle. So far there are three waves up. If price falls next, the flat/triangle scenario is correct. If it continues as a 5-wave structure, these will be voided.
TKL
How and when to know wave iv is complete ?
A new low below 1147 I suppose.
Hi papudi. Which wave iv are you referring to? As many posts, myself included, see it, Minuette 3 has ended at 1147.38. At the 5-minute chart level, a five wave down from 1164.93 can clearly be discerned, confirming the end of subminuette v. You can refer to my response to Richard for my thinking on the ongoing wave structures.
At 1147 minuette wave (iii) green ended and minuette wave (iv) is unfolding now. Once this wave is complete minuette wave (v) will begin to end the minute wave 1 circle of wave 3 circle. I am following Lara’s labeling on hour chart.
Thanks.
Thanks papudi for clarifying. Right now, it is difficult to place an accurate figure to Minuette iv. Lara said anywhere between 1155 and 1171. I would say that a flat should yield something closer to 1171 whereas a triangle should give something near to 1155. It is still too early to tell which structure is more likely. And not to mention the possibility of other structures should the first wave up becomes a five. That ought to yield zigzags which might go even higher, but no more than 1195.
I too was kicking myself for not outlining the possibility of a triangle when the fourth wave arrived.
I have had a bias against triangles over the years, mostly analysing forex and indices. But I’ve learned in this last 12 months that Gold actually exhibits triangles fairly regularly. Forex and indices don’t seem to.
At 1:48 am Gold moved above 1,156.84.
If price moves above 1,156.84 then I would expect that subminuette wave v was actually over and minuette wave (iii) would also be complete. Minuette wave (iv) would at that stage be underway.
Minuette wave (iv) should be shallow, choppy, overlapping and sideways and is most likely to end between 1,155 and 1,171 and may not move above 1,195.4. It is unlikely to have green candlesticks or green doji and may have a red doji.
When minuette wave (iii) is over then the channel must be redrawn about minuette waves. Draw the first trend line from the end of minuette wave (i) to wherever minuette wave (iii) ends, then place a parallel copy on the end of minuette wave (ii). Minuette wave (iv) may find resistance at the upper edge of this channel.
I am expecting a bounce..
reason
The chart below shows circles… circles on highs and lows on prices and highs and lows of stochastic indicator on weekly chart
I observed whenever stochastic is overbought and oversold price often not moved beyond that point at which the stochastic is overbought or oversold
and if we look at price now and stochastic.. stochastic is oversold and weekly support is at about 1140
so price may not move beyond 1140 and bounce
yesterday i posted that market will not break 1164 and will give a low of around 1148 and from there expecting a bounce round 1160. but mentioned that falling wedge is forming and often falling wedge breaks upwards..
Price moved above 1156.84. Minutte wave (iii) is over and (iv) has started based on Lara’s notes.
The Secret of DOW-SPX market. Grand EW analysis of 100 years DOW by Ron Rosen back in 2010.
The wave D is still up and going higher. Once the wave iv is complete wave v will take market to higher.
The same wave chart is in EWP book on page 164, fig 5-5 from 1920 to1977.
Interesting EW read.
http://www.321gold.com/editorials/rosen/rosen012513.pdf
Just to highlite important price points:
“Minuette wave (iv) is most likely to end within the price territory of
the fourth wave of one lesser degree, between 1,155 and 1,171.”
AND : “Minuette wave (iv) may not move into minuette wave (i) price territory above 1,195.45.”
Lara has provided great road map for gold. Thanks.
So I guess its good risk reward to short now as a its very close to hourly invalidation.
Yes possibly, but depends on duration of trade you prefer.
Minute wave i down of minor 3 is already nearing its end.
For me, a higher-probability and better risk:reward short trade is to to accumulate shorts around the potentially-ending fib retracement pts of minute wave ii, with SL=1225+, expecting to catch iii of minor 3 of int (3) down.
That’s for gold/futures, not miners which I don’t do, because gold & miners have different trendlines/cycles/setups, like we saw again today as gold fell while miners soared.
Thanks for your suggestion. I too have no interest in miners and just use gold on my fx trading platform (CFDs I think which are 23 hours a day.
I guess I got excited because the hourly chart followed Lara’s prediction and it had a very small SL. And it seems to be working.
Good onya. A win is a win. I tend to hold positions for longer than most ppl here, usually for many days or weeks instead of just hours. But I know colleagues who scalp
Lara, thanks for the details and extra clarification on near term possibilities to help us with trading choices near and long term.
Second that. I prefer Lara’s main count and appreciate the details the tipping point between the Main and Alt.
Until then, my analysis using different methodology indicates a modest turn starting later this week, as I posted previously, which seems to coincide with Lara’s minute ii.
Love it when interdisciplinary approaches come to the same conclusion as it boosts my confidence.
I prefer the main count as well because I think it fits the macro USD short squeeze related to debt derivatives needing to be paid back in dollars. When people need dollars, they sell assets to get them. When people really really need dollars, they sell a lot of assets fast.
Definitely so. The large leverage in the oil market (debt used to finance oil exploration and production) has yet to manifest itself.
Me too. Whichever way you slice it, I don’t see gold price soaring sky high, at least not in the immediate future. There is no real earth shaking event to cause such an eventuality in the near term. As I posted yesterday, my calculations shows the divergent point as at the end of Minute 2. To repeat, if price turns south after the supposed Minute 2 ends, the main count pointing to lower gold prices become more likely. And, Minute 2 is not too far away down the road. Logically then, gold price would not move that far north, as yet.
The only factor I could see to facilitate gold price rising is China. All others can easily be controlled by the west. (Don’t believe the media hype concerning currency debasement, deflationary fears et al. I believe there is an ulterior hidden agenda behind all these). China is bent on becoming the world leader in the gold market, in the same way as it cornered the dysprosium and terbium rare earth markets not too long ago. The Shanghai exchange has increased its profile of late. Once it is comfortable, it may open the door to foreigners. And it is lucrative because all purchases have the full backing of physical gold, unlike Comex and LBMA which are more or less worthless paper gold. The first step is getting a seat in the London Gold Fix which I think they should pretty soon be able to. Even then, my gut feel is that China will still go with the flow. Lower gold prices benefit them most as they can continue loading up on physical bullion. Once they have enough, they will manipulate the price to rise.