
Downwards movement invalidated the hourly Elliott wave count and was unexpected.
Summary: The situation is unclear for the bigger picture. For the short term, I have a bull and a bear wave count which both expect more downwards movement. The target for the bull wave count is 1,157 to complete an expanded flat correction for minor wave 2. The target for the bear wave count is 1,059 for minor wave 3 down. The bear wave count requires a new low below 1,131.09 for full confidence. The bull wave count will require a new high above 1,224.35 (after minor wave 2 is completed) for confirmation. The depth, momentum and volume of this downwards wave may indicate which wave count is correct, bull or bear.
Click on charts to enlarge.
Bullish Wave Count
I must judge this bullish wave count to have an about even probability with the bear wave count at this stage. Both have problems and both have points in their favour.
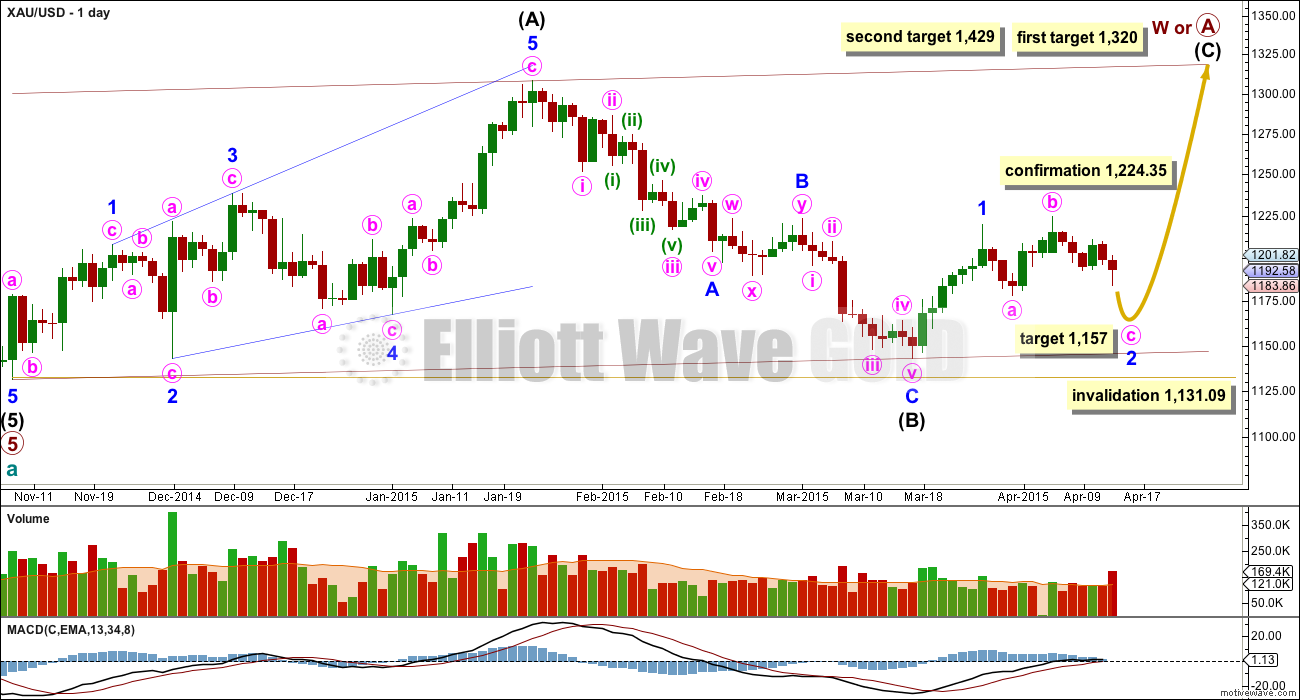
There are more than thirteen possible corrective structures that cycle wave b may take. At this stage it is unclear what degree to label this big movement. Primary wave A (or W) is an incomplete zigzag.
It is also possible that primary wave A will subdivide as a five wave impulse if cycle wave b is a big single zigzag. This idea would relabel intermediate waves (A), (B) and (C) to intermediate waves (1), (2) and (3) within primary wave A trending upwards. The length of this current upwards move labelled intermediate wave (C) on the chart will indicate if this scenario is possible.
Cycle wave b may be a flat correction where primary wave A is a zigzag. Cycle wave b may be a triangle where primary wave A is a zigzag. Cycle wave b may be a combination where primary wave W is a zigzag. Cycle wave b may be a double zigzag with the first in the double, primary wave W, incomplete.
When the big zigzag now labelled primary wave A is complete, it is also possible that cycle wave b could be over there with the degree of labelling within it moved up one degree.
When intermediate wave (C) is a complete five wave structure alternate wave counts will be required to manage the various possibilities of cycle wave b continuing.
The upwards wave labelled intermediate wave (A) fits only as a five wave structure, a leading expanding diagonal. Within a leading diagonal the first, third and fifth waves are most commonly zigzags, and the fourth wave should overlap first wave price territory.
Because intermediate wave (A) subdivides as a five, intermediate wave (B) may not move beyond its start below 1,131.09.
At 1,320 intermediate wave (C) would reach equality in length with intermediate wave (A). If price keeps rising through this first target, or if when it gets there the structure is incomplete, then I would use the second target. At 1,429 intermediate wave (C) would reach 1.618 the length of intermediate wave (A).
Because intermediate wave (A) is a diagonal then it is highly likely intermediate wave (C) will be an impulse in order to exhibit alternation. Intermediate wave (C) may end about the upper edge of the channel drawn about primary wave A.
This wave count has problems of structure within primary wave 5 of cycle wave a:
– within primary wave 5 intermediate wave (2) is a running flat with its C wave looking like a three and not a five.
– within intermediate wave (5) the count is seven which is corrective; either minor wave 3 or 5 will look like a three wave structure on the daily chart where they should be fives.
Yesterday, I had labelled minor wave 2 as over at the low now labelled minute wave a, and downwards movement from 1,224.35 as minute wave ii. That no longer looks right: minute wave ii would be longer in duration than minor wave 2 one degree higher, and would also breach the base channel about minor waves 1 and 2. What has a better overall look is seeing minor wave 2 as an incomplete expanded flat correction. The problems of proportion and breach of the base channel are resolved, and expanded flats are very common structures.
Within minor wave 2 expanded flat minute wave b is a 111% correction of minute wave a. At 1,157 minute wave c would reach 1.618 the length of minute wave a.
Volume for Tuesday spikes higher for a down day. This volume increase is still not larger than prior up days within minor wave 1, and so it indicates that the short / mid term trend is down, but the larger trend may still be up. For volume to indicate the bear wave count it needs to have a down day which has greater volume than the prior up day of 18th March within minor wave 1.
The bullish engulfing candlestick pattern within minute wave c did not indicate a bullish trend change. This may be because it did not come after a big enough downwards movement.
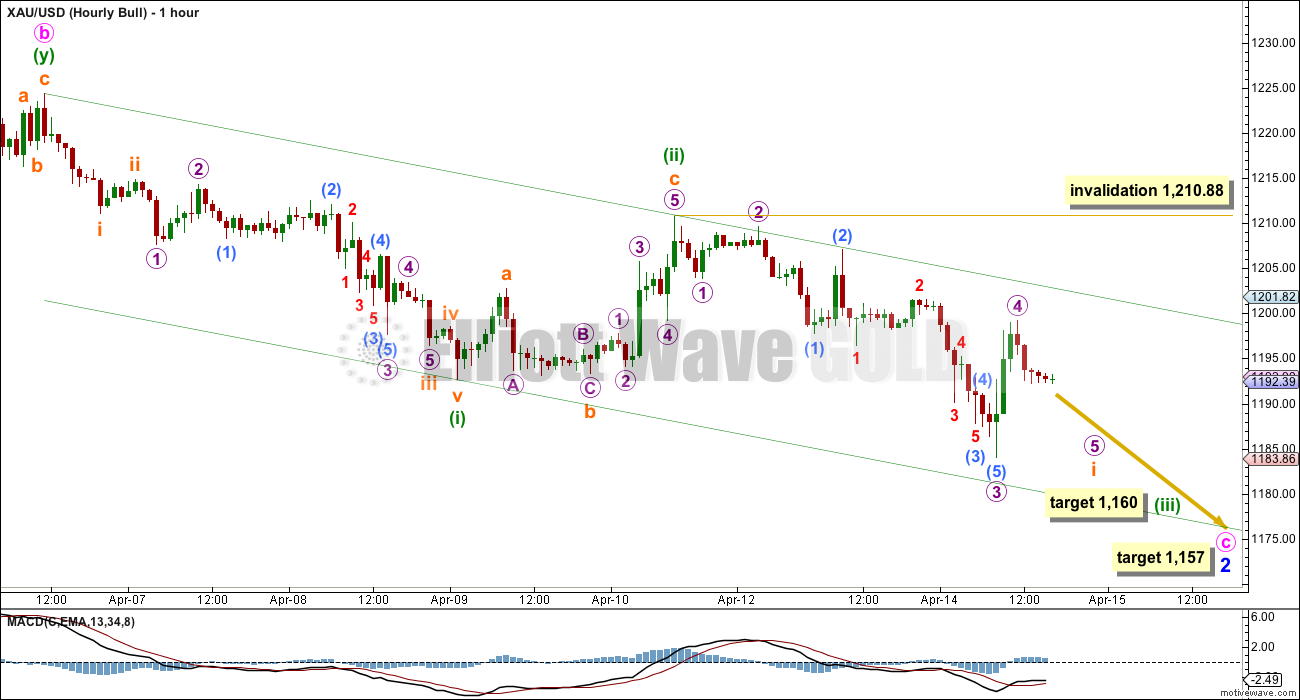
Minute wave c must subdivide as a five wave structure. Within it so far minuette waves (i) and (ii) are complete. At 1,160 minuette wave (iii) would reach 1.618 the length of minuette wave (i). This target expects a short fifth wave down to complete minute wave c as a five wave impulse.
The green channel is a base channel drawn about minuette waves (i) and (ii). It is likely that corrections shall find resistance at the upper edge, and the third wave down may have the power to break through support at the lower edge.
Within minuette wave (iii) when subminuette wave i is complete then a second wave correction upwards should unfold. It is unlikely to show on the daily chart as a green candlestick, so it should be over within a few hours. It is likely to find resistance at the upper edge of the green channel. Subminuette wave ii may not move beyond the start of subminuette wave i above 1,210.88.
Bear Wave Count
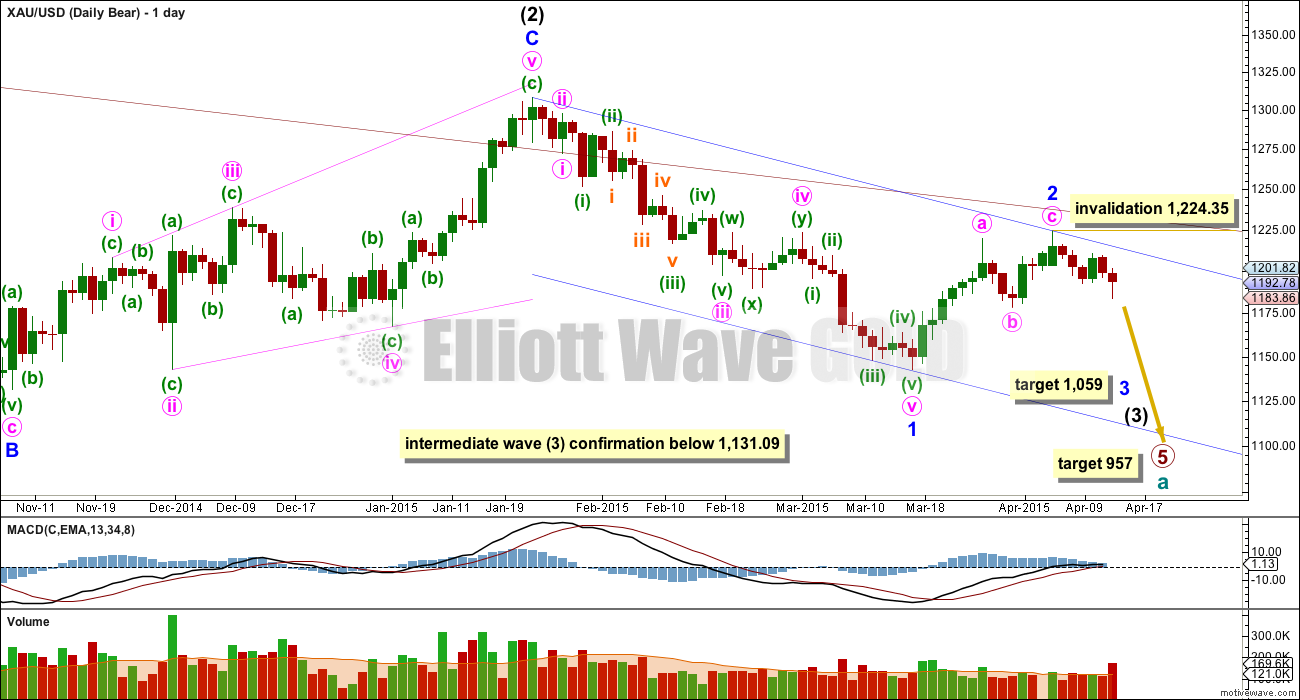
This alternate wave count sees Gold as still within a primary degree downwards trend, and within primary wave 5 intermediate wave (3) has begun.
At 957 primary wave 5 would reach equality in length with primary wave 1. Primary wave 5 may last a total Fibonacci 55 weeks. It has started its 40th week.
The maroon channel about cycle wave a from the weekly chart is now breached by a few daily candlesticks and one weekly candlestick. If cycle wave a is incomplete this channel should not be breached. The breach of this channel is the biggest problem with this wave count.
This wave count still has a better fit in terms of better Fibonacci ratios, better subdivisions and more common structures within primary wave 5, in comparison to the bull wave count above.
Within intermediate wave (3) minor wave 1 is a long extension. Within minor wave 1 minute waves iv and ii are grossly disproportionate, with minute wave iv more than 13 times the duration of minute wave i. This is the second big problem with this wave count.
For this bear wave count within intermediate wave (3) minor waves 1 and 2 must be over. To see minor wave 2 continue it would become too large, too long in duration, and it would again breach the maroon channel from the weekly chart. For these reasons I will now move the invalidation point lower for this bear wave count. Within minor wave 3 no second wave correction may move beyond its start above 1,224.35.
At 1,059 minor wave 3 would reach equality in length with minor wave 1. Both the first and third waves would be extended so the final fifth wave should be short and may not also extend.
A new low below 1,131.09 would provide full and final that intermediate wave (3) down is underway. Prior to that a new low below 1,142.82 would substantially increase the probability of this bear wave count.
The increase in volume for Tuesday’s session supports this wave count. If we see a further increase in volume for a down day, stronger than the volume for the up day of 19th March, that would further support this bear wave count.

The subdivisions on the hourly chart are seen in exactly the same way for bull and bear wave counts. Both wave counts expect a five wave impulse is unfolding downwards. The short term target is the same. At 1,160 minute wave iii would reach 1.618 the length of minute wave i.
Within minute wave iii minuette wave (i) is incomplete. Subminuette wave v may end at the lower edge of the orange channel drawn about minuette wave (i). At 1,174 subminuette wave v would reach equality in length with subminuette wave i.
When minuette wave (i) is complete this wave count expects a second wave correction for minuette wave (ii). For this bear wave count minuette wave (ii) may show on the daily chart as one or more green candlesticks or doji. Minuette wave (ii) may not move beyond the start of minuette wave (i) above 1,210.88.
This analysis is published about 05:18 p.m. EST.
I think Lara is doing just fine . As far as I can tell , she makes decent attempts to find TA support for her count . But the more TA you add , the more doubt will creep in to the count . You can always find pieces of TA that will contradict the count . Always . Her job is to give objective counts . It is our job to accept or reject the count individually and by process of elimination to find the best solution . EW is like chess , you have to be able to think a few moves ahead . I don’t necessarily think that is Lara’s job or that it needs to be .
The more Lara focuses on giving the most objective EW counts for gold , the better it will be for those of us that can do our own thinking .
Sounds good.
Thanks Alex. It has been a truly horrible week, probably my worst. If you want objectivity, I think you’ll like the next analysis published just now.
You had such a bad week I was thinking you actually lived in the People’s Republic of China….only results tell the truth to me.
Thank you very much for your patience. I expect it will come right, and I’ll end up again with just one wave count.
Gold has been within a consolidation phase since 27th March, sideways chop is always more difficult no matter what technical analysis methods you’re using.
As long it is correct.
For what it’s worth.
http://www.scotiamocatta.com/scpt/scotiamocatta/prec/pm_daily.pdf
Avoid Prospector’s malware.. Do not upload.
Lara
Can you please add some of your
Chartered Market Technician® (CMT) Program
training to your analysis if possible?
I have been adding little bits here and there as I get more confident. I’ll be sitting level II in a couple of weeks.
I like OBV for the weekly chart, and I’m using volume more in daily analysis. I’ve just finished reviewing Nison’s candlestick book, but as that recent bearish engulfing candlestick pattern showed I’m not using his patterns correctly. I shouldn’t have picked that one out for you, it didn’t come at the end of a clear downtrend.
As my confidence with more traditional TA methods increases I will be using it more.
FOMC Beige Book is out. http://www.federalreserve.gov/monetarypolicy/beigebook/files/BeigeBook_20150415.pdf
I’m sorry Prospector, you really come across as a paid troll/*******
Please leave.
“Never argue with stupid people. They will drag you down to their level and then beat you with experience.” – Mark Twain
You only show up when it’s time to influence people.
LEAVE…
There are some people in the financial industry that look at both sides of an argument and make their decisions using realistic probabilities. The problem is you won’t hear many of this level-headed reasoning because it will get drowned out by the overconfident prognosticators that make their forecasts with complete certainty.
I have deleted comments following this post.
I will remind members to carefully read the comments policy, especially the “if you wouldn’t say it to your grandmother, don’t say it here”.
Impossible to have any confidence in this gold movement at this time. The law of averages has been broken with recent events as we consistently misjudge the market direction.
Moving into cash tomorrow regardless of losses.
Fed’s Bullard: Zero-Rate Policy Risks Asset-Price Bubbles.
http://www.newsmax.com/Finance/StreetTalk/federal-reserve-bullard-zero-rate-policy-asset-price-bubbles/2015/04/15/id/638623/
Here is my GDX hourly chart from a week ago without any new annotations or changes. I had amateurishly tried to place guesses on a 5 wave structure ahead. As you may have picked up, I don’t understand or attempt to trade using EW but use Lara’s analysis as another line of evidence to give me confidence in my trades at times. I do trade by looking at structure and picking out support/resistance levels that offer high rewards and low risks. I’m still long NUGT and JNUG since GDX was in the 18s and I don’t plan to take profits until resistance points are hit and shown to be in play with bearish structures. We got breakout today of the primary downtrend and we took out the last two swing highs. To my eyes the charts are undeniably bullish in the GDX context and anyone who takes stabs at DUST positions right now are either trading randomly or with extremely short timeframes (i.e. intraday).
Great job Mark. I’m 75% into my long position still, I almost pulled the trigger when JNUG was in the 17’s premarket the other day to add a little more but if rather wait for confirmation above 1211 then add.
I’m looking for a possible backtest into Friday, GDX options max pain appears to be in the 19.50-20.00 area, if it gets there that is where I will add.
Thanks MTLSD. JNUG is very interesting, particularly with today’s breakout. The massive volume in early March sure looks like a bottom and when viewed from 50,000 feet, the longer term upside for JNUG is intriguing following the month-long base we just emerged from.
Mark. I also really like your charts. They offer a nice alternative to EW. Do you think we will back test the trend line break before moving higher?
I really have no idea. If we did back test, I would be a buyer.
I predict 1250, then 1100.
Book it.
Lara did micro wave 4 end at high or 1204.74 at 2:10 pm EST?
Is gold really to correct down Now?
Is the target still at 1,174?
Are both hourly wave counts still bearish?
Numerous investors are thinking gold hit a near term bottom yesterday.
Negative US economy news pushed down the dollar and gold up and also oil jumped up and pushed gold up along with short covering and bargain hunting. A big surprise. I have to decided about my DUST, don’t have a lot but do I sell or keep overnight.
Thank you.
I think Gold is in a sideways small fourth wave correction ATM. I think at least one more small push up for a fifth wave is likely for the very short term.
I sold my GDX before the close for a small loss as I only had a small amount of it.
I think I will add more Technical analysis to my trades.
You said you had DUST before.
This upwards move on relatively high volume does not look like part of a C wave down. I’m going to have multiple alternate wave counts and publish all, using their invalidation points to determine which one is correct.
A break above 1,224.35 would confirm a very bullish scenario.
A break below 1,178.59 would confirm an expanded flat for minor wave 2, this is still bullish.
Only a break below 1,142.82 would confirm a bearish scenario, but that would still require a new low below 1,131.09.
Once I’ve had a closer look at hourly charts for alternate wave counts I can provide price points which are closer than these for earlier indicators of what’s happening.
At this stage it does look like a three wave down move has completed, so it’s possible that today’s upwards move is the start of a third wave. But that needs confirmation initially above 1,210.88.
USD/ Swissie popped .965 lets see if it holds?
I tempted to just stay in cash from now on and just catch the 3rd waves and then get out.
Supercomputers have turned EW into a lagging indicator from what I can see over the last week.
Finally some one told the truth. Yes HFT is a mess for analyst. They paint the charts and EW as well. PM is illiquid market which is easy.
It stands out as a trend to me Papudi.
3rd wave
1210.88 is still the magic number night now. Trend remains down as long as gold stays below.
4 strikes and you’re out…. Maybe 5 or 6
If the USD can climb and hold firm over .965 against the Swissie Gold should come down accordingly. conversely if if falls below .964 gold will move up.
Lara comments on correction up in the Hourly bull wave.
The green channel is a base channel drawn about minuette waves (i) and (ii). It is likely that corrections shall find resistance at the upper edge, and the third wave down may have the power to break through support at the lower edge.
Within minuette wave (iii) when subminuette wave i is complete then a second wave correction upwards should unfold. It is unlikely to show on the daily chart as a green candlestick, so it should be over within a few hours. It is likely to find resistance at the upper edge of the green channel. Subminuette wave ii may not move beyond the start of subminuette wave i above 1,210.88.
i think we will go up from yesterday ‘s low and break above 1224 but not to confirm the bullcount. it is interesting Lara said now the break above 1224 would give her confidence for the bullscneario but after we are done with the correction down for this expanded flat. what if we go higher from 1184? i hope she still will keep a bearcount if that would be the case. i think she is getting closer to what i can see in COT’s. i predict a last shallow rise to 1250 level or just sidewaymovement before we will see the next big drop down propably to new lows. but we could also go deeper before we take 1224. mybe we will not even take 1224 before next drop. as i said i expect 2-3 weeks more sideways-/ updwardmovement before the next drop will start. the rise of gold since 1142 is too weak relatively to longcontract build ups and the manipulators were raising shorts last 2 reports. a clear unerring signal it is not the time for big longs. silver the same plus is looking terrible general . i thnik im even brave enough to predict silver will not take 17.50 . GOOD LUCK AND ALL THE BEST
but propalby 1250 even could be to high for this last strenght in Gold before the next drop
If gold stops right here, the downtrend line from this month’s high is still intact.
USD is fighting out of the cellar with the CHF and the EURO is overbought
Gold just hit the upper trend line on 3 of Lara’s charts.
I sure hope they hold and gold peaked as I have DUST
US dollar is very weak today, looking for it to get stronger.
I don’t see gold as bearish for now….. We forgot yesterdays daily candle which is shooting star or hammer at daily support……. 1183
and today’s candle confirm yesterdays shooting star..
gold can retrace to 1194 1192 1190. for another bullish move
That’s what i am talking about… Gold can goto 1230-1235 from here….
Did you sell your dust yet?
This is no knock on Lara and I hope she finds humor in it. The minute she posted 2 counts which both required downwards movement, that’s the recipe for getting upwards movement which we are getting. I know she’s frustrated with gold as am I trading s&p 500. She is great at what she does. I have no clue what’s going on in gold but remained long after the bounce from $1183. The triangle idea is still viable.
One concern I have is how many subscribers are here and what power they have . Do you know what I mean ?
None unless the subscribers are trading billions which can move the market
Yeah you must be right . Don’t know what I am thinking . lol It is just it seems like if everyone is on the same page , it ain’t going to happen .
Not nearly enough to have any effect on the market.
Elliott Wave is not very popular, many traders see it as some kind of “woo”. So all the traders using Elliott wave are still not enough to affect the market, let alone the ones on this site.
You’re right, I’m incredibly frustrated with Gold at the moment.
Clearly at the moment I don’t have confidence in my wave count. I’m going to take the approach of considering ALL possibilities, no matter how unlikely they look. I’ll be publishing at least three wave counts today, and I’ll be using invalidation points to eliminate each one by one until we have just one left.
I think that’s the only way to approach this problem at this stage.
I’ll also be taking a close look at Silver and GDX today to see if I can get additional information on what may be happening with Gold.
US dollar is weak today and Gold just hit 1200.41 at 1:12 pm
What about Lara’s invalidation point at 1210.88
anyone notice the usdchf pair
With overhead resistance 5dma (1197.95), 50dma (1199.78) Gold price ought not to break above 1198.91 which would then open up upside towards 1207…
I think Gold sub-micro 2 up peaked at 1,198.00 at 11:00 am EST and is moving down in sub-micro 3 of (micro 5, sub-minuette wave i) which has target of 1,174 as per Lara. Then bounce up either a few hours or 1-2 days depending which hourly chart gold is in.
Gold just hit 1,198.00 at 11:40 am EST I think that was the end and peak of 5th wave up to end micro wave 4 up and now we start micro wave 5 down. Is that correct?
See my reply to you below.
According to Lara, micro 4 ended yesterday at 1199.10.
One of the quality traders I follow is saying that gold is topping, not trying to break through…he has been right on gold 90% of the time since 2013. He is a day trader BTW…
An update of last week’s GDX chart attached. Breakout. I can’t imagine being short via GDX-based equities here.
I am long still as well, pretty weak volume on this move up on the miner ETFs.
I think you and I are the only ones long here…it’s lonely.
and here’s how it looks EOD. 43M shares is pretty decent volume.
Here you go Bob, I went over the sub-waves from cycle A’s inception and everything fits nicely. There are some minor problems with truncations but no more, or less, than any other idea we have entertained. This idea solves many major issues we have encountered and its my main wave count.
Jaf, thanks for adding the detail and reposting. I think the count looks real good. I do have questions about your maroon trend lines. I see that you moved it up so that P4 could reach your target (1288?) without a breach? What’s the logic on that?
Also, I think we should “remind” Lara to get her opinion when she has time to review in detail as she stated.
Done.
I’ve charted that idea on a weekly chart and taken a closer look. I am very uncomfortable with the disproportion between primary wave 2 and intermediate wave (2).
Primary wave 2 lasts just 6 weeks, intermediate (2) lasts 40 weeks, almost 7X the duration. That’s a big problem.
The whole movement after primary wave 2 sits above a base channel drawn about primary waves 1 and 2. That’s quite a big problem too.
In the short to mid term we’d still be expecting a big fourth wave correction (my bull weekly wave count expects a b wave correction) to complete, so it doesn’t diverge from my weekly bull wave count at this stage.
Chart attached.
Thanks Lara. Appreciate your detailed look at this.
Sorry I didnt see your response till now… will look at it tonight but at a glance the disproportions are ugly.. granted. (just trying to think outside the box.. gold trades have been a struggle this year.)
Anyone have a wave count now please?
Based on Lara’s bullish hourly, we have not completed micro 5 (of subminuette i of minuette iii) and need to keep below 1197.90 (pmbulls prices) for that interpretation to be valid. If we hit 1197.90, things would seem more bullish, especially since we have had higher volume and greater momentum on the up moves than down moves during the last 27 hours (per pmbulls nonflash with volume).
Hi Richard. Back from some obligations. Just signed in.
Following Lara’s wave count (no difference whether bull or bear, they both are exactly the same until 1160/1159 which makes for easier monitoring), we are still in a long drawn-out micro 5. having possibly just completed sub-micro 2. Micro 5 must go below 1183.86 (end point of micro 3) to avoid a truncation. Lara gave a figure of 1174.
For me, I will enter a short when subminuette 2 ends. Nothing much to do at the moment but simply wait. May just decide to go to sleep.
Did minuette (i) end at 1189.02 at 8:29 am EST and now we are in a 5th wave up to finish minuette (ii) now?
Or is gold dropping down finally?
Since gold is lingering just beneath the upper edge of the green channel, I suspect it is still within a 4th wave. Gold should begin to drift down again once this sideways movement is complete.
Lara, do you still map the Kiwi?
Are you asking about NZD USD listed above in right column?
Yes. And trade it from time to time.
ATM I have a wave count with it in a second wave correction. I’m waiting for that to end to enter a short for a third of a third down. But I’ve been waiting for a while.
I won’t trade corrections.
Will post a chart later today. I also use a lot of trend lines, ADX, SMA and MACD to make trading decisions on the Kiwi.
I don’t really like the Kiwi but I am the first to admit that we may see a little bit of a bounce. I think this ultimately will be a nice selling opportunity, as it is highly leveraged to commodity markets which of course looks horrible in general right now.
I also like the US dollar in general, However, it looks as if the it might get a little break over the next session or two. I think this is a short-term phenomenon though, and I believe that it’s only a matter of time before the US dollar comes back again.
Inside an hourly descending channel. Right at the 20 MA and right at mid bollinger band.Slowly losing momentum. USD stabilizing. All the markets in the ++.No more technical news to set the herd astir, could be slow death by 1000 short covering long covering short paper cuts? Going fishing somewhere else today
At 9:58 Eastern gold is 1193.5 bid on Kitco. Anyone like to give short and midterm projection? Midterm means do we jump to bull or bear wave count?
Short term you already have a good answer from Lara. The direction is down. As for the medium term, I am strongly in the bear camp, and always will be, until gold breaks $1000. For awhile I thought that gold may reach as high as the $1240s before heading down again, but that possibility is quickly eroding.
Naturally gold ticked up a couple dollars as soon as I opened my mouth. Ha-ha Nonetheless, movement should stay contained within the channel.
I think GLD will be contained within the channel too but I suspect we are looking at different channels.
Updated: Empire State Manufacturing Index Falls -1.2 In April – Gold Spiked up $6 on this news,By Kitco News
Wednesday April 15, 2015 8:30 AM
http://www.kitco.com/news/2015-04-15/April-Empire-State-Manufacturing-Index.html
Is Gold going into a 5th wave up now?
Or is it going down now?
In case you haven’t noticed, we’ve seen a couple of GDX components break out the past couple of days. More should follow……
And the breakouts just keep on coming…here’s the GG chart I posted 5 days ago. Bullish structures were the DNA markers.
Nugt is looking real good, i could be wrong but it looks like it is in a third wave up, my target is 12.40.
That gap fill at $13 is my near term target.
Press Conference
https://www.ecb.europa.eu/press/tvservices/webcast/html/webcast_150305.en.html
wow who got stopped out on that one!
Press conference following the Governing Council meeting of the ECB in Frankfurt 2:30 p.m. CET
2.30 p.m.CET
http://www.dailyfx.com/forex/fundamental/daily_briefing/daily_pieces/top_fx_headlines/2015/04/14/USD-Breakout-Contingent-on-Retail-Sales-Tone-at-ECB-Meeting.html?CMP=SFS-70160000000NbUGAA0
USD Breakout Contingent on Retail Sales, Tone at ECB Meeting
there goes the EURO as rates go unchanged
uro: What Should we Expect from the ECB, Greece Today?
The European Central Bank (ECB) is scheduled to meet today, but what surprises should we expect to the group considering they only this past month activated their QE program? It is highly unlikely that they will announce any upgrades this early in the effort and no central bank would be so foolish as to shoot themselves in the foot by saying they are dubious by its uptake. Instead, we should look into rhetoric that clarifies where they will continue to purchase assets as sovereign bonds carry limitations. This may also be an opportunity to find an official bank view on Greece. Speaking of the troubled country, a 3-month bill auction will be the market’s opportunity to show its confidence.http://www.dailyfx.com/forex/fundamental/daily_briefing/session_briefing/daily_fundamentals/2015/04/15/Dollar-Skittish-Below-12-Year-High-Risk-Monetary-Policy-Themes-Heat-Up.html
I believe we will have a resolution in the next 30-60 min when the ECB meets and has a press conference. I’m uncertain what will happen, but I don’t think you can rule out a triangle yet if we pop towards $1215ish. It has a nice look on the daily chart IMO. If we break $1178/$1183, then Lara’s counts are definitely correct.
I do cautiously follow Lara day in and day out. After following and reading every writing, chart and watching every Gold video Lara has done since June 2013 I can say I have acquired a great respect for Elliott Wave. So even when it seems unlikely I am not surprised when gold does something unexpected yet forecast by Elliott Wave. I understand Elliott Wave is very complex and misunderstood and I appreciate Lara summarizing it everyday.
There is no doubt about the quality and high standard of Lara’s analysis. Subscribers are privileged to be receiving an outstanding daily in-depth and detailed analysis. Value that. Thank you Lara, brilliant work!
Thank you Richard and Syed for your patience.
This week has probably been one of my worst. So I’m actually surprised members have the patience to stick with it.
I’m changing my approach today to Gold because clearly my wave counts are wrong. I’ll be looking at ALL scenarios, and publishing them all. Then I’ll wait for price to eliminate them one by one until there’s only one left.
Mark – The way to look at candlestick formations are not in isolation. It has to speak to us about a story. Once a bullish candlestick is formed, it should decline a little bit and start consolidating to form a next big move
If it is just forming a bullish pattern and keeps declining leaving all support levels then you’ll only see cases that just happened now
Think about it, on Fri we had a bullish candlestick appearing on daily chart, what happened after that? price just fell down consistently and that shows momentum on buying side is missing. The story is not compelling for buyers to be more involved and support the up-move
Now my next piece of suggestion is on trend lines. While it is important to see channel break outs, break downs etc.It is the Elliott wave pattern that decides what’s next in queue
More than the previous Elliott wave count the current 5-3-5 zig zag pattern that Lara has presented today has a story built in it. Although she has mentioned the current decline as a 5-3-5, I disagree with her labeling to do with an irregular wave post the wave 1 completion. Never mind the end result is the same we will for sure see 1173 to 1167 levels. The reason is it is 61.8% to 70.7% retracement of the previous upmove
Incase you are still long, please wind up your long positions. Like I said before, decision is definitely again yours
Steve Nison in his book on candlesticks chart pattern mentions that just because a bullish /bearish candle appears that just means the trend is about to change. What ever the trend is stopped.
In this case the down trend has stopped. and wait for consolidation side way price action since bullish pattern. and we will see if it holds or break the trend line below to the target 1157.
I’m not sure why you feel like you need to save me from myself and coach me into taking different trading positions. I’m comfortable in my analysis and using that of Lara’s to inform my thinking. I’m doing just fine but thanks for your pleas to change course. Good luck with your short positions.
If you look at the 4 hour period gold chart it has put in a bullish engulfing.
Lara is correct that gold may move slightly higher in short term.
Wonder what trade V W is putting based on the today’s report: Short or Long?????
I am flat for now.
Here is the 4 hr chart, including the bullish engulfing candle. Looks like a reasonable channel too. http://bit.ly/1ECOlwI
and here with fib retracement/projection….interesting fit. http://bit.ly/1FHTOhP
Thanks for the chart. Great looking chart. Gold need to stay above the channel It looks three point reversal channel. 4th point is around 1230+. Unless gold break down here below the green candle.
Hi, Papudi. I assume you mean me when you say VW. And just for reference, I’m an amateur trader, nothing special about me…before the close, I initiated positions in DSLV and JDST. They are not as large as I usually get due to uncertainty. I figure I can hold them and still trade against them if we get a surprise, but I don’t think I will close them unless the bearish wave count gets invalidated. I intend to exit these positions once we get near the projected target of 1174.
thanks VW. Some members have developed a good sense of what action to take from daily reports. I have still not have had that sense. May be I am too tempered.
Added to my positions…hope to see gold weak soon…
Sentiment: Liquidate longs, initiate shorts although ADX is weak for the downside and Gold price remains a little bottomy…. Today expecting pullback / short term decline within next few bars; momentum and ROC are bullish, upside move is likely, got to watch out for that!
Mark – If you remember, I mentioned to you that the structure more likely is a bearish one and with this downtrend confirming it. You’ll more or less see more selling pressure and gold is not likely to see the previous high until we see the end of wave 2
Yes, how could I forget you mentioned that?
sorry for the rant!
H.R.24 – Federal Reserve Transparency Act of 2014
http://www.federalreserve.gov/bankinforeg/srletters/sr1402.htm
Its supposes to keep the heard from causing a stock market stampede at lift off.
Last but not least. Don’t believe the hype. Interest rate hike is coming sooner or later. Gold has been on a downward trajectory since 24 July 2011 and the hike is the only thing that can bring it to the real bottom? Lara says “At 957 primary wave 5 would reach equality in length with primary wave 1. Primary wave 5 may last a total Fibonacci 55 weeks. It has started its 40th week. + or minus 2 weeks ” So I’m looking for late June or July rate hike just like half of the FMOC Board keeps telling us ( Transparency ). What do you think?
It’s all in the charts. If you can tell where the charts are going, you will know when the rate hike is coming. The smart money knows. If the alternate pans out, I’d say you are right
Commitments of Traders (CFTC)
http://www.scotiamocatta.com/scpt/scotiamocatta/prec/pmcftc_weekly.pdf
Also tracking their FX report is very important. Suisse tracks gold better than any currency bar none.
http://www.gfx.gbm.scotiabank.com/Chart_Feed/FX1.pdf
This report has helped me judge which wave count to favor. I hope it helps.
http://www.scotiamocatta.com/scpt/scotiamocatta/prec/pm_daily.pdf
I am admittedly an EW newbie and it will take me a while to understand the system/process but is there something in EW that prevents this GLD channel from continuing up from here? All I see is a bullish intraday flag structure within a channel. I think I need to find an EW book so I can start to grasp this.
THE book is “Elliott Wave Principle” by Frost & Prechter, 10th edition (or later).
EW probably does not prevent the GLD channel continuing up from here. Lara is saying that is unlikely. However, if GLD does continue up in that channel, Lara will adapt and figure out the EW structure that matches the behavior.
Thanks….that’s helpful.
GDX near the top of the Selling on Strength list, but GLD is near the top of the buying on weakness list. I guess we aren’t the only looking for answers.
Lara,
In a previous update just a few days ago, you were looking for this expanded flat to create a new low just below 1178, with a target of 1172. Is that still a possibility or does that not fit anymore? Thanks.