
In line with Gold analysis, I have a bull and a bear wave count for Silver. Price will tell us which one is correct, but before that happens structure and volume will indicate which is more likely.
Click charts to enlarge.
Bull Wave Count
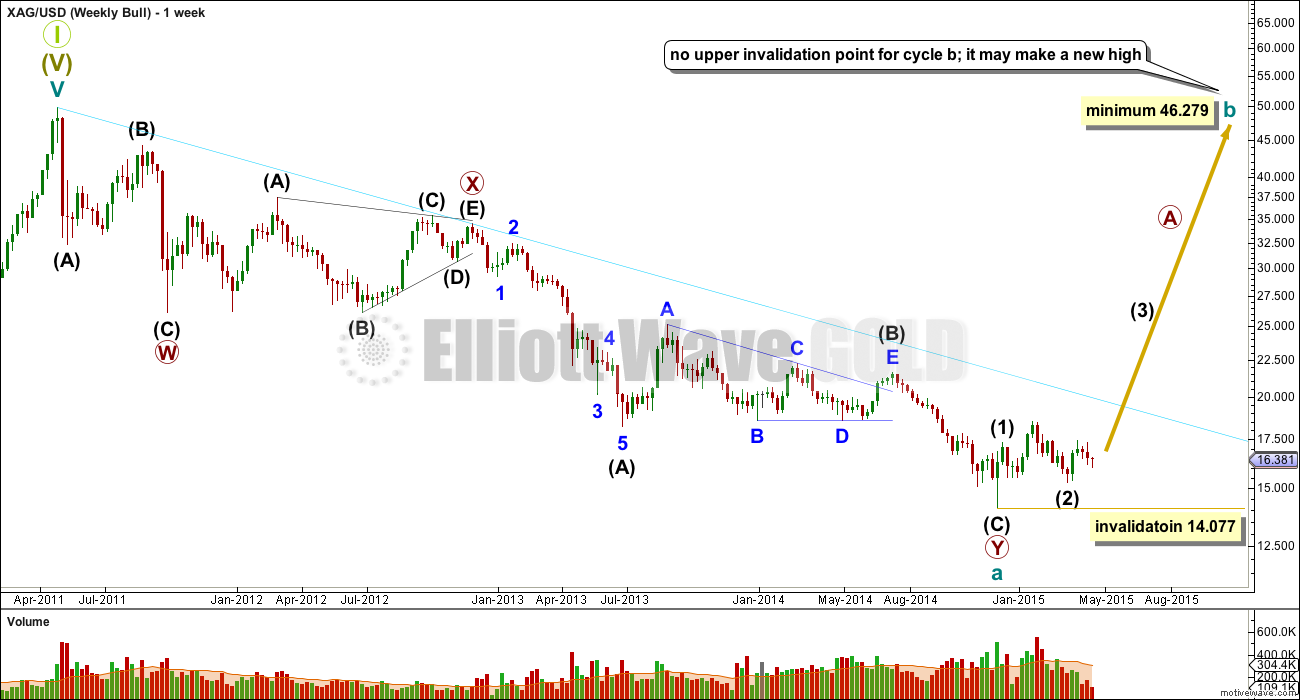
If cycle wave a is over and Silver, Gold and GDX have all recently seen cycle degree trend changes, then importantly for Silver cycle wave a subdivides as a double zigzag.
A double zigzag is a multiple, and the maximum number of corrective structures in a multiple is three. Any wave count which labels W, Y or Z as W-X-Y within them is invalid. W, Y and Z waves may only be simple corrective structures labelled A-B-C (or A-B-C-D-E in the case of a triangle).
Super Cycle II may not be a multiple and must be a flat correction. Within a flat correction the A wave must be a three, and a double zigzag is classified as a three.
Within a flat correction cycle wave b must retrace a minimum 90% the length of cycle wave a at 46.279.
Within a flat correction cycle wave b may make a new all time high above the start of cycle wave a, as in an expanded flat.
The most likely structure for cycle wave b to take price that high is a zigzag.
If cycle wave b is unfolding as a zigzag then within it primary wave A should be a five wave structure, either an impulse or a leading diagonal.
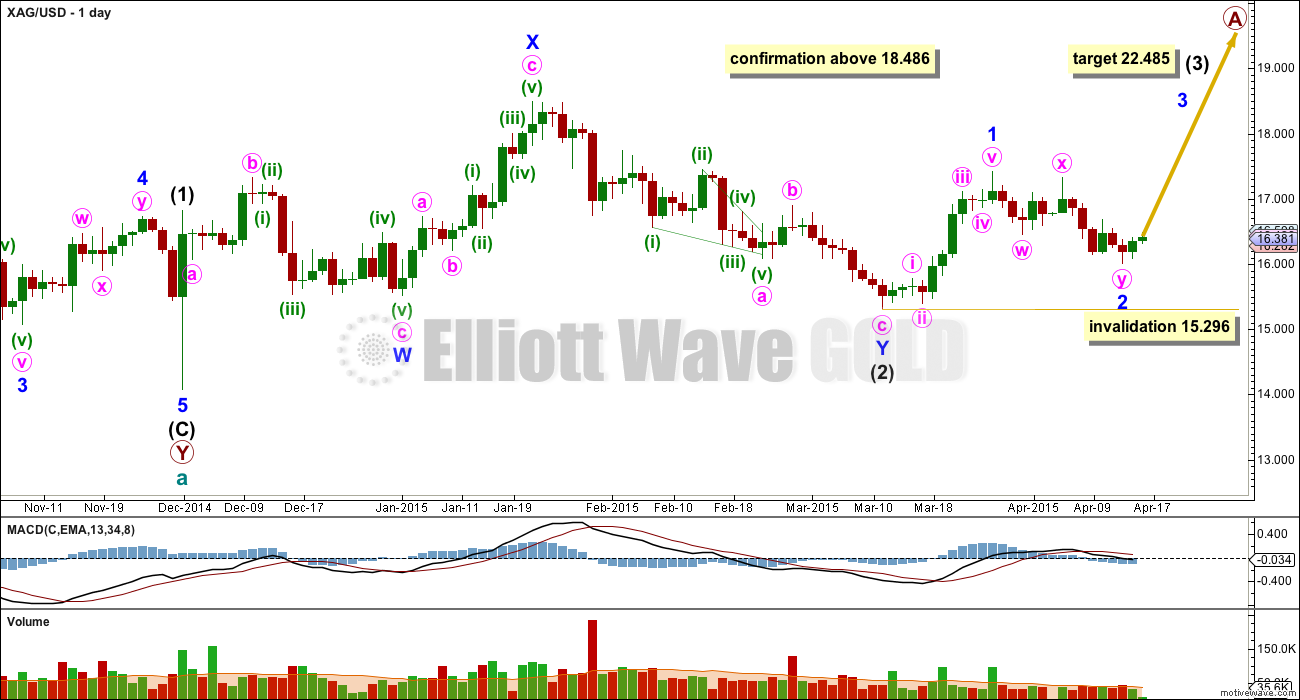
I have adjusted the wave count of intermediate waves (1) and (2) to see intermediate wave (1) as a five and intermediate wave (2) as a double combination.
If intermediate wave (1) is a five then primary wave A may be an impulse. This fits better if cycle wave b is to be a zigzag.
At 22.485 intermediate wave (3) would reach 2.618 the length of intermediate wave (1). Intermediate wave (3) may only subdivide as an impulse. Within it minor wave 1 looks like a five on the daily chart. Minor wave 2 may or may not be over. If it continues lower it may not move below the start of minor wave 1 below 15.296.
A new high above 18.486 would invalidate the bear wave count and provide confidence in this bull wave count.
Bear Wave Count
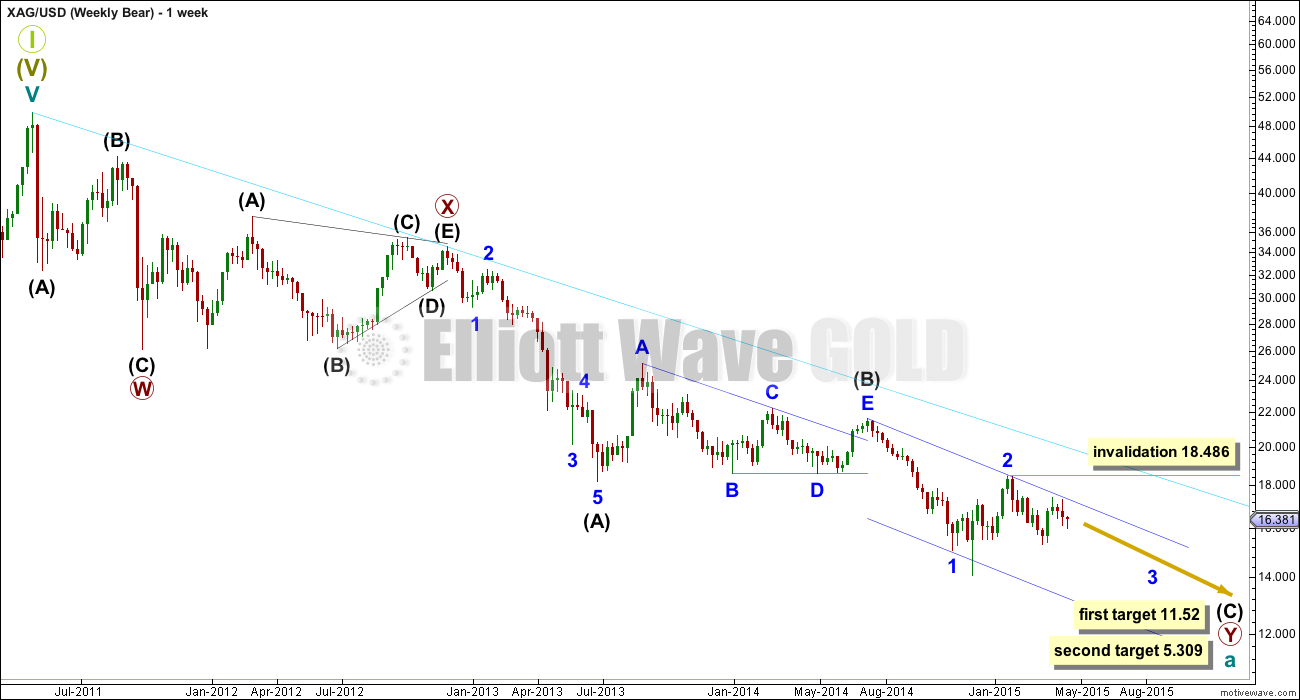
This bear wave count is identical to the bull wave count up to the end of the triangle for intermediate wave (B) within the second zigzag of primary wave Y.
Thereafter, it looks at the possibility that intermediate wave (C) within the zigzag is not over.
Within intermediate wave (C) minor wave 1 fits as a five better than the bull wave count. Minor wave 2 now though looks to be too large on the weekly and daily chart.
Within minor wave 3 no second wave correction may move beyond the start of its first wave above 18.486.
At 11.52 intermediate wave (C) would reach 0.618 the length of intermediate wave (A). At 5.309 intermediate wave (C) would reach equality in length with intermediate wave (A).
I have drawn a base channel about minor waves 1 and 2. Price continues to find resistance at the upper edge of the base channel.
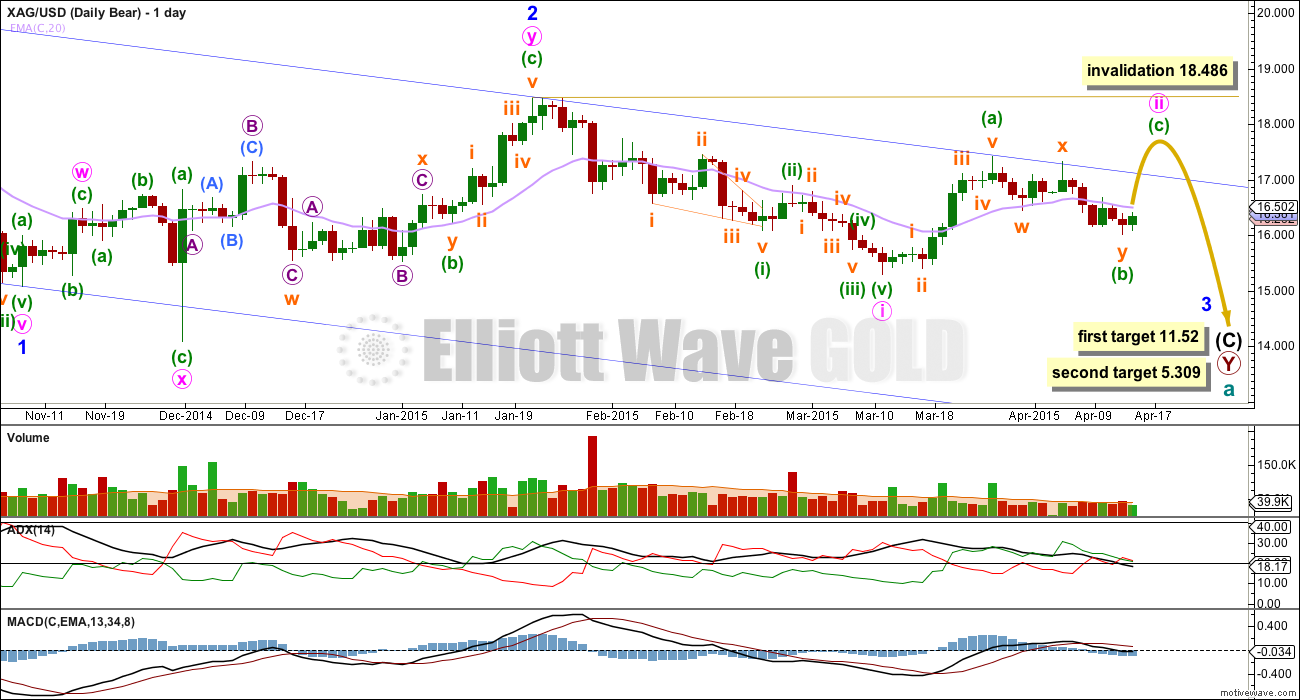
The biggest problem with this bear wave count today is the base channel. It is difficult to see minute wave ii over at the high labelled minuette wave (a) because this upwards wave looks so much like a five wave impulse on the daily chart. For this wave count minute wave ii should continue, but that means it will breach the base channel drawn about minor waves 1 and 2, one degree higher.
It is also possible that my conclusion that minuette wave (a) is a five wave structure is wrong because this upwards movement may have been a zigzag multiple. A new low below 15.296 would indicate that this is so, and at that stage I would expect minute wave ii was over and minute wave iii within minor wave 3 down may be underway.
Minute wave ii may not move beyond the start of minute wave i above 18.486.
Since the end of minor wave 2 at 18.486 it is down days which have the highest volume. This may indicate that the trend remains down. This slightly favours the bear wave count.
The ADX level is low (below 20) and declining, indicating the market is in a consolidation phase, not trending. This indicates that although price is below the 20 day EMA the trend is not necessarily clearly down, the signal may be false. MACD is close to zero indicating a lack of momentum. This fits a wave count which sees Silver as within a second wave correction at this time.
Lara, I’ve just read “silver is on the verge of a major breakout following this week’s sharp rally” at http://www.smarterinvestor.com. Can you advise if your daily bear count invalidation point remains the same on silver? Would it be possible to do hourly charts on the bull/bear scenarios at this point in time?
Sorry missed to attach the chart in the last post.
What about this scenario for Bear count? If the last wave 5 is in progress of Wave c what would be the target then?
kindly need your call on this
As we are looking at the big picture.. do you see any possibility that cycle a was actually over in June 2013, the big triangle that followed (lasting over 1 year) was cycle b, and we are now in cycle c?? Note, if you use a linear scale the end of the triangle does break out of the base channel.
That idea doesn’t work. This is why:
Cycle wave a would be a double zigzag (you’d have to see the impulse I have labelled as intermediate wave (A) within primary wave Y as a zigzag, which is really problematic).
If cycle wave a is a double zigzag then the only structure possible is a flat correction. Within a flat cycle b needs to retrace a minimum 90% of cycle a. The triangle which followed was very shallow, no where near 90%.
Even if you rework cycle a as a single zigzag (and I can see a solution for that) then you have either a double zigzag unfolding downwards, incomplete, or a flat correction unfolding. The outlook would just move the degree of labelling on the weekly chart up one degree. The bull weekly chart would be expecting the same direction. No change.
Is there a possibility for this to happen instead of taking B wave as contracting triangle if taken as 1 and 2