
Sideways movement was expected from last Elliott wave analysis, which is what happened.
Summary: This movement is a small correction against the trend, which for both bull and bear counts is up at least at minute degree. This fourth wave is either a zigzag to end about 1,183 for the main bull hourly wave count, or a lower degree fourth wave to move sideways for the alternate hourly bull count and the bear hourly count. This correction is not over and should continue for another one to seven days. For the bear count and alternate hourly bull count it may be a flat, combination or triangle, which means it could move sideways only and be very shallow. For the main bull count it must be a zigzag and it must be deeper to have the right look.
Click on charts to enlarge.
To see weekly charts for bull and bear wave counts go here.
Bull Wave Count
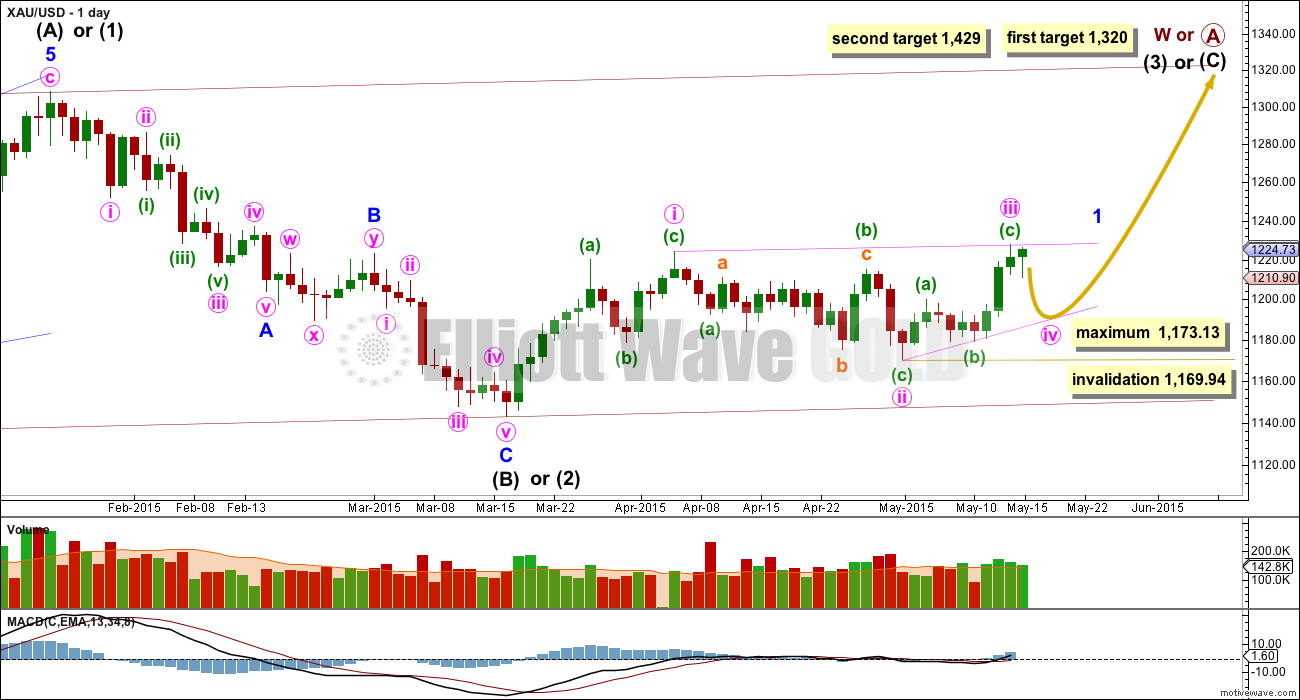
The bull wave count sees primary wave 5 and so cycle wave a a complete five wave impulse on the weekly chart.
Pros:
1. The size of the upwards move labelled here intermediate wave (A) looks right for a new bull trend at the weekly chart level.
2. The downwards wave labelled intermediate wave (B) looks best as a three.
3. The small breach of the channel about cycle wave a on the weekly chart would be the first indication that cycle wave a is over and cycle wave b has begun.
Cons:
1. Within intermediate wave (3) of primary wave 5 (now off to the left of this chart), to see this as a five wave impulse requires either gross disproportion and lack of alternation between minor waves 2 and 4 or a very rare running flat which does not subdivide well.
2. Intermediate wave (5) of primary wave 5 (now off to the left of the chart) has a count of seven which means either minor wave 3 or 5 looks like a three on the daily chart.
3. Expanding leading diagonals are are not very common (the contracting variety is more common).
4. The possible leading diagonal for minor wave 1 and particularly minute wave ii within it look too large.
For the last three days, volume shows an increase. This supports the bull count a little, but the increase is not higher than prior down days within the sideways chop. For volume to clearly support the bull wave count it needs to show an increase beyond 187.34 (30th April) and preferably beyond 230.3 (9th April). Only then would volume more clearly indicate a bullish breakout is more likely than a bearish breakout.
Within cycle wave b, primary wave A may be either a three or a five wave structure. So far within cycle wave b there is a 5-3 and an incomplete 5 up. This may be intermediate waves (A)-(B)-(C) for a zigzag for primary wave A, or may also be intermediate waves (1)-(2)-(3) for an impulse for primary wave A.
Intermediate wave (A) subdivides only as a five. I cannot see a solution where this movement subdivides as a three and meets all Elliott wave rules (with the sole exception of a very rare triple zigzag which does not look right). This means that intermediate wave (B) may not move beyond the start of intermediate wave (A) below 1,131.09. That is why 1,131.09 is final confirmation for the bear wave count at the daily and weekly chart level.
Intermediate wave (B) is a complete zigzag. Because intermediate wave (A) was a leading diagonal it is likely that intermediate wave (C) will subdivide as an impulse to exhibit structural alternation. If this intermediate wave up is intermediate wave (3) it may only subdivide as an impulse.
At 1,320 intermediate wave (C) would reach equality in length with intermediate wave (A), and would probably end at the upper edge of the maroon channel. At 1,429 intermediate wave (C) or (3) would reach 1.618 the length of intermediate wave (A) or (1). If this target is met it would most likely be by a third wave and intermediate wave (C) would most likely be subdividing as a five wave impulse.
It is possible that the intermediate degree movement up for the bull wave count is beginning with a leading diagonal in a first wave position for minor wave 1.
A leading diagonal must have second and fourth waves which subdivide as zigzags. The first, third and fifth waves are most commonly zigzags but sometimes they may be impulses.
Within diagonals, the most common depth of the second and fourth waves is between 0.66 and 0.81. Minute wave ii is 0.67 of minute wave i.
Because minute wave iii is more likely to be a zigzag than an impulse it is possible that it is over now and shorter than minute wave i. This means minute wave iv should move lower as a zigzag, to last maybe five or eight days, and not be longer than equality with minute wave ii at 1,173.13. Minute wave iv must overlap back into minute wave i price territory (which it has already) and may not move beyond the end of minute wave ii below 1,169.94.
Main Bull Hourly Wave Count
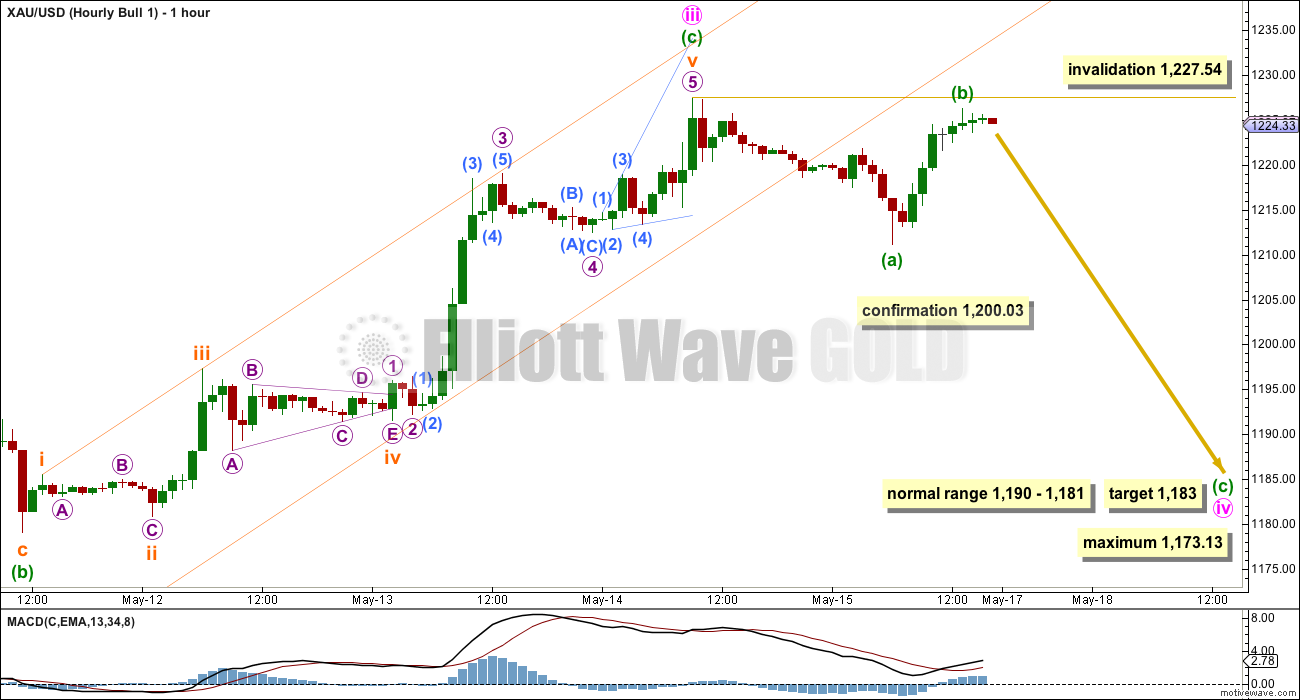
I have checked the downward wave labelled here minuette wave (a) on the five minute chart. It will subdivide both as a five and a three.
Within a leading diagonal, the first, third and fifth waves are most commonly zigzags, but they may also be impulses. Both structural possibilities must be considered, with the zigzag possibility more likely.
For this bull wave count, minute wave iv should show up very clearly on the daily chart as a three wave zigzag, may last either a Fibonacci five or eight days, and may not be longer than equality in length with minute wave ii because the diagonal is contracting and the maximum limit is at 1,173.13.
The normal depth for second and fourth wave corrections within diagonals is between 0.66 to 0.81 the prior actionary wave. This gives a range for minute wave iv between 1,190 – 1,181.
If minuette waves (a) and (b) are over as labelled, then at 1,183 minuette wave (c) will reach 1.618 the length of minuette wave (a).
Minute wave iv must subdivide as a zigzag, and within it the B wave may not move beyond the start of the A wave above 1,227.54.
A new low below 1,200.03 would invalidate the alternate hourly bull wave count below (and the hourly bear wave count) providing confirmation for this main hourly bull wave count.
Alternate Bull Hourly Wave Count
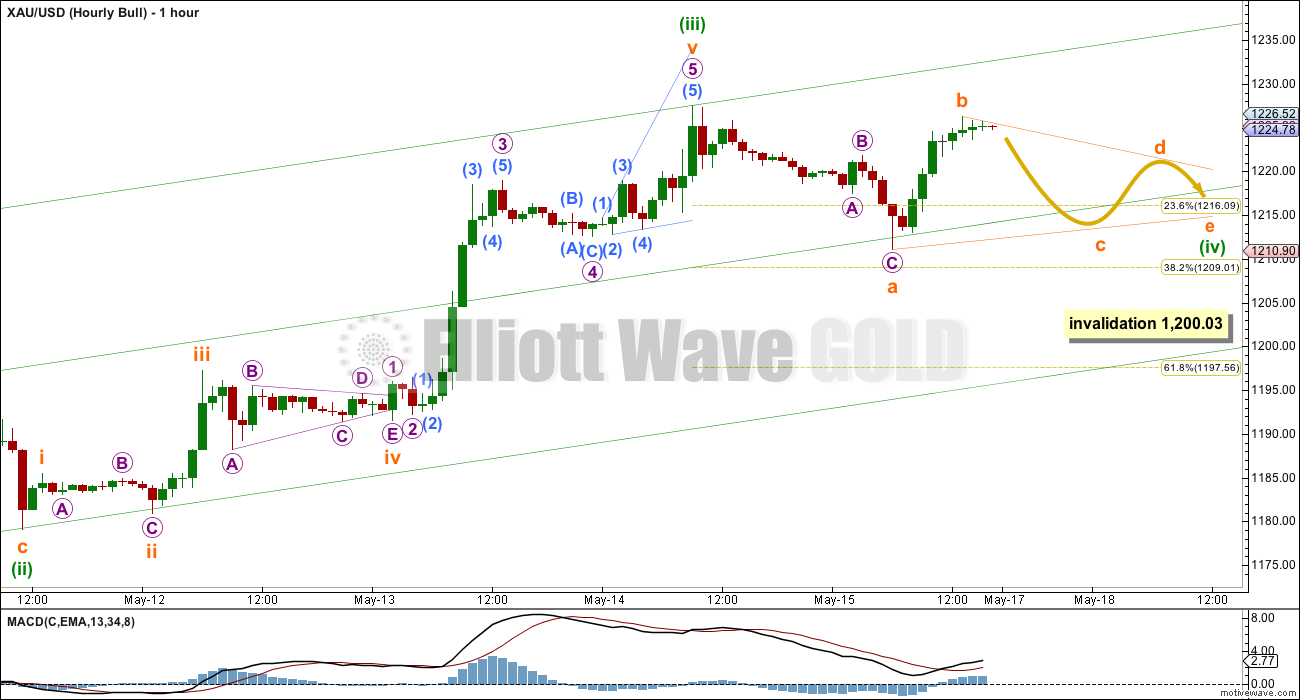
Within a leading diagonal, the first, third and fifth waves may also be impulses. If one of these actionary waves is an impulse it is usually the third wave, so this alternate wave count must be seriously considered.
In the short term, a small fourth wave correction should unfold sideways and should show alternation with the deep 0.70 zigzag of minuette wave (ii). Minuette wave (iv) should be a shallow correction, ending at either the 0.236 or 0.382 Fibonacci ratios.
It is most likely to be a flat, combination or triangle. These structures may include a new high beyond its start above 1,227.54 as in an expanded flat, running triangle or an X wave within a combination. This hourly wave count looks at the possibility of a triangle. If this structure is how the fourth wave unfolds, then it may just move sideways in an ever decreasing range for another four or seven days.
A new high above 1,227.54 would invalidate the main hourly wave count and confirm this alternate.
Minuette wave (ii) lasted four days. Minuette wave (iv) may last at least three days, may be as long as five or eight days duration, and may not move into minuette wave (i) price territory below 1,200.03.
Although a zigzag is the more likely structure for minute wave iii (main hourly wave count), it would give this diagonal a clearer look if minute wave iii did continue higher because then the upper i-iii trend line would have a clear upward slope.
Bear Wave Count
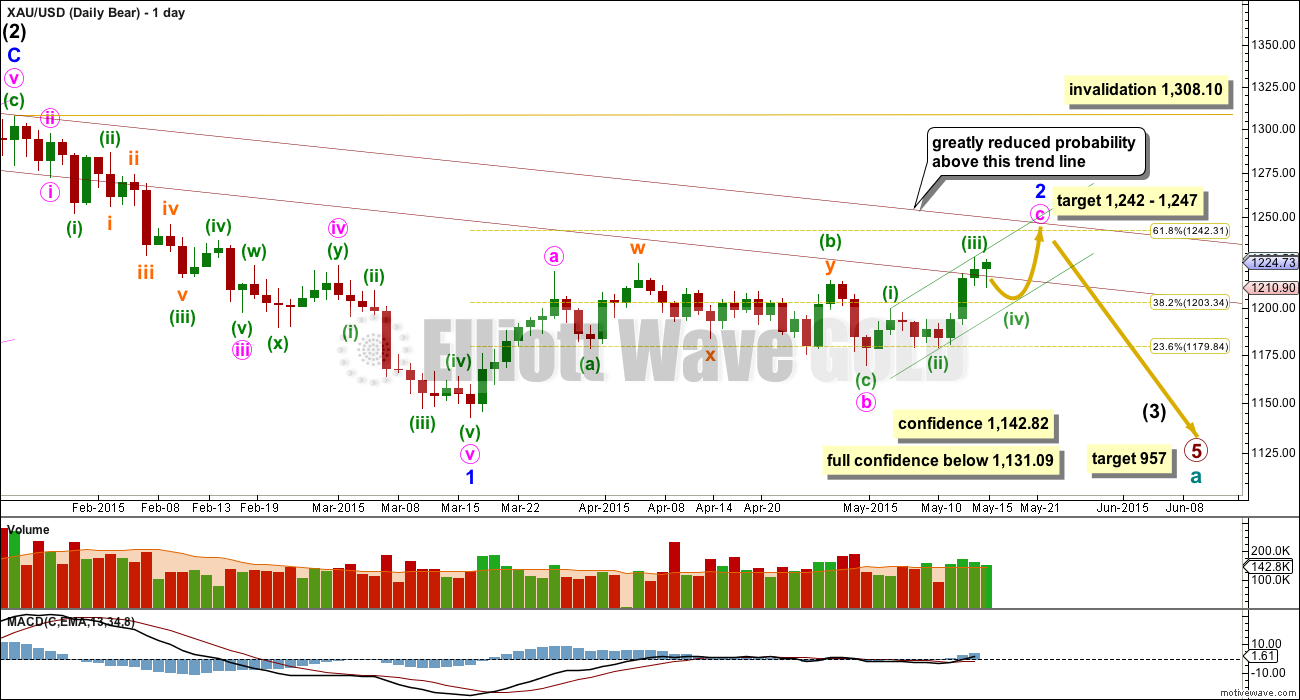
This wave count follows the bear weekly count which sees primary wave 5 within cycle wave a as incomplete. At 957 primary wave 5 would reach equality in length with primary wave 1.
Pros:
1. Intermediate wave (1) (to the left of this chart) subdivides perfectly as a five wave impulse with good Fibonacci ratios in price and time. There is perfect alternation and proportion between minor waves 2 and 4.
2. Intermediate wave (2) is a very common expanded flat correction. This sees minor wave C an ending expanding diagonal which is more common than a leading expanding diagonal.
3. Minor wave B within the expanded flat subdivides perfectly as a zigzag.
Cons:
1. Intermediate wave (2) looks too big on the weekly chart.
2. Intermediate wave (2) has breached the channel from the weekly chart which contains cycle wave a.
3. Minor wave 2 is much longer in duration than a minor degree correction within an intermediate impulse normally is for Gold. Normally a minor degree second wave within a third wave should last only about 20 days maximum. This one is in its 41st day and it is incomplete.
4. Within minor wave 1 down there is gross disproportion between minute waves iv and ii: minute wave iv is more than 13 times the duration of minute wave i, giving this downwards wave a three wave look.
This bear wave count now needs minute wave c upwards to complete as a five wave impulse. The short term outlook is exactly the same as the bull alternate hourly wave count, and the subdivisions on the hourly chart are exactly the same.
At 1,247 minute wave c would reach equality in length with minute wave a. Minor wave 2 would be very close to the 0.618 Fibonacci ratio at 1,242.
Minor wave 2 may not move beyond the start of minor wave 1 above 1,308.10. However, this wave count would be substantially reduced in probability well before that price point is passed. A breach of the upper maroon trend line, a parallel copy of the upper edge of the channel copied over from the weekly chart, would see the probability of this wave count reduced so much it may no longer be published before price finally invalidates it.
The hourly chart for the bear count is the same as the alternate hourly chart today for the bull count. They both expect sideways movement for a consolidation for one to five days, to be followed by a fifth wave up.
Today I am labelling minuette wave (iv) as a possible flat or combination. Minuette wave (iv) may be one of more than thirteen possible structures, and at this stage it is impossible to tell which will unfold. All possibilities must be considered.
If this is a flat or combination, it may move sideways in very choppy overlapping movement for a few days and would be reasonably likely to include a new high above 1,227.54 and a new low below 1,211.11.
Minuette wave (iv) may also equally as likely be a triangle as outlined in the alternate bull hourly chart.
Technical Analysis
Markets do one of two things: they are either trading (sideways) or trending. Therefore, different technical analysis approaches are required for these two different scenarios.
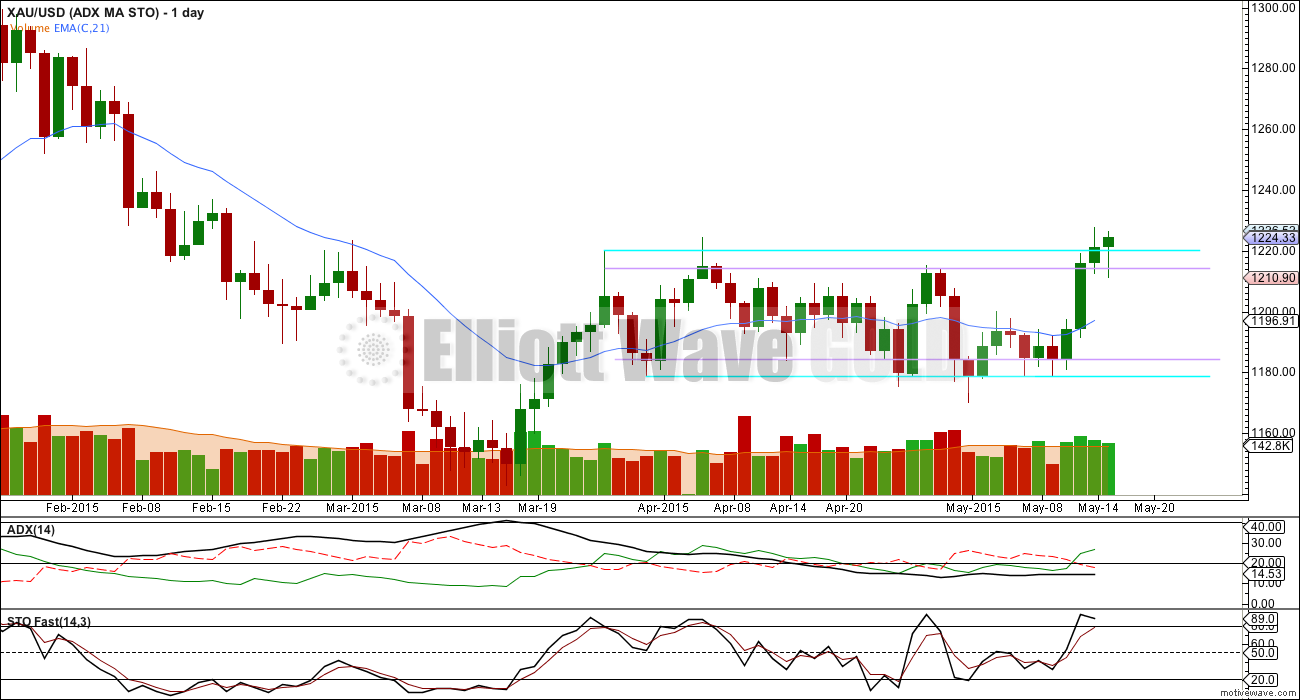
For those members who are colour blind I have changed the -DX line in ADX to a red dashed line, and made the ADX line bold black. The +DX line remains green solid.
Since 27th March Gold has been sideways. This chart outlines one possible TA approach to a sideways market. It follows the idea outlined in Kirkpatrick and Dhalquist, “Technical Analysis”, second edition, page 443.
On the 27th March ADX was declining and dropped below 30. This indicated a sideways market, and that an oscillator should be used to indicate support and resistance. I have chosen fast Stochastics with default settings. Also, I have added upper and lower trend lines to the price chart, from the first high and low of this range with upper and lower bands of 5% of market value. The approach would be to sell when price moves into the upper 5% band and stochastics is overbought, and to buy when price moves into the lower 5% band and stochastics is oversold. This approach would have worked in this instance because the market is moving horizontally. But sometimes a trading range is skewed in one direction or the other (usually in a direction against the main trend). In that case horizontal trend lines do not always clearly delineate the trading range, so flexibility in how trend lines are drawn is required. Stochastics would still be used in the same way.
The approach outlined here is one potential idea. As always, it is money management and risk management which makes the difference between profit and loss in the long term.
ADX continues to be low, below 20, and flat. This indicates still low volatility, very short swings, and no trend at this time.
Price has closed just over 3% of market value above the upper horizontal trend line which delineates the upper edge of this sideways movement. This may be taken as an indicator of a possible upwards breakout from this sideways range. But with ADX so low and so flat, the trend has not yet begun to gather steam.
ADX indicates the current direction of price is up.
After a small consolidation period, at this point it looks more likely that upwards movement may continue in a new upwards trend.
This analysis is published about 05:32 p.m. EST.
Next analysis is now out.
It looks like Gold will complete a small doji candlestick for Monday’s session.
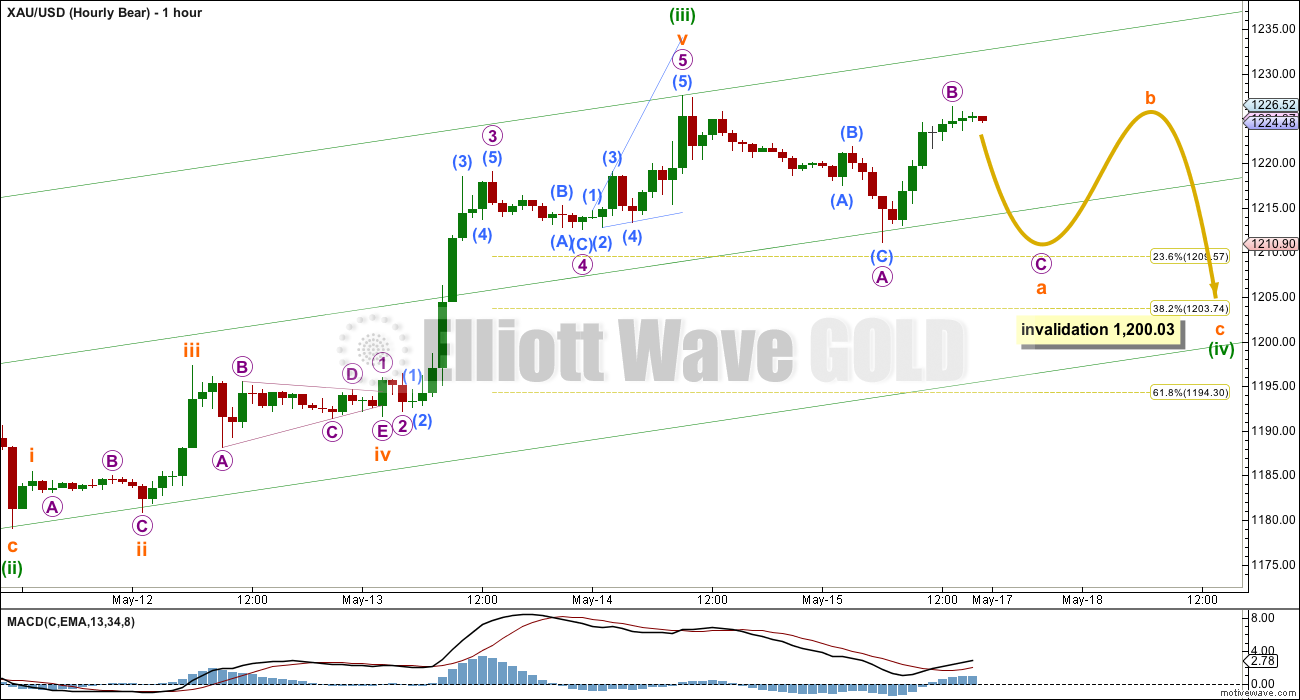
For both bull and bear wave counts a five wave impulse upwards is unfolding. Price is currently in a small fourth wave correction at minuette wave degree (green).
This fourth wave may still be one of three structures, all equally possible, it is impossible to tell which it will complete as. All three structures must be considered.
It may be an expanded flat, and in the C wave down. Target 1,204 – 1,206.
It may be a running contracting triangle currently in a C wave down, not to move below the A wave at 1,211.11.
It may also be a combination. The first structure for W was a zigzag, so the second structure for Y may be a flat (most likely) or triangle (less likely). Currently in the start of the second structure for Y.
The first two options have an upper invalidation point at 1,232.49. The third option of a combination does not have an upper invalidation point; the B wave of a flat correction or running triangle (within the second corrective structure of Y) may move beyond the start of the A wave above 1,232.49.
My conclusion is firmly that this correction is not over. Gold is in a correction AGAINST THE TREND. It should continue for at least one more day, if not a few more days.
If this thing wants to go up, it will have to gap up tomorrow
Gold has lots of resistance here, $USD is ready to break out, euro hit a wall and is turning down, and after today’s ascending triangle break-out money will be flowing into the S&P. All seem like harsh headwinds for gold.
If it wants to go up it will go up, resistance or not. And if it doesn’t, that’s ok too, just needs to make up it’s mind.
Yes, anything can happen of course but the whole reason we apply technical analysis of any type, including EW is to try to align the odds in our favor, even if just slightly, correct? My point is that placing bullish bets on heavy resistance and other headwinds being broken is generally not a high-odds proposition.
I’m not gonna argue with the price action. If Gold goes up to 1250 and then it crashes, the pundits will call it a failed breakout. I couldn’t care less about what it’s called after the fact, or in how many waves did it happen, the most important thing is to be on the right side of the price action.
Agreed, price is king. But the question is how to best use the price data set in front of you to make decisions that places you on the right side of the price action. For example, should you be a buyer or seller at resistance? Should you use a break in resistance as a buy trigger? Should you use a gap fill or tag to a past swing high as a sell trigger? Those are the types of questions I contemplate.
Excellent questions.
Been noticing the past 3 days that gold is outperforming the GDX. This seems to be breaking a trend over the prior 1 1/2 months where the GDX was outperforming gold.
If if wants to go up, it will go up, resistance or not. And if it doesn’t, that’s ok too, just needs to make up it’s mind.
Of the two, I prefer the expanded flat. It would end faster. Now that price has moved below 1226.30, the b wave is confirmed. The c wave is underway now. At this moment, the price has not moved down large enough, so I suspect that we are still in the first wave of five down.
Thanks THAM. I keep learning from lara as well as you.
Does wave c of expdd flat have fib ratio to wave a?
Normally 1.618, sometimes 2.618.
I was asking how low this correction will result;?
It is as stated above. For minuette 4, nominally 1206, but based on the going, more like 1209-1210.
The first wave of five appears to have completed at 1222.66.
Tham
Expanded or triangle in hour wave count let us stay with expanded flat unfolding.
For bull hour b is still not complete from wave a at 1211. Once wave b is complete wave c will end below wave a (1211)?
For bear hour wave B is not complete. Once it is complete wave C will end below wave A (1211)?
Lara has wrote below Gold trading below 1226.30 will confirm wave B or b is complete.
Thanks.
USD is up +0.59 and Gold is up +$5.20.
Some one will give???
…. Gold price upside appears to be strengthening from CMP 1227-28 to take out 1232-33 and possibly check/test 1241-42…..
Good evening. I see gold has moved higher and one of the three options for the hourly count is invalidated.
I now expect that a smaller fourth wave correction (minuette degree) is unfolding sideways.
The a wave is complete as labelled on the hourly bear and second hourly bull counts. The b wave up is now most likely complete, and if it is it’s a 130% correction of the a wave. This may be either a B wave of an expanded flat or a running triangle. Or it may be an X wave of a combination.
It is not possible to tell yet which structure will unfold. All I can say at this stage is I would expect choppy overlapping movement.
A new low below 1,226.30 would confirm a fourth wave. At that stage the last three up would be confirmed as a completed three, not an unfolding five up. If there is a three up that means a correction is underway because it must be a b wave (or an x wave).
Lara, I want to thank you for posting this comment mid-term. I am monitoring these moves very closely for a position I am holding and your timing (the expert’s analysis showing up) was most soothing. [even if gold’s direction isn’t]. It was awesome of you. Thanks again.
Possible Rising wedge in 4H
Rising wedges often breaks downwards…
AS I SEE IT: Difficult to see Gold price below 1224-23 in a hurry with 200dma/pivot below there…. Takes a break above 1233-34 to set up 124x-125x – depends on the volumes here between 1228-23; a break below 200dma/pivot could likely seek 1216-15…. Ouch!
Hourly bull 1 has been invalidated at 1:46 am with movement above 1227.54 to 1229.59. Gold at 2:30 am is now at 1232.46
The other possibility is a rework of the bull that I have asked Lara just now. See (b) in my post. Let’s wait for Lara’s response.
The only thing quite certain is that the triangle is now off the table, which is a good thing because it will be time consuming.
Lara’s video clearly states any movement above 1227.54 clearly invalidates (Hourly Bull 1) and confirms the alternate (Hourly Bull). Lara will likely respond about 3 pm and is free to issue another chart usually after the close. Meanwhile standard protocol is we use alternate (Hourly Bull).
I know she said it invalidates, but I am raising a possibility. The difference is significant. In the invalidation scenario, the next drop will head towards minuette 4. In the continuation mode I suggested, it will head towards minute 4.
If the invalidation mode is correct, the bull is invalidated, and both the alternate bull and the bear are still alive. They will both have the same movement until the end of their respective minute waves.
Lara may still come online. It is now her 8:30 pm.
Tham I saw your post below. You are right on time with the important questions. 🙂 Lets hope Lara answers early on Monday session. –P.S. don’t let Richard get to you.
Thanks dsprospering. I am raising that possibilty because, as in my latest response to Richard, the ongoing movements will be very different.
I have learned to question the status quo because every forecast made is based only on available information and as the situation changes with additional inputs, a nimble trader must be flexible and reconsider his options. Sometimes, to blindly follow a set piece can lead to (monetary) disaster.
absolutely. I’ve got to nap now. Just a nap 🙁
commoncents15 on Stocktwits posted this insane pic i thought i’d share. I laughed. Its really not funny when I think of “all” the reference points existing in my head but it is so apropo.
same perspective, different pic
It could be a running triangle. There is no maximum length for a B wave within a running triangle in Frost and Prechter. It only must move beyond the end of the A wave and be a corrective structure.
Thanks Lara. This is a new learning point to me. Glad that it occurred. I can add this now to my repertoire.
If you have a copy of “Elliott Wave Principle” by Frost and Prechter, tenth edition (that’s important) go to page 86. Pages 86 – 91 have all the rules and guidelines for all EW structures there. When I was learning EW I read that once a day, every day. Quite quickly I learned the rules and guidelines by heart. It helped immensely to have that all in my head when I was preparing a wave count.
That would be my suggestion for you to quickly become extremely competent. Then read the whole book at least three times. There are a lot of other small points in it you’ll pick up.
It’s the only EW book you’ll need. In fact, I recommend NOT reading anything else. I see a lot of writing by others which contradicts the rules in Frost and Prechter. I wouldn’t be re writing any of their rules, they’re the gold standard.
Hi Lara. Price has now moved higher than 1227.54. Is this likely to be:
(a) the expanded flat in minuette 4 you described in the alternate bull count? or
(b) a continuation of minute 3, with a shallow minuette 4 at 1211.10, followed by minuette 5, thus terminating minute 3?
The following is a message to self and anyone else who might benefit.
Although Lara has not yet clearly stated it, unfortunately, it seems that the bull count is the more likely to be correct. Why unfortunately? Because the bull count implies that we are in an enormous (b) wave at cycle degree. As Lara has stated frequently, corrections are the most difficult to forecast and (b) waves within them are the most difficult portion of corrections.
So far, we’ve had a leading expanding diagonal at intermediate degree. Highly unusual and difficult to forecast or trade in real time. Now we are in intermediate wave (C) or 3. Can we get a decent impulse going? Not likely. By decent, I mean covering a lot of ground in a short space of time. We have yet another leading diagonal, this time contracting and with enough ambiguity to keep the bear count alive as long as possible.
It’s going to be harder than usual to trade gold over the next year or so. It’s going to be hard work for Lara to analyse and forecast, hard to identify a high probability move and rare to get a steady and consistent trend to trade.
To add further to the gloom, we have a cycle wave (c) to look forward to in the not too distant future. If you are a gold bull like me for fundamental reasons, then it seems a gross injustice that gold will not confirm the dysfunctional and mismanaged economic world that we live in.
I hope I am wrong about this, but in order to moderate expectations and maintain sanity in the coming period, I thought I would provide Monday’s bucket of cold water.
If gold goes down to 1173 as per day bull wave count I am happy and will add to long at taht time if bull count is still valid.
Fundamental reason gold should go higher has been promoted by many over lat 7 years 2007 on ward.
Here is a latest example:
http://kingworldnews.com/david-a-stockman-5-16-15/
How refreshing! (The bears could only ask for a few fish in that bucket.) 🙂
You’re right to a great extent.
If this is a cycle degree b wave then yes, the bigger picture is going to be extremely difficult. In the short to mid term though we shall be expecting either threes or fives up or down. The first up move is a five, the first down move is a three, which means the next move up may ONLY be a five.
At primary degree there will be some certainty in the short to mid term.
Once the first 5-3-5 up is complete then two wave counts would be necessary for primary wave A; one seeing primary wave A complete as a zigzag, the other seeing primary wave A incomplete as an impulse. The high of the first five up will be the price point which differentiates the two ideas.
So yeah, alternate wave counts will be necessary.
Lara, thank you for your soothing response.
A chart’s purpose is usually to help you properly interpret data. But sometimes, it does just the opposite. In the right (or wrong) hands, bar graphs and pie charts can become powerful agents of deception, tricking you into inferring trends that don’t exist, mistaking less for more, and missing alarming facts. The best measure of a chart’s honesty is the amount of time it takes to interpret it, says Massachusetts Institute of Technology perceptual scientist Ruth Rosenholtz: “A bad chart requires more cognitive processes and more reasoning about what you’ve seen.”
Rambus sees potential move up in GLD to 124.5. This would equate to approx 1300 gold.
http://rambus1.com/?p=37486
I read his previous post from May 10 where he talks a lot about Gold going down to 850 in October, then he says he’ll become bullish again if Gold moves past the 65 wk moving average. This means 1251 and change as of today, or 120.28 for GLD. On the chart there is an obvious gap there, waiting to be filled. We’ve been arguing here if we’ll make it to that gap level at all. Then he says something very funny: “GLD is now beginning its 7th reversal point to the upside”. The funny word is “now”. It’s not “now”, Gold’s been moving up for the last two months, but you wouldn’t know it reading Rambus. Only “now” it’s going up and I’m not sure, it could go up further, but it could also go down, we’ll see, but don’t hold me liable if things go wrong, have a nice weekend anyway … There’s a lot of literary talent at work here, and little actionable information.
Yep, even Armstrong is now saying gold may rally in June and run up over 1300 and the subsequent decline may need to wait until later this year. So….it’s apparently unanimous, gold must move higher…it’s nice when the world is in agreement making it so simple to make money 😉 …right???
I don’t know who Armstrong is, probably another Guru, I hope he provides good Guru services for his followers. To quote NFL, I still think it’s more likely than not, that we go up next week and we fill the GLD gap at 119-120. I have no opinion after that.
Martin Armstrong is an economist.
http://armstrongeconomics.com/archives/30466
For those who want to learn more about ADX indicator Lara has included in the post:
Learn more:
http://stockcharts.com/school/doku.php?id=chart_school:technical_indicators:average_directional_index_adx
I’m not putting really any weight on this at all but I find the confluence of pitchfork resistance interesting on the gold chart.
the hanging man capped by the 200ema is another layer of resistance and suggestive of at least a swing high if not a more significant top.
the 200ema seems to have the same lid possibly on the XAU too.
Mark F
DUST 2 hour wedge had FBO twice and is ready to get back in side the narrowing channel. If it breaks above it will be above the top rail near apex.
Plus intra day volume supportive and small HnS below the wedge.
Short term on the intraday charts DUST broke downtrend Friday, however it needs to break the downtrend on the daily chart to confirm a true reversal.
Recent trend in COT:
Commercial shorts:
5/15: 308799 +9000
5/8: 299017 -neg
5/1: 317220 -neg
4/24: 319988 -neg
4/17: 321752
From 4/17 shorts were decreasing. This week it jumped from last week.
—————————————
Spec Longs
5/15: 182713 +up
5/8: 177256 -neg
5/1: 197331 +up
4/24: 194116 +up
4/17: 193390
How do trade from this data?????? May be some one can make forcasting from here???
.
OPEX is next Friday. Commercials have large derivative bets which are wrong sided. I have said several times that physical demand is massive. This is not published by the controlled media which works in concert with the banks to rig the market. Physical demand does not get factored in by most posters here, simply b/c they are totally unaware of this.
The commercials have been going short out of necessity. Price has been hammering on the 200 DMA and has breached. If they had not gone short in the paper market, price would have been tens of dollars higher now.
There will need to be central bank intervention to take price down now and all for the sake of option positions. They will either get price down to the options sweet spot of 1200 or they will have to delta hedge.
The eco news has been dreadful and will not be getting better save gross manipulation. Physical supply is very tight. Shanghai wholesale prices are dollars higher than futures prices. The Allocated Bullion Exchange will be opening soon. After OPEX next Friday price will be thundering up.
A
VIEW: Friday H 1225.8 / L 1210.6…. Gold price is bullish, overbought, seeking continuation
to further new highs (increasing volumes and rising ADX seem to indicate so), susceptible
to a drop – overbought stochastic (longs take to the sidelines?). With a high
range close (significant that Gold price closed above 200dma, that’s bullish)
some further upward continuation can be expected on Monday but with Gold price
flirting / hob-knobbing with the upper band I don’t know if I would like to be
long here and would rather wait for a drop…. One will just have to see how Gold
price behaves around its pivot 1220 on Monday for an initial possible rise
above 1224-26…. On Friday Gold price took out the Thursday low but was unable
to take out Thursday high 1227.70…. Range expansion, pick up in volatility and a
likely breakout, which can go in either direction is expecting…. Trend
direction is up, it will be tough going to see Gold price break below 1216-12
for a possible break below Friday low (that occurrence would likely indicate
for further downside to follow subject to break below 1200-1198?) …. WEEKLY
OUTLOOK: Bearish but bottomy, trend direction up, rally / short term up move is
expecting (for a good short selling opportunity?)…. Gold price is looking to
top…. Better to close shorts and initiate longs though, upside risk is 1225-40….
A reversal candle in GDX????? Evening Star!!
http://thepatternsite.com/EveningStar.html
I was looking at that too. Not a picture perfect evening star but very close in structure. The fact that it’s combined with an exhaustion gap looking sequence forming a potential island reversal gives it an extra toppy look to me.
Previous bottoms in the JDST:DUST ratio point out to a little more upside potential for juniors before a reversal. I see most of them as double bottoms, so the top is usually retested
GDXJ:GDX ratio still pointing upwards, I don’t see an abrupt end of the rally with this ratio still going up
MarkF will keep talking about an impending doom, but I don’t see a big ramp up in the Commercial’s short positions, this is the second week with a rather uninteresting stance. It doesn’t mean Gold cannot take a nosedive from here, but if it does, it means the decline will be limited.
Current (counter-trend) rally in Gold is due to Euro collapse, funny enough the news made it to CNN (I would be concerned about this as a contrarian indicator). In Euro, Gold looks bullish and has plenty of room for additional upside
People in Germany are going crazy for gold
http://money.cnn.com/2015/05/14/investing/gold-germany-europe-ecb/index.html
Good article on miners and metals
http://www.gold-eagle.com/article/are-precious-metals-breaking-out
While I can see both bull and bearish technical arguments for the direction of gold as I view the charts, I’m really struggling to see how the daily GDX and HUI component charts can be viewed with a bullish stance, particularly in the near term. They all look like island-type reversals or swing high reversals in exhaustion gap sequences. And in the backdrop we have weekly and monthly GDX and HUI charts pegged at multi-year resistance, as well a bottoming looking USD and topping Euro to my eyes. Here’s a few charts showing what I’m seeing.
GG
HUI
AEM
DUST bottoming
Euro top
-Aaamen.. Aaamen.. Aaamen Amen Amen.
Sing it louder!
Would you, or may I share a link to your chart on Stocktwits?
which chart? That’s fine with me…I don’t know what Stockwits is.
Nice charts and convincing PM may see a reversal next week along Lara’s wave count to down side for 1200!!!
Lara, are there any strict EW rules regarding the length of B waves in relation to their prior A waves? Whereas I was originally thinking of a simple ABC correction for the 4th wave, I am now starting to feel that the B wave just looks too long. I honestly like the triangle best of all.
There’s no rule about the duration of a B wave, no. But of all the waves B waves do have a tendency to be more time consuming and complicated.