
Upwards movement continued as expected for GDX.
Summary: Downwards movement to 17.67 – 17.11 should complete a second wave correction. Thereafter, a big third wave up should begin.
New updates to this analysis are in bold.
MONTHLY ELLIOTT WAVE COUNT
Click chart to enlarge.
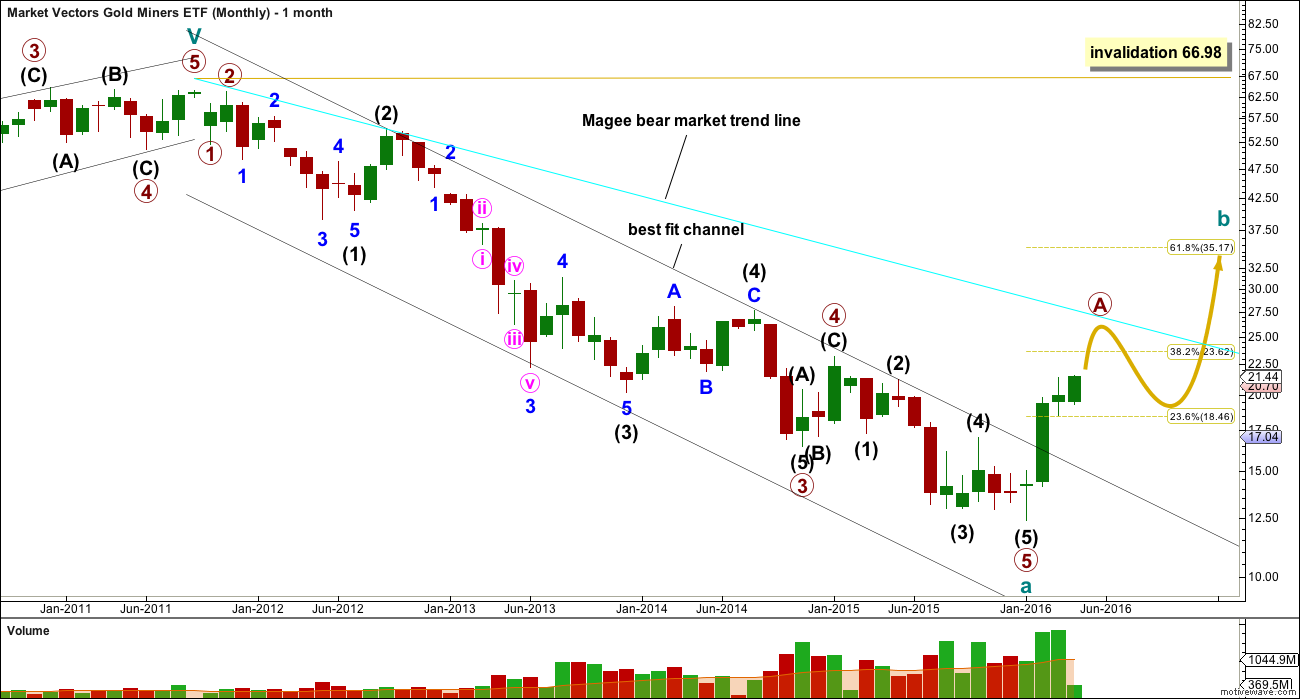
The whole wave down for cycle wave a subdivides well as a five wave impulse. However, GDX does not have adequate volume to produce typical looking Elliott wave structures. As always, this wave count comes with the strong caveat that this market is not sufficient in volume for a reliable Elliott wave analysis. It is a rough guide only. The direction expected from the Elliott wave count should be fairly reliable, but targets and invalidation points may not be.
Ratios within cycle wave a are: there is no Fibonacci ratio between primary waves 1 and 3, and primary wave 5 is 0.33 short of 0.236 the length of primary wave 3.
Ratios within primary wave 3 are: intermediate wave (3) is 3.48 short of 1.618 the length of intermediate wave (1), and intermediate wave (5) has no Fibonacci ratio to intermediate waves (3) or (1).
Ratios within intermediate wave (3) are: minor wave 3 has no Fibonacci ratio to minor wave 1, and minor wave 5 is just 0.02 longer than equality in length with minor wave 1.
Ratios within minor wave 3 are: minute wave iii is 0.38 longer than equality in length with minute wave i, and minute wave v has no Fibonacci ratio to either of minute waves i or iii.
Within primary wave 5, there are no adequate Fibonacci ratios between intermediate waves (1), (3) and (5).
The black channel is a best fit; this movement does not fit into an Elliott channel. The channel is breached very clearly and price has made a major new swing high above 17.04. A trend change is confirmed.
If it is correct that cycle wave a has subdivided as a five wave structure, then this tells us two things:
1. The bear market for GDX must be incomplete because a five may not be a corrective structure, so this must only be wave A.
2. Cycle wave b may not make a new high above the start of cycle wave a at 66.98.
Cycle wave b may be any one of 23 possible corrective structures. It may be a swift sharp zigzag, or it may be a sideways structure such as a flat, combination or triangle. It should last one to several years.
The first movement up for cycle wave b must be a clear five wave structure for a trend of this magnitude.
DAILY ELLIOTT WAVE COUNT
Click chart to enlarge.
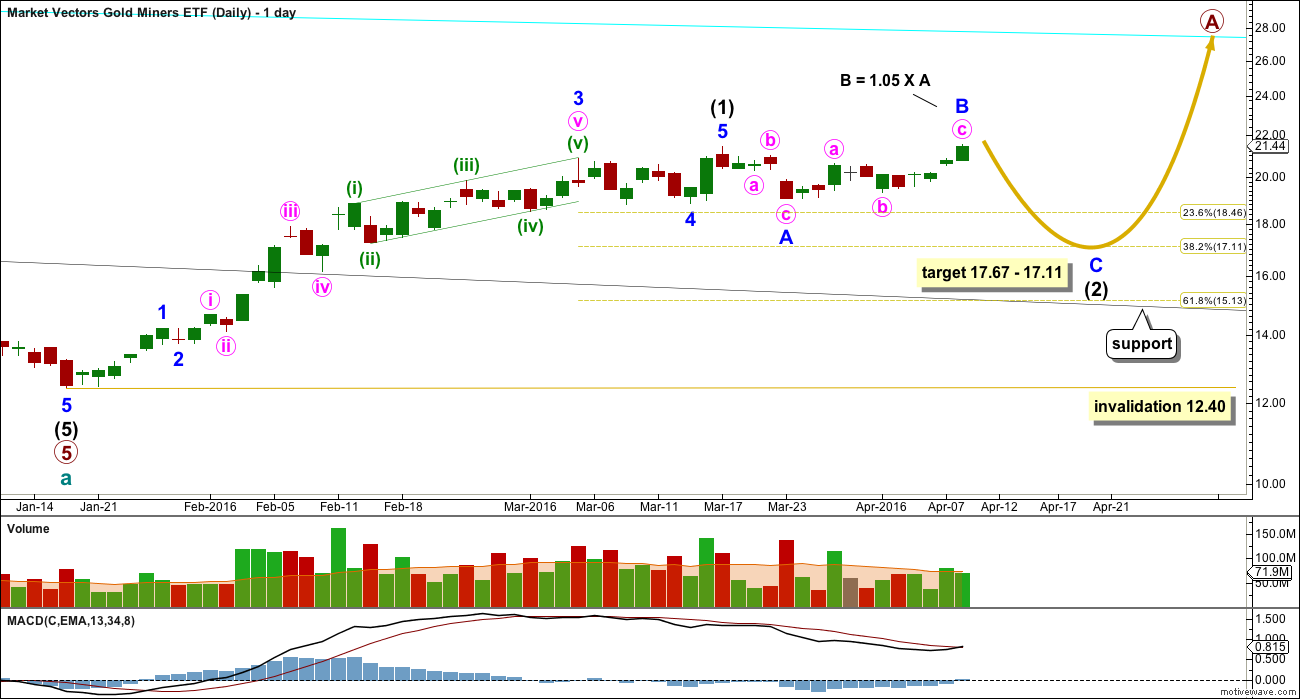
The first five up for intermediate wave (1) may now be complete. Intermediate wave (2) should now be underway.
Like Gold, it is very unlikely that intermediate wave (2) would be over already. It would be far too brief and far too shallow, failing to reach even the 0.236 Fibonacci ratio. Intermediate wave (1) lasted 41 days. If intermediate wave (2) is over at the low labelled minor wave A, it would have lasted only four days. The proportions are just too far off for that possibility to be seriously considered.
What is much more likely is intermediate wave (2) is incomplete and may be unfolding as a very common expanded flat correction.
The upwards wave labelled minor wave B does so far look and fit best as a three wave structure. It is a 1.05 length of minor wave A, meeting the requirement for an expanded flat and within the normal range of 1 to 1.38.
At 17.67 minor wave C would reach 1.618 the length of minor wave A. This is reasonably close to the 0.382 Fibonacci ratio of intermediate wave (1) at 17.11 giving a 0.56 target zone.
Intermediate wave (2) may not move beyond the start of intermediate wave (1) below 12.40.
TECHNICAL ANALYSIS
PRICE
Click chart to enlarge.
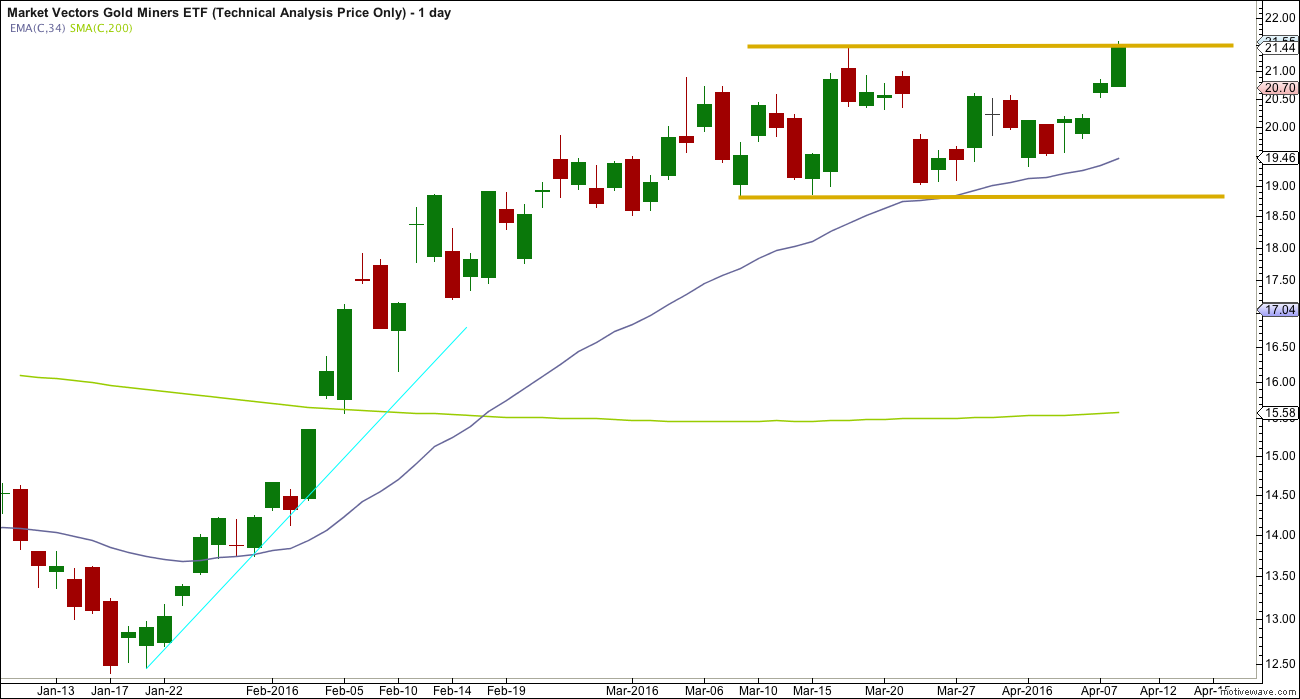
Because Motive Wave squashes price when indicators are added, I will separate price out.
Price is moving sideways, range bound with resistance about 21.40 and support about 18.80. There has not been a breakout yet. For a breakout to be indicated a daily candlestick has to close comfortably above resistance or below support and it should do so on a day with a clear increase in volume, particularly for an upwards breakout. That has not happened yet.
INDICATORS
Click chart to enlarge.
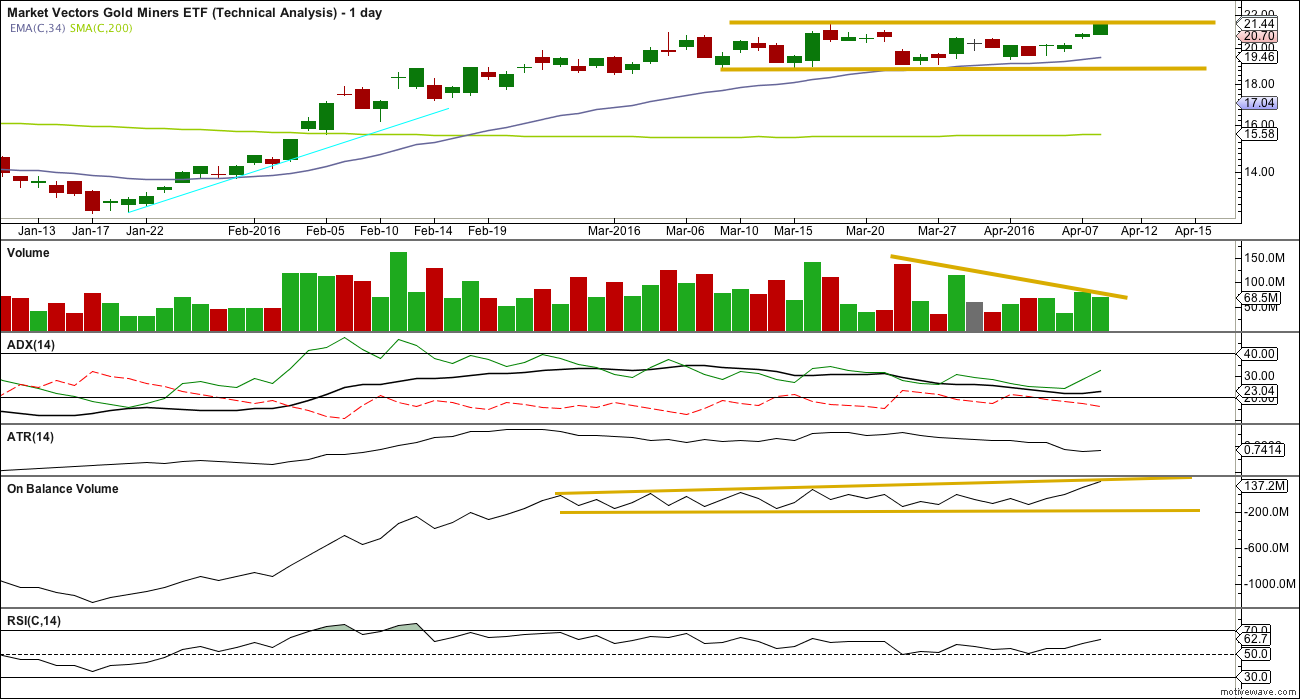
Volume declines as price moves sideways. This still looks like a typical consolidation; there has been no breakout yet. Friday closed slightly above resistance, but it was only slight and volume was lower than Thursday. This does not look like a breakout.
ADX is starting to slightly increase as is ATR. Both of these indicators agree that a new upwards trend may be developing. This needs to be followed by a breakout from price above resistance for it to be reliable.
On Balance Volume is contained within the gold trend lines. OBV is not indicating an upwards breakout. That doesn’t mean it can’t be about to happen, just that it is not so far supported by OBV. A break out of the lines containing OBV may precede the direction for price.
During the prior upwards trend RSI reached overbought and then exhibited triple negative divergence with price at the high on 16th March. This was a strong signal that upwards movement was nearing an end and a consolidation should be expected.
RSI is increasing along with price moving higher for four days in a row now. This looks bullish short term.
The bottom line is price is still range bound. A breakout is necessary before any confidence may be had in the upwards trend resuming.
This analysis is published @ 01:43 a.m. EST on 10th April, 2016.
Hi Lara, thanks for the analysis. The high of GDX is 66.98 and the low is 12.4. The 61.8% of Fib. should be around 46 vs 35.17(the number is shown in your analysis). Could you please verify it? Thanks!
I have the high of intermediate (1) at 21.42, and the low of 12.40.
I don’t know where you got 66.98 from?
And I had my Fib ratio tool sitting on the wrong high 🙁 Thanks for pointing that out.
The .618 ratio given is now 15.28. but that’s because the daily chart is drawn on a semi log scale.
The correct mathematical 0.618 ratio is 15.85.
Lara, $66.98 I believe is the 5 year high for GDX that happened at gold high in 2011. $66.98 is the invalidation point on your monthly GDX chart. $35.17 is the 61.8% from monthly chart.
Richard, that’s correct. $66.98 is the all time high of GDX. I was using the classical Fib. method to measure GDX from all time high to low. Its 61.8% Fib.= 46. I’m still learning EW, but I like the magics when it’s done right. 🙂
Thank you Lara. Very helpful!