
Last analysis on 9th of April expected downwards movement to 17.67 – 17.11.
Price moved higher up to 26.17 at the end of April, then turned down for a shallow correction ending 22.44 by the end of May.
Summary: The trend remains the same until proven otherwise. While price remains within the channel on the daily chart the target is 36.21. This upwards trend is currently showing weakness. A break below the black trend channel on the daily chart would indicate a deeper longer lasting correction may have arrived. It would be confirmed by price with a new low below 22.44.
New updates to this analysis are in bold.
MONTHLY ELLIOTT WAVE COUNT
Click chart to enlarge.
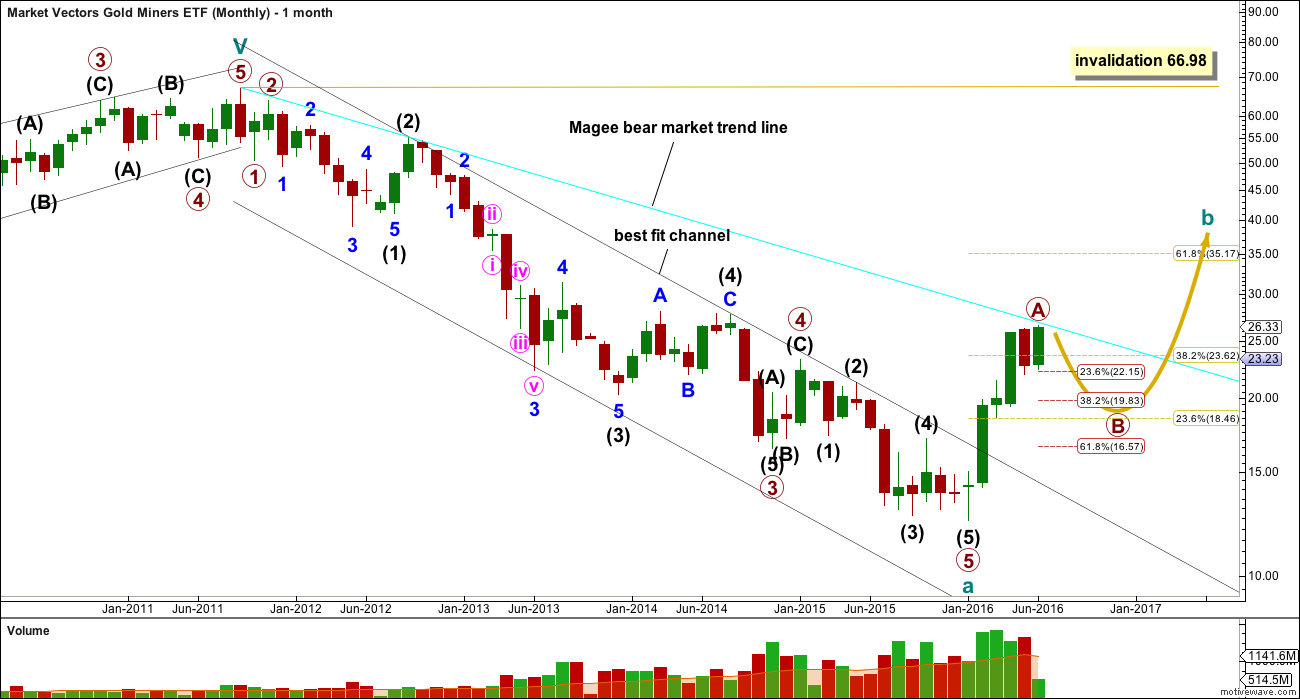
The whole wave down for cycle wave a subdivides well as a five wave impulse. However, GDX does not have adequate volume to produce typical looking Elliott wave structures. As always, this wave count comes with the strong caveat that this market is not sufficient in volume for a reliable Elliott wave analysis. It is a rough guide only. The direction expected from the Elliott wave count should be fairly reliable, but targets and invalidation points may not be.
Ratios within cycle wave a are: there is no Fibonacci ratio between primary waves 1 and 3, and primary wave 5 is 0.33 short of 0.236 the length of primary wave 3.
Ratios within primary wave 3 are: intermediate wave (3) is 3.48 short of 1.618 the length of intermediate wave (1), and intermediate wave (5) has no Fibonacci ratio to intermediate waves (3) or (1).
Ratios within intermediate wave (3) are: minor wave 3 has no Fibonacci ratio to minor wave 1, and minor wave 5 is just 0.02 longer than equality in length with minor wave 1.
Ratios within minor wave 3 are: minute wave iii is 0.38 longer than equality in length with minute wave i, and minute wave v has no Fibonacci ratio to either of minute waves i or iii.
Within primary wave 5, there are no adequate Fibonacci ratios between intermediate waves (1), (3) and (5).
The black channel is a best fit; this movement does not fit into an Elliott channel. The channel is breached very clearly and price has made a major new swing high above 17.04. A trend change was confirmed in February.
If analysis of downwards movement is correct that cycle wave a has subdivided as a five wave structure, then this tells us two things:
1. The bear market for GDX must be incomplete because a five may not be a corrective structure, so this must only be wave A.
2. Cycle wave b may not make a new high above the start of cycle wave a at 66.98.
Cycle wave b may be any one of 23 possible corrective structures. It may be a swift sharp zigzag, or it may be a sideways structure such as a flat, combination or triangle. It should last one to several years.
The first movement up for cycle wave b must be a clear five wave structure for a trend of this magnitude. It is possible that it is complete and finding resistance at the Magee bear market trend line.
If a larger correction begins from here, then targets would be the 0.382 and 0.618 Fibonacci ratios at 19.83 and 16.57.
I have two daily wave counts. Volume and divergence with RSI indicate the alternate is more likely, but the trend should still be assumed until proven otherwise. The alternate should remain an alternate until price indicates it is correct with a breach of the channel on the main daily chart.
DAILY ELLIOTT WAVE COUNT
Click chart to enlarge.
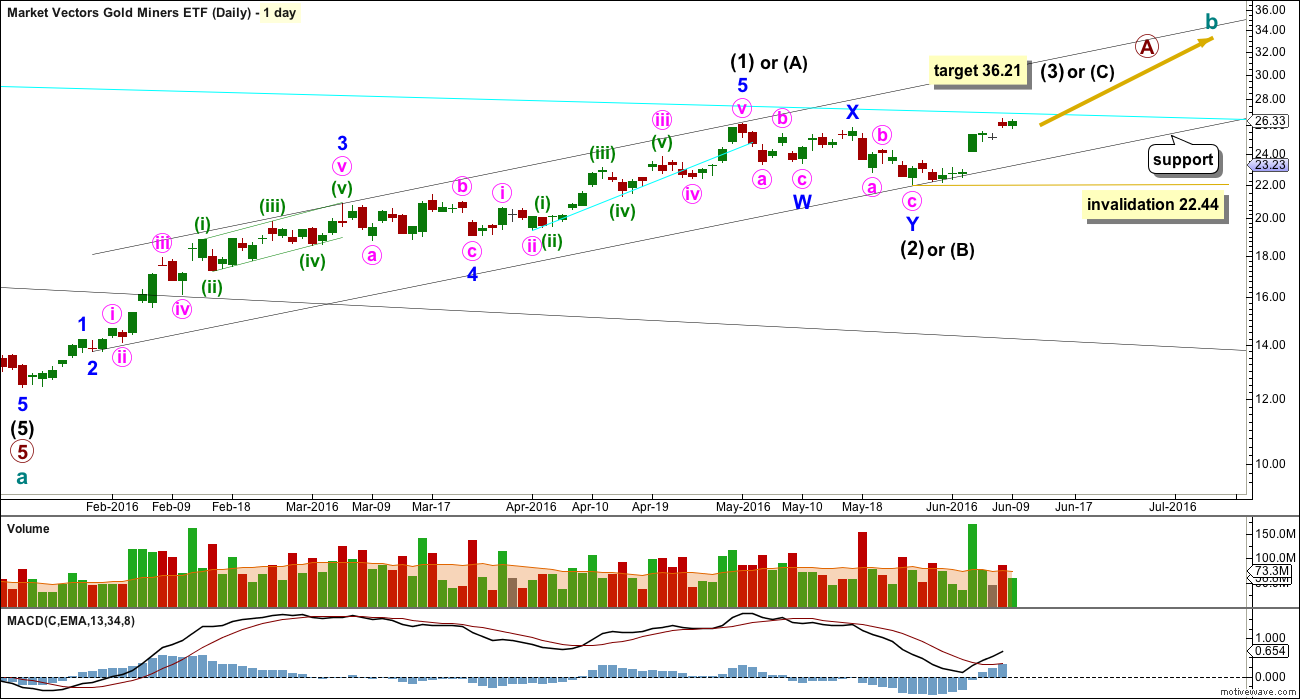
Primary wave A may be subdividing as a three or a five. If it is a five, it looks like an unfolding impulse. If it is a three, so far it looks like an unfolding zigzag. Both a zigzag and the start of an impulse subdivide 5-3-5, so at this stage it is not possible to determine which this may be. Both possibilities must be considered.
So far a 5-3 is complete. The next wave up should subdivide as a five. At 36.21 intermediate wave (3) or (C) would reach equality in length with intermediate wave (1) or (A).
Within intermediate wave (3) or (C), no second wave correction may move beyond the start of its first wave below 22.44.
If this wave count is correct, then price should continue to find support at the lower edge of the black channel along the way up. The earliest warning this wave count may be wrong and the alternate below may be correct would be a breach of the lower edge of the black channel.
At this stage, price may find strong resistance at the copy of the cyan trend line from the weekly chart. If price can break above this trend line, then the probability of this main wave count would increase over the alternate below.
ALTERANTE DAILY ELLIOTT WAVE COUNT
Click chart to enlarge.
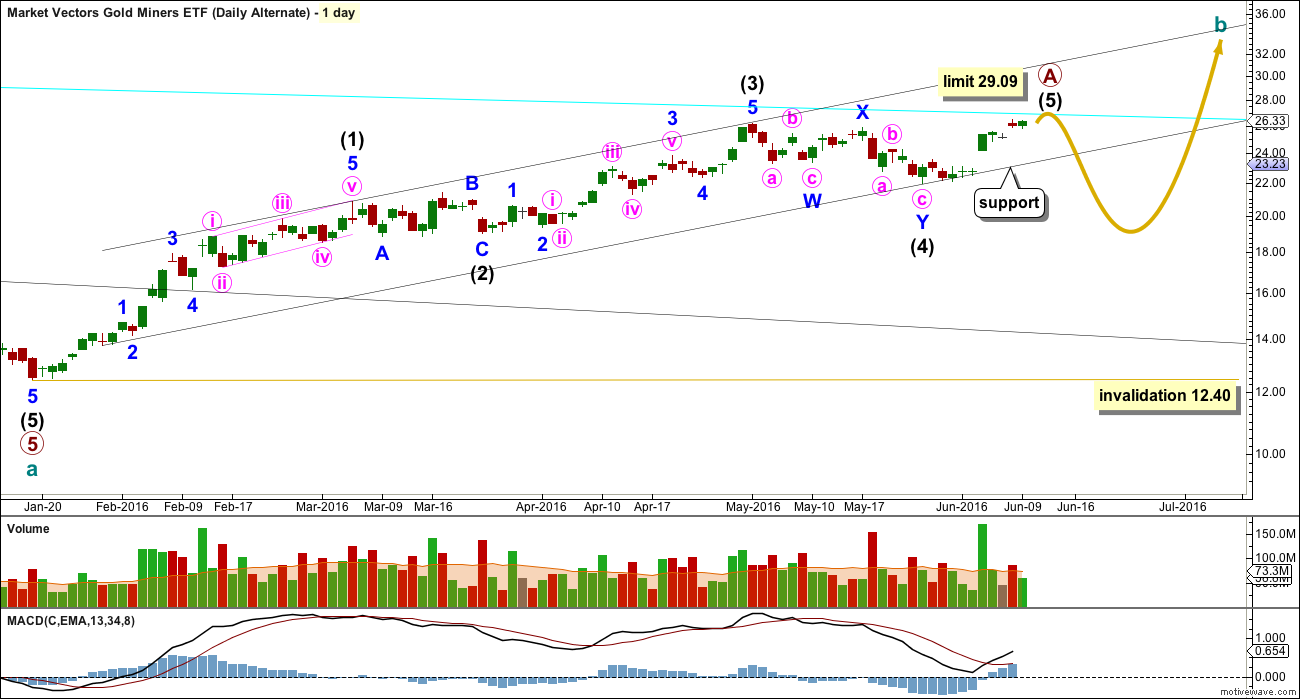
It is also possible that a five up is either complete or close to completion. If primary wave A subdivides as a five, then cycle wave b would be subdividing as a zigzag (or zigzag multiple).
Intermediate wave (3) is shorter than intermediate wave (1). This limits intermediate wave (5) to no longer than equality in length with intermediate wave (3), so that the rule regarding a third wave not being the shortest is met. This limit is at 29.09.
The first indication this alternate wave count may be correct would be a breach of the lower edge of the black channel. If that happens, then draw a Fibonacci retracement along the length of primary wave A. Use the 0.382 and 0.618 Fibonacci ratios as targets for primary wave B.
If primary wave A is a five wave structure, then primary wave B may not move beyond the start of primary wave A below 12.40.
TECHNICAL ANALYSIS
WEEKLY
Click chart to enlarge.
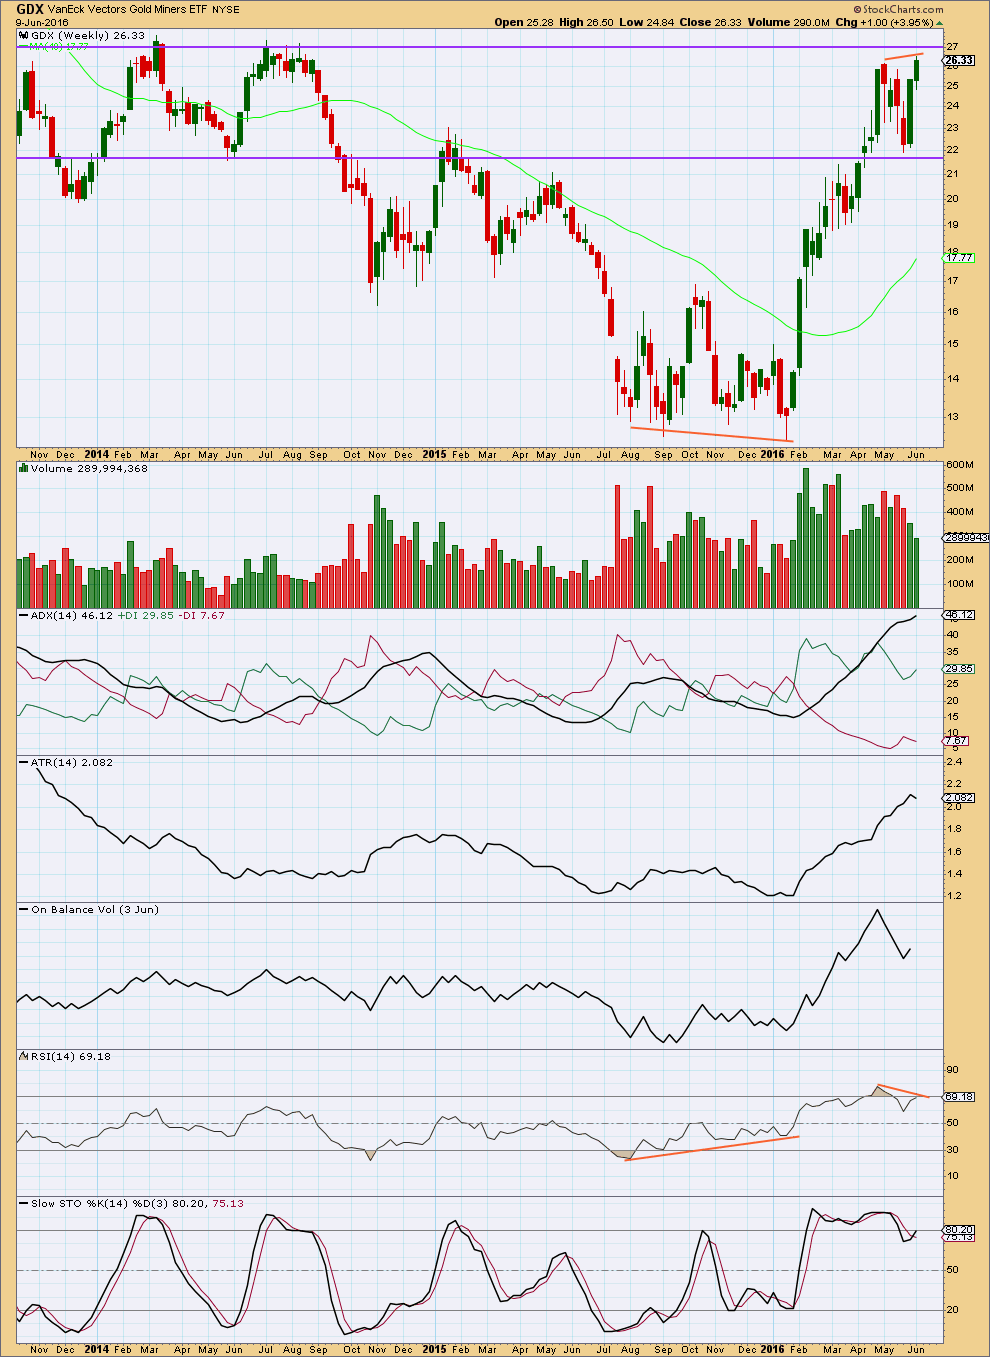
At the weekly chart level, there was double bullish divergence between price and RSI at the low of January 2016.
There is single bearish divergence between price and RSI now at the current high. Volume is declining (although at the time of publication the last week still has the session for Friday to add to it).
ADX still indicates the longer term weekly trend is upwards. ATR agrees as it is increasing.
At the end of this week (unless Friday is a spectacular upwards day), it looks like price and On Balance Volume will also exhibit bearish divergence.
Divergence is a warning of weakness. A trend change should be expected soon, but not necessarily now.
DAILY
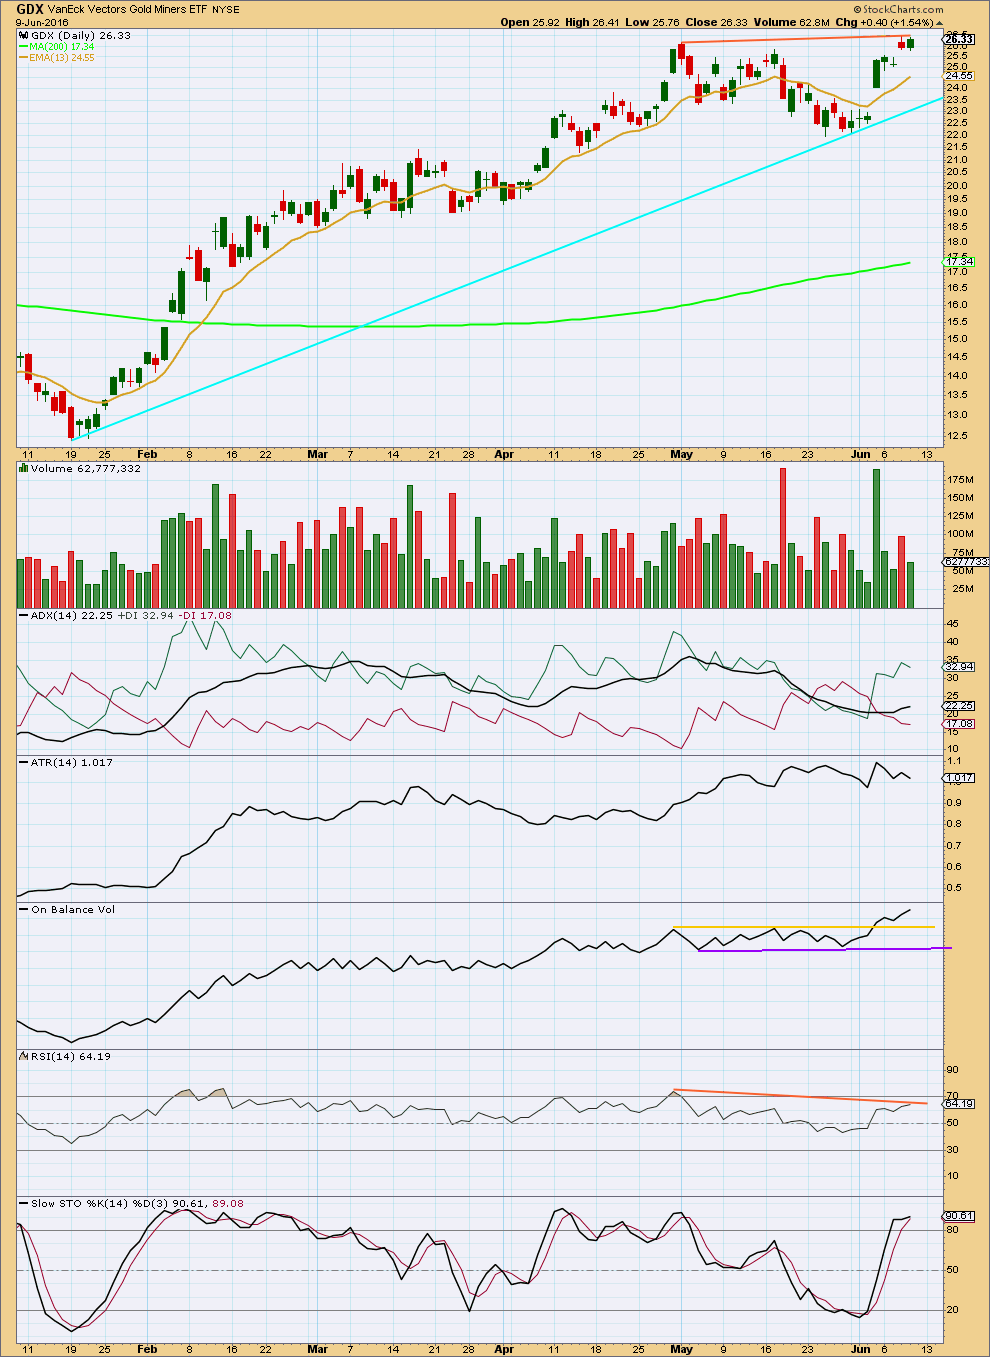
Click chart to enlarge.
It should be expected that the trend remains up while price remains above the cyan trend line. Also, while the shorter 13 day moving average remains above the longer 21 day moving average, it should be expected that the trend remains up. Price should find support about the 13 day MA.
ADX is indicating there is an upwards trend. There is still room for the trend to run. ADX is between 25 and 45 indicating a strong trend, not yet extreme. On Balance Volume is bullish.
There is some indication of weakness with divergence between price and RSI from the high of 2nd May to the high of 8th of June. RSI is usually a fairly reliable indicator of trend weakness, but it can continue and develop as double divergence (or occasionally triple) before a trend change actually occurs.
This analysis is published @ 02:41 a.m. EST on 10th June, 2016.
I think the brexit may have an opposite effect on gold and their shares. The pound and euro will be under pressure….the dollar will benefit….today yields were dropping as bonds were bought ….I’m guessing initially the dollar will be seen as a safe haven….maybe until the next jobs report. August and sept strong gold months. Perhaps we are seeing the right shoulder top of gold…if so drop could go down to 1120! Tuesday commercials had gone short again on the gold market. This was after the jobs report. With a run up to the right shoulder this week commercials are probably heavy net short. In fact we are up about 40 bucks from Tuesday. Therefore commercials are probably hovering about 300k net short gold. They are net short 245k contracts tues. We probably have about 15percent downside…..after that buy hand over fist.
Thanks Lara. Always appreciate your GDX updates. I gotta say though, that I don’t see how the GDX alternate is possible unless there is some other option for Gold than the Minor degree 2nd wave that is now the only Gold count.
Looks like a little more time is needed for clarity.
I could have my count on Gold wrong. That’s possible.
Always have to consider “what if?”