
Last analysis expected upwards movement towards a target at 36.21.
Price did move higher but fell 4.42 short of the target.
Summary: Classic technical analysis is very bearish today for GDX. A downwards trend is in place. This strongly favours the alternate monthly and alternate daily wave counts. A new low below 26.17 would indicate a much deeper correction should continue for a B wave, likely to end below 14.339. A new high above 31.79 would indicate an impulse upwards is continuing, target 35.15 and limit 36.34.
New updates to this analysis are in bold.
Although the wave counts are labelled “main” and “alternate”, the alternates are favoured. This is the order in which they were developed and not the order in which they are more likely.
MONTHLY ELLIOTT WAVE COUNT
Click chart to enlarge.
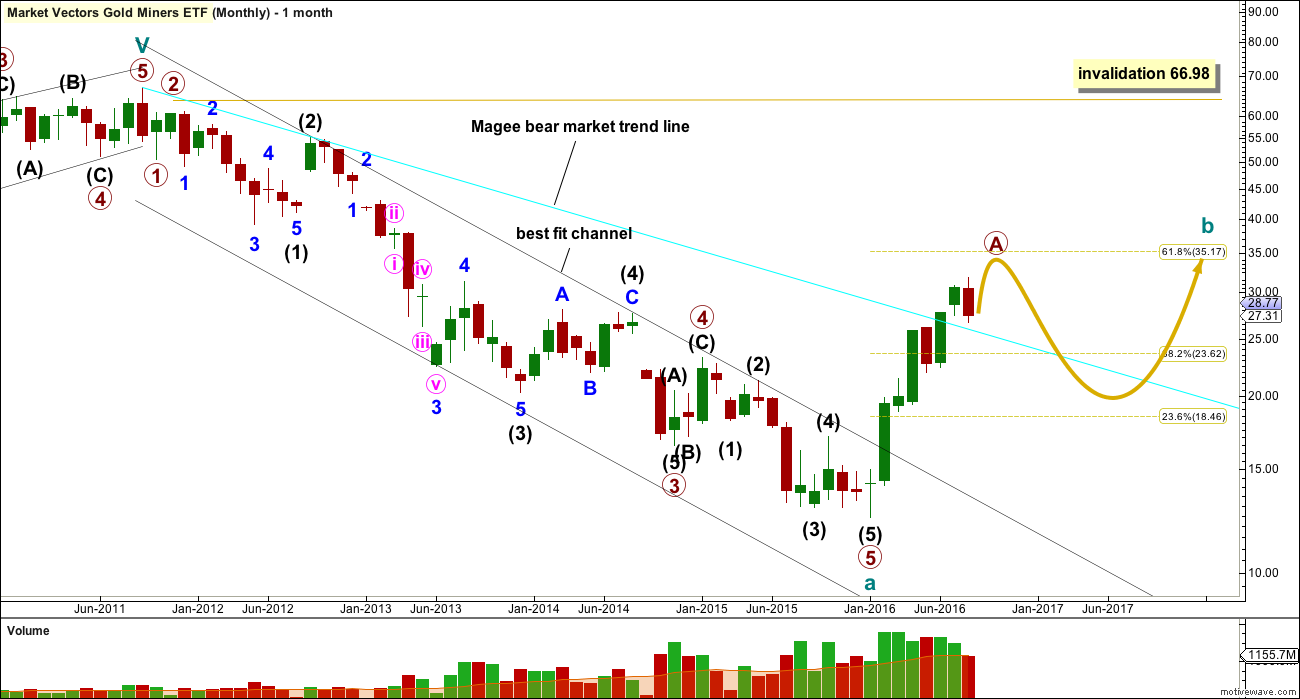
The whole wave down for cycle wave a subdivides well as a five wave impulse. However, GDX does not have adequate volume to produce typical looking Elliott wave structures. As always, this wave count comes with the strong caveat that this market is not sufficient in volume for a reliable Elliott wave analysis. It is a rough guide only. The direction expected from the Elliott wave count should be fairly reliable, but targets and invalidation points may not be.
Ratios within cycle wave a are: there is no Fibonacci ratio between primary waves 1 and 3, and primary wave 5 is 0.33 short of 0.236 the length of primary wave 3.
Ratios within primary wave 3 are: intermediate wave (3) is 3.48 short of 1.618 the length of intermediate wave (1), and intermediate wave (5) has no Fibonacci ratio to intermediate waves (3) or (1).
Ratios within intermediate wave (3) are: minor wave 3 has no Fibonacci ratio to minor wave 1, and minor wave 5 is just 0.02 longer than equality in length with minor wave 1.
Ratios within minor wave 3 are: minute wave iii is 0.38 longer than equality in length with minute wave i, and minute wave v has no Fibonacci ratio to either of minute waves i or iii.
Within primary wave 5, there are no adequate Fibonacci ratios between intermediate waves (1), (3) and (5).
The black channel is a best fit; this movement does not fit into an Elliott channel. The channel is breached very clearly and price has made a major new swing high above 17.04. A trend change was confirmed in February.
If analysis of downwards movement is correct that cycle wave a has subdivided as a five wave structure, then this tells us two things:
1. The bear market for GDX must be incomplete because a five may not be a corrective structure, so this must only be wave A.
2. Cycle wave b may not make a new high above the start of cycle wave a at 66.98.
Cycle wave b may be any one of 23 possible corrective structures. It may be a swift sharp zigzag, or it may be a sideways structure such as a flat, combination or triangle. It should last one to several years. It is possible that it is over. An alternate at the end of this analysis looks at this possibility.
The first movement up for cycle wave b must be a clear five wave structure for a trend of this magnitude. It looks like this completed at the Magee trend line where price found resistance and rebounded down. This line is now breached, providing further strong confidence that GDX is in a bull market for a longer term.
DAILY ELLIOTT WAVE COUNT
Click chart to enlarge.
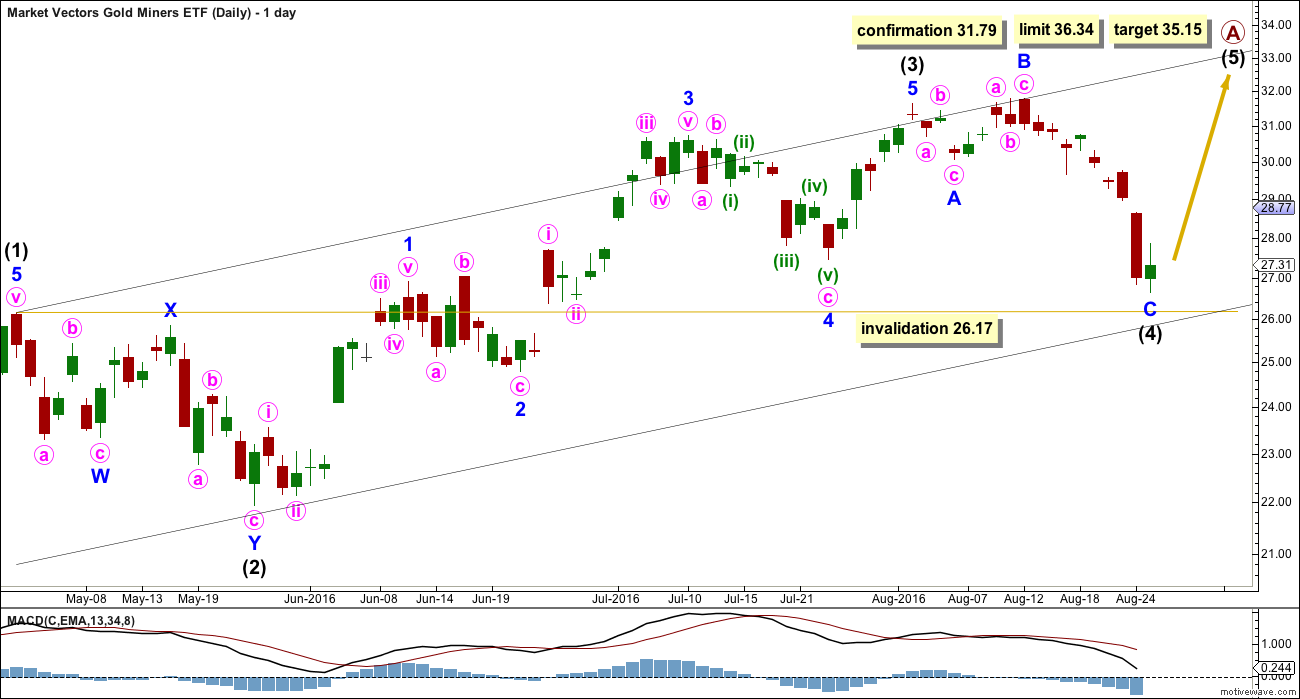
If primary wave A is subdividing as a five and is incomplete, then intermediate wave (4) must end here.
Intermediate wave (3) is shorter than intermediate wave (1). This limits intermediate wave (5) to no longer than equality in length with intermediate wave (3), so that the core Elliott wave rule stating a third wave may not be the shortest is met. This limit is at 36.34.
At 35.15 intermediate wave (5) would reach 0.618 the length of intermediate wave (1).
A new high above 31.79 would invalidate both alternates and provide strong confirmation of this first wave count.
ALTERNATE DAILY ELLIOTT WAVE COUNT
Click chart to enlarge.
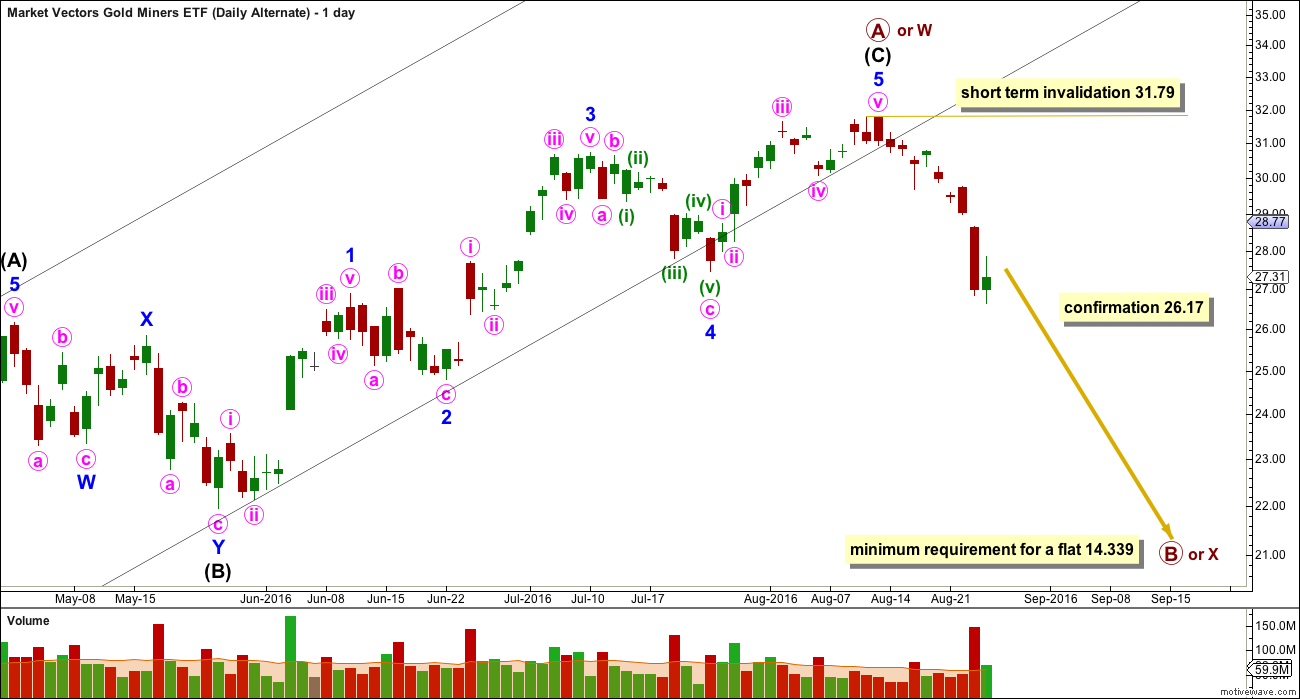
It is possible to see a 5-3-5 upwards complete. This may be a zigzag for primary wave A if cycle wave b is unfolding as a flat correction, or a zigzag labelled primary wave W if cycle wave b is unfolding as a double zigzag.
If cycle wave b is a flat correction, then within it primary wave B must retrace a minimum 0.9 length of primary wave A. This minimum requirement for a flat correction would be met at 14.339.
If cycle wave b is a double zigzag, then there is no minimum requirement for primary wave X within it; primary wave X needs to subdivide as a corrective structure. X waves within double zigzags are normally relatively brief and shallow.
A new low below 26.17 would invalidate the main wave count and provide some confirmation of this alternate.
ALTERNATE MONTHLY ELLIOTT WAVE COUNT

Click chart to enlarge.
It is possible that cycle wave b is now a complete zigzag. It may have ended just short of the 0.618 Fibonacci ratio and looks like a clear three wave structure on the monthly chart.
If cycle wave a is a five and cycle wave b is a three, then cycle wave c downwards must subdivide as a five. Within cycle wave c, no second wave correction may move beyond the start of its first wave above 31.79.
In trying to calculate a target for cycle wave c the 0.382 Fibonacci ratio yields a truncation and the 0.618 Fibonacci ratio yields a negative value. Cycle wave c may not exhibit a Fibonacci ratio to cycle wave a.
Cycle wave c would be very likely to make at least a slight new low below the end of cycle wave a at 12.40 to avoid a truncation.
TECHNICAL ANALYSIS
WEEKLY

Click chart to enlarge.
Price may find some support here about 25.10. However, price has moved strongly lower for the last two weeks to make an important new low below 27.45, and it has done so on increasing volume. Volume is supporting downwards movement. It is likely that price will continue lower.
The next strong area of support is about 21.75.
Overall, volume is declining as price has been moving higher since January. The rise in price is not supported well by volume. This favours a bearish outlook mid term for GDX.
ATR has been strong and increasing. Now it is levelling off, so some decline would be expected.
ADX is very extreme, well above 35, and is now declining. ADX is indicating the trend is most likely exhausted here for GDX but a trend change has not yet been indicated.
On Balance Volume is tightly constrained between the yellow support line and the purple resistance line. A breakout by OBV may indicate the next direction for price, short to mid term.
RSI is returning from overbought after exhibiting double negative divergence with price at the last high.
Overall, this analysis is very bearish for GDX at this time.
DAILY
Click chart to enlarge.
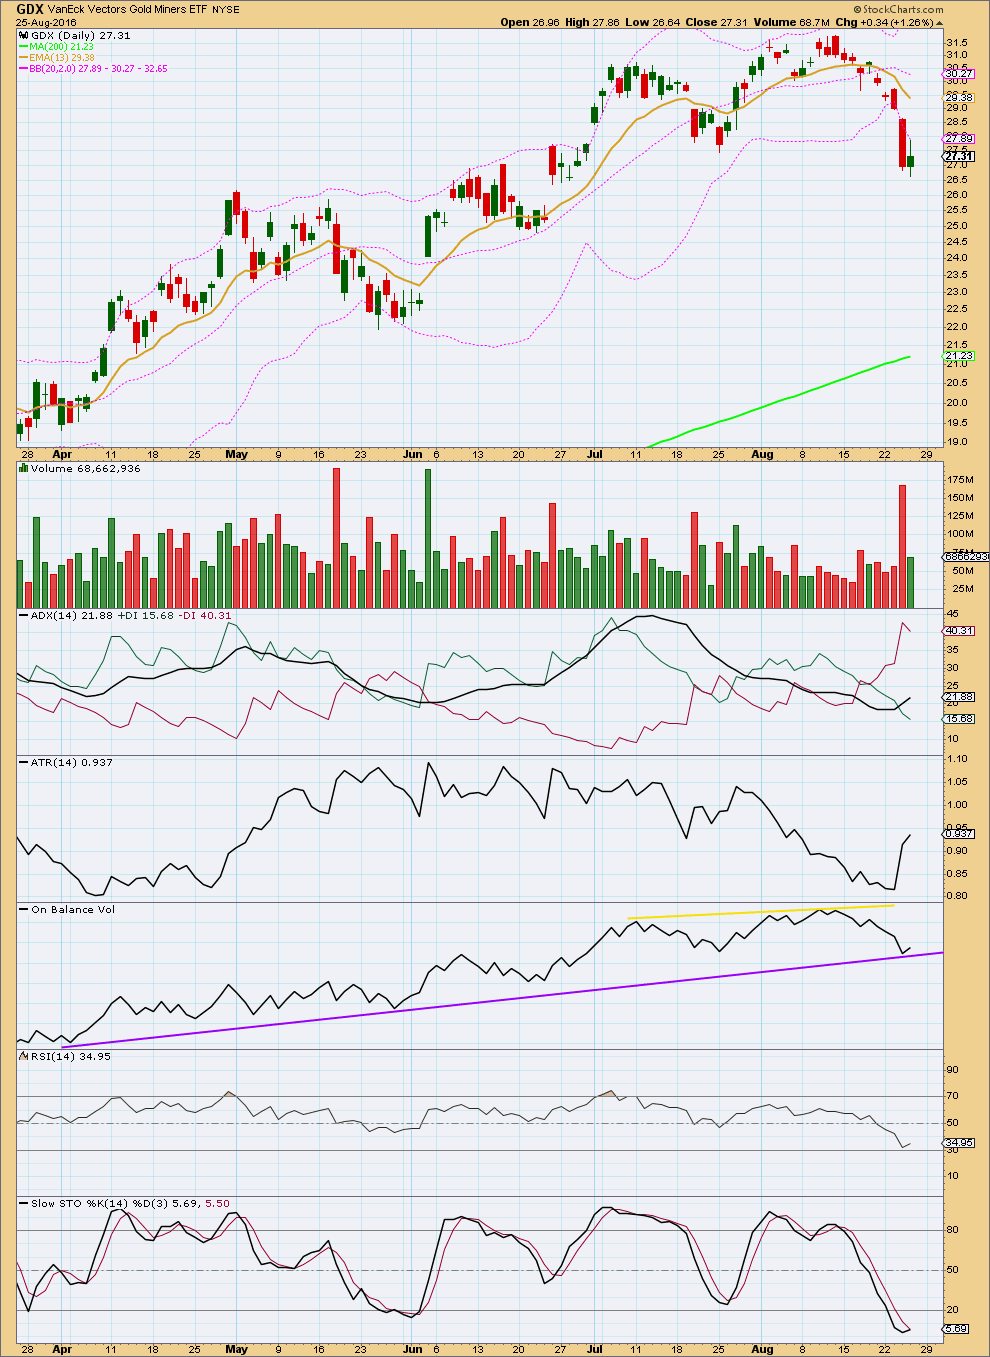
It looks like GDX has had a trend change: It has made an important new low, volume offers some support to downwards movement, and ADX indicates a downwards trend.
ATR is now increasing again after some decline.
With ATR and ADX in agreement, it should be assumed that GDX is in a downwards trend at this time.
On Balance Volume is finding some support at the purple line. This is assisting to bounce up price. How price and OBV behave after this bounce will be indicative. If OBV breaks below the purple line it would be offering a strong bearish signal.
With price right at the lower edge of the Bollinger Bands today, this may also assist to bounce up price. During a trend GDX can remain at an extreme of its Bollinger Bands for several days running though.
RSI is not yet extreme. There is room for price to fall. A low may not be expected until RSI is extreme and then exhibits divergence with price.
Stochastics is extreme, but this oscillator may remain extreme for reasonable periods of time during a trending market. It does not yet exhibit any divergence with price to indicate weakness.
This analysis is published @ 01:38 a.m. EST.
To follow up on Richards point below, I always want to see that gold and GDX counts are highly correlated.
A couple of years ago, I looked at almost 5 years worth of daily data to compare golds direction to GDX. I found that 93% of the time, gold and GDX went the same direction on any given day. I did not look at the amount of gain or loss, just the direction. Anecdotally, we know that there are days when one moves much more significantly that the other.
It looks like we may need some time for the counts to develop. I see some correlation with the GDX main count and gold’s counts and maybe some correlation between the GDX daily alternate with golds current counts if there’s a shallow x wave. I don’t see the monthly alternate working at all unless gold turns down hard which there is no current count for.
So, in closing, Lara thanks for the GDX update. I’m sure we will get more clarity soon.
PS It appears that you decided not to move the wave degree of the overall count up one level as we had previously discussed?
Dreamer, I agree that GDX and gold are highly correlated esp. it shows that in the weekly chart. I am also interested to know why Lara decided not to move the wave degree up one level?
I haven’t studied this in great detail like you have, Dreamer, but it seems to me, from my observation, that GDX will often follow $SPX on days when $GOLD and $SPX are diverging.
Those days when $GOLD and $SPX are moving in the same direction, especially when one or the other moves rather powerfully, are days when GDX is likely to make it’s biggest swings. This past Wednesday (8/24) is a good example.
My comment above is about intra-day price swings. Big picture, of course, GDX and $GOLD are very closely correlated, as anyone can observe — not like twins, but maybe like cousins with a strong family resemblance.
MIners’ sentiment swings more extremely that gold and can be slower or faster at times.
It does seem that miners sometimes act like stocks. That would be another interesting comparison to make with facts. Maybe I’ll do that someday.
Ah! That’s only because I forgot 🙁 Sorry Dreamer, will go back and do that.
No worries, just thought maybe there was some logic to it.
Hopefully Motive Wave makes the change easy. I have to do each set of waves manually using the free websites….
Lara, thanks for the update. Could you tell me what is the common length for cycle b if it’s double zipzag? How long does it take? From your post, I know there is no minimum requirement for the length, but please give us an educated ‘guess’ based on your experience. Thanks!
It’s usually shallow and quick. Most often a zigzag. Most often the 0.382 Fibonacci ratio, or even 0.236 Fibonacci ratio.
It often looks the same as the B waves within the zigzags. So that the whole thing looks like a stretched out zigzag.
Most often, but not always. Sometimes they can be more complicated.
Thanks, Lara.
Lara I just did a quick review and it appears to be quite different than gold.
I’m reminded of your comment about how gold follows Elliott Wave to the textbook, however due to the reduced volume of GDX it doesn’t follow Elliott Wave by the book and when in doubt that gold is to be followed.
I know that gold and miners most often follow each other so I would be surprised to have a radical direction change between gold and GDX.
However gold did bottom December 3rd and miners bottomed mid January and when gold topped the miners kept making new highs, however possibly when the outlook for gold looks bearish for an extended period of time then investors may bail out of miners excessively so they become much more oversold than gold before they adjust back towards gold.
I may of answered my own question and if gold does head down to 1,279 then miners would drop much more deeply than gold would. Miners swing to much greater extremes than gold does. I’m glad I’m not holding any miners at this time. Thank you.
As I finished up this GDX analysis I was aware how bearish it was.
I will have this in mind tonight and tomorrow when I do Gold analysis for end of week.
Lets see how Gold’s weekly candlestick ends.
I suspect my analysis for Gold may have to be more bearish…. this very bearish GDX analysis does offer some support for the alternate more bearish wave count for Gold.
Yep. A tremendous amount of technical damage done on multi time frame levels to the GDX chart. It is difficult to imagine the Gold price will not be similarly affected. I do not consider my miner positions a short, or even medium term trade. I am defending my long positions by selling calls and using the proceeds to buy puts on the miners I hold. The objective is to roll profits from the puts into additional shares. I think the decline in the miners is going to be steep. I also suspect there are many other buyers like myself who are not leveraged to the hilt via futures or margin who will continue to accumulate shares during the decline. The implications for the next leg up are substantial. At the next bottom there will not be too many, if any, weak or highly leveraged hands holding long positions. What tactics the banksters will employ at that time to try and manipulate prices should be most interesting. 🙂
Yup, I also employed similar strategy by using Collar selling calls and utilize the credit to buy put for hedging. However, my positions are mainly for swing trading, so I also set up a stop for them. I sold them if stop is hit. Based on your statement, it seems you are a long term investor. Good luck! 🙂