
More downwards movement unfolded as expected.
Summary: Some weakness is now seen to this downwards movement. Volume today has declined further and the daily candlestick has a long lower wick. Some sideways / upwards movement may begin here for a few days. If this analysis is wrong, it may be in prematurely expecting an end to downwards movement; there is still a little room for price to fall further.
New updates to this analysis are in bold.
Grand SuperCycle analysis is here.
Last monthly and weekly charts are here.
DAILY ELLIOTT WAVE COUNT
Click chart to enlarge.
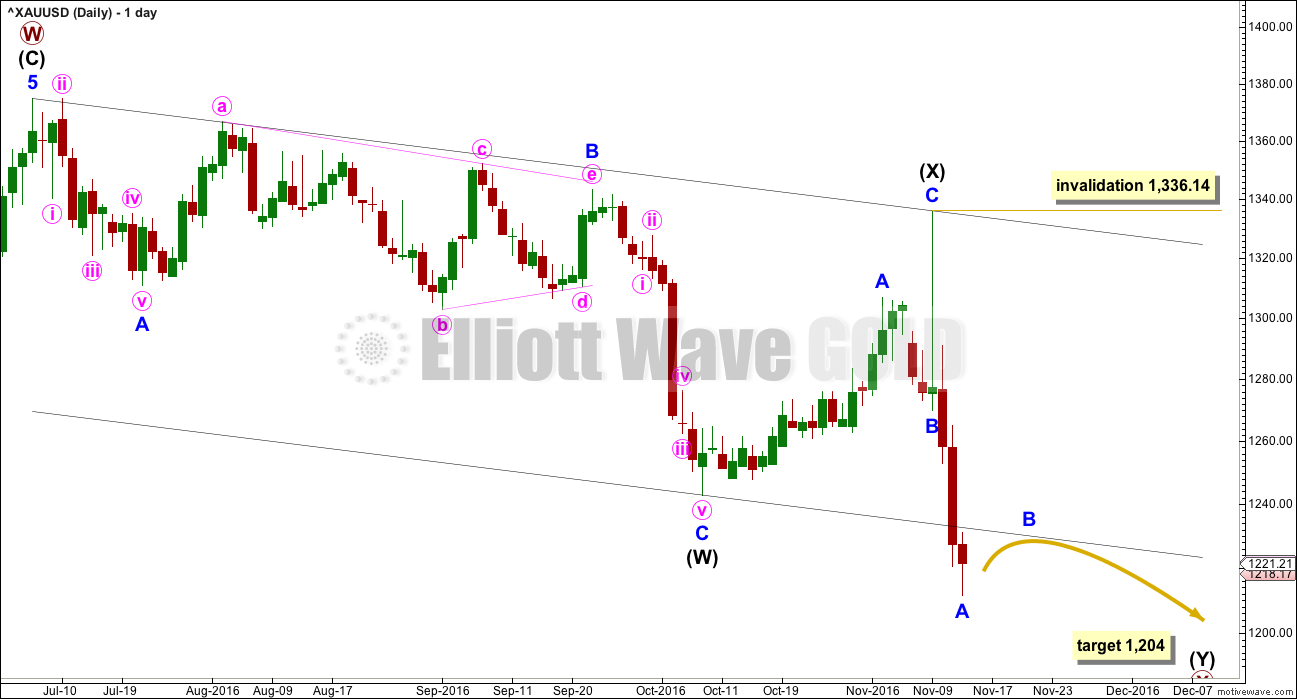
The larger structure of primary wave X may be either a double zigzag or a double combination. The second structure in this double for primary wave Y may be either a zigzag (for a double zigzag) or a flat or a triangle (for a double combination).
It is my judgement at this stage that it is more likely primary wave X will be a double zigzag due to the relatively shallow correction of intermediate wave (X). Although intermediate wave (X) is deep at 0.71 the length of intermediate wave (W), this is comfortably less than the 0.9 minimum requirement for a flat correction. Within combinations the X wave is most often very deep and looks like a B wave within a flat.
However, there is no minimum nor maximum requirement for X waves within combinations, so both a double zigzag and double combination must be understood to be possible. A double zigzag is more likely and that is how this analysis shall proceed.
Within the second structure, minor wave A should be a five wave structure. When it is done, then minor wave B may not move beyond the start of minor wave A above 1,336.14.
Now that minor wave A has closed below the channel about primary wave X, in the first instance minor wave B may find resistance there. If price closes back above this trend line, then Fibonacci ratios will be used for targets for minor wave B.
When minor wave B is complete, then a target for minor wave C downwards may be calculated at minor degree. The target may then change.
At this stage, at 1,204 intermediate wave (Y) would reach equality in length with intermediate wave (W). If this target is wrong, it may not be low enough.
HOURLY ELLIOTT WAVE COUNT
Click chart to enlarge.
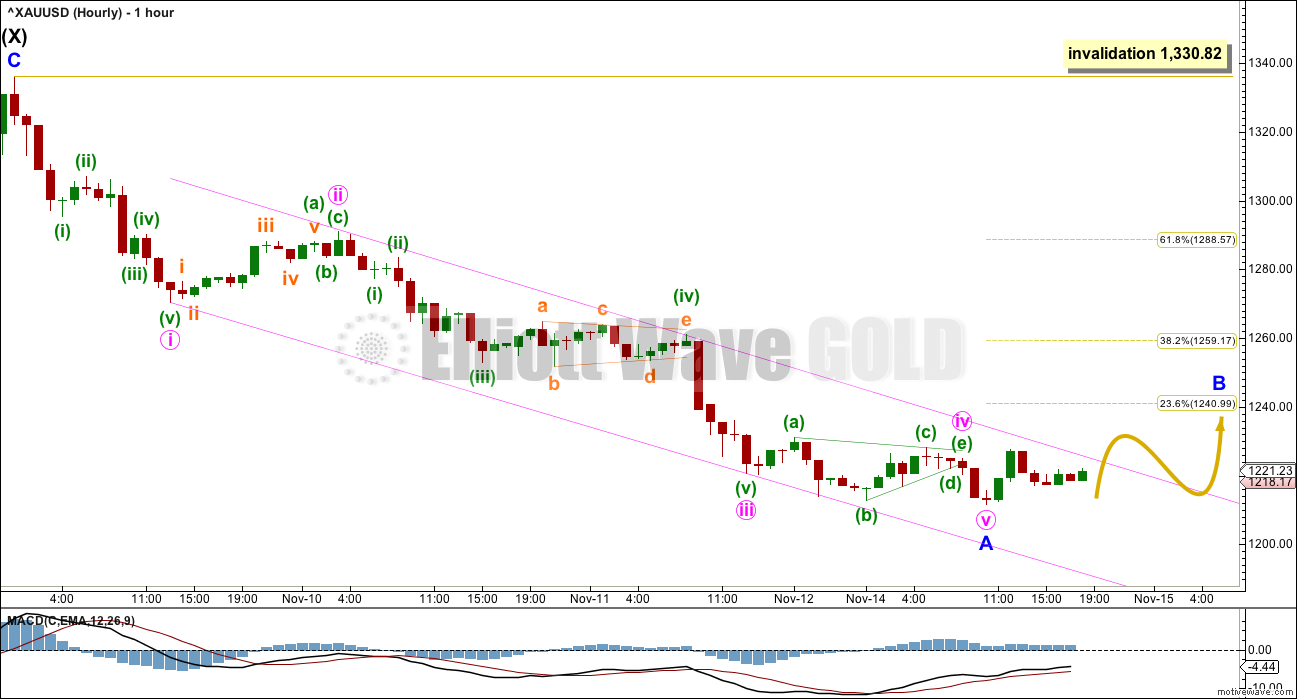
If this wave count is wrong today, it will be in expecting that minor wave A is complete. It is possible that while price remains within the channel that minor wave A may continue lower, so Gold may make a new low within the next 24 hours.
When the channel is breached by upwards movement, that shall provide some confidence in this wave count at the hourly chart level.
There is weakness to downwards movement at the last lows. MACD exhibits divergence.
Minor wave B may be any one of more than 23 possible corrective structures. It may include a new low if it is a running triangle, expanded flat or combination. It is likely to show up on the daily chart as at least one or more green candlesticks or doji.
If minor wave B finds resistance at the lower edge of the channel on the daily chart, then it may reach only to about the 0.236 Fibonacci ratio at 1,241. If it moves above this point, then the 0.382 and 0.618 Fibonacci ratios would be equally likely targets for it to end.
If minor wave A is correctly analysed as a five wave structure, then minor wave B may not move beyond its start above 1,330.82.
TECHNICAL ANALYSIS
WEEKLY CHART
Click chart to enlarge. Chart courtesy of StockCharts.com.
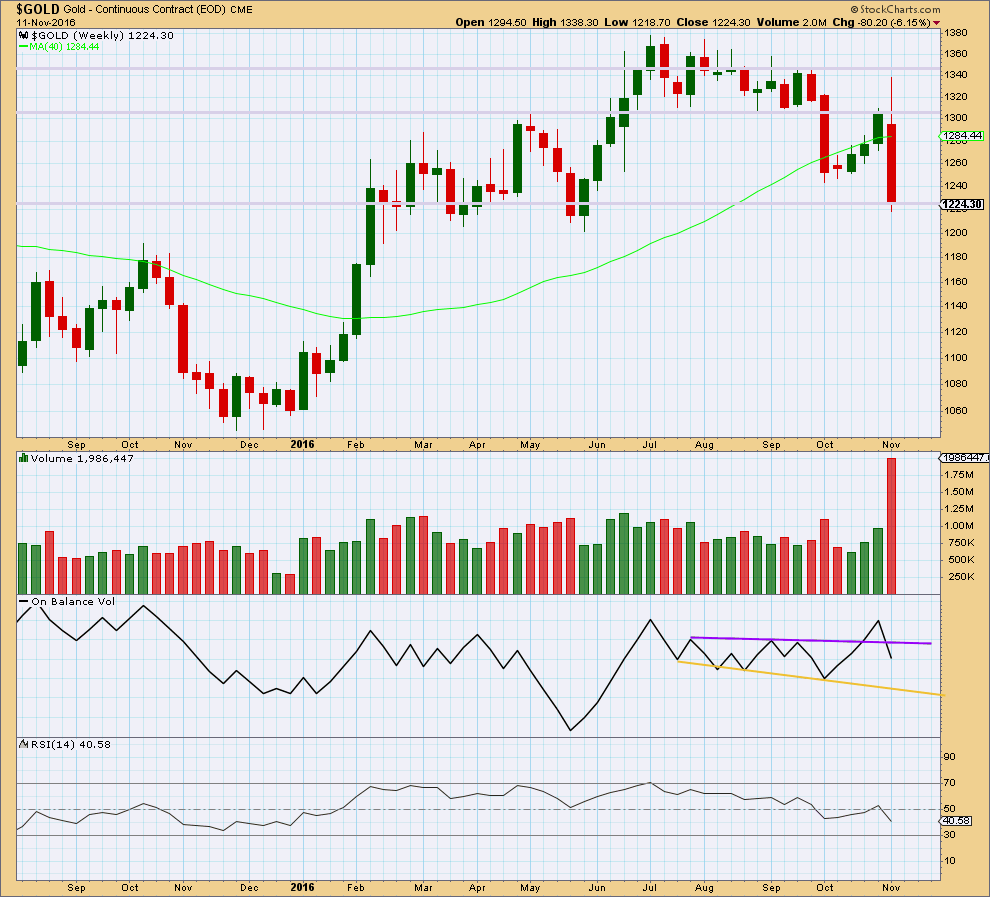
A strong downwards week comes with a very strong increase in volume. The fall in price is well supported.
The long upper wick on last weekly candlestick is very bearish.
On Balance Volume gives a bearish signal last week with a break below support at the purple trend line.
RSI is not extreme. There is plenty of room for price to fall. Also, there is no divergence between price and RSI this week to indicate weakness.
The larger picture last week is very bearish.
DAILY CHART
Click chart to enlarge. Chart courtesy of StockCharts.com.
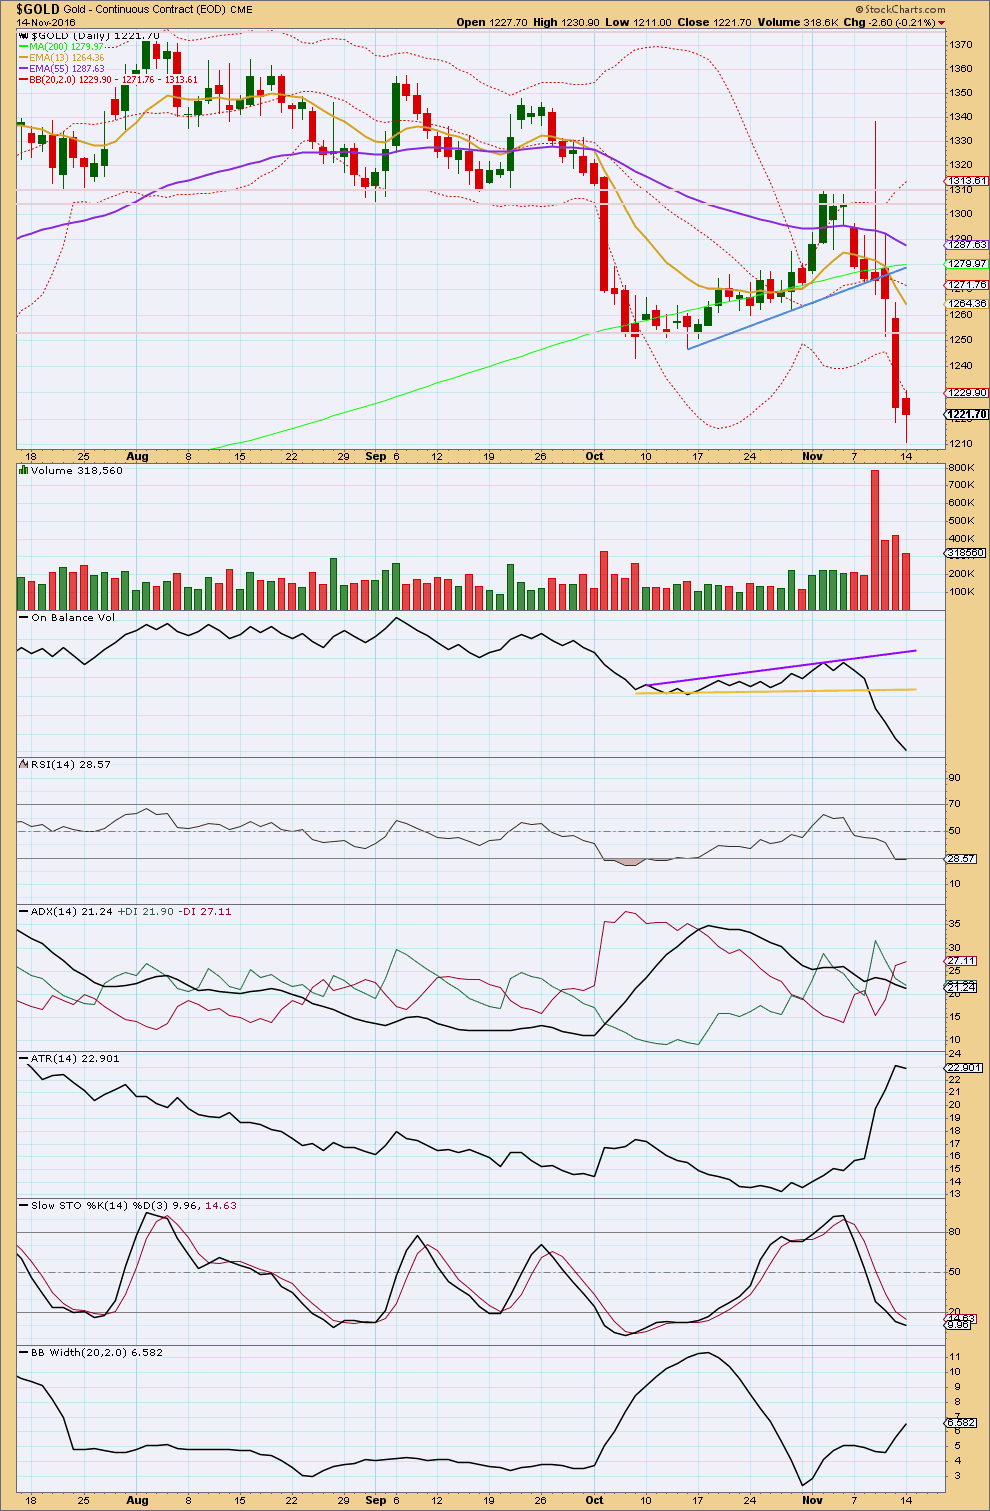
A smaller range downwards day comes with a reasonable decline in volume. The long lower wick is bullish. Bears were able to make a new low, but bulls rallied to push price reasonably higher at the end of the session. It looks like the bears are at least temporarily tired.
On Balance Volume is still bearish. There is no trend line at this stage for support.
RSI is oversold, just. It does not exhibit any divergence with price at this stage; it moved very slightly lower today while price made a new low also. There is a little room for more downwards movement. If this analysis is wrong today, it may be in expecting a low a day before the low arrives.
ADX is declining and does not indicate a trend. ATR today declined in agreement, but one day is not enough to say ATR has stopped increasing.
Bollinger Bands widened further today. Price has closed for two days below the lower range. When Gold trends strongly, it can close outside Bollinger Bands for several days running.
This analysis is published @ 06:55 p.m. EST.
Gold is correcting with a small doji today, finding resistance perfectly at the lower edge of the big channel on the daily chart.
As long as that trend line holds then this is an opportunity to enter short.
Do not invest more than 3-5% of equity, and ALWAYS use a stop. Trading without a stop leaves your entire equity at risk. Even if it’s a mental stop use it and stick to it.
The risk here is that price may break above the trend line for a deeper correction.
Risk for short at 1240.99$ or next Fibo level 1259.17$?
One of the more reliable indicators of golds future direction, while not immediate has been the selling or buying of golds futures by the commercials. Goldseek publishes this every Friday for the tues position earlier in the week. We will see what has occurred since this big drop. If the commercials are starting to buy big time….50 k contracts or so I would think the bottom is close, that is my suspicion, but will have to wait. Since the first leg up of this market we have corrected approx 61.8 percent in the hui and xau….plus or minus.
If we are in a bull market then perhaps we are at or close to the end of wave 2 down with wave 3 to come,….if so Jnug went up 1000 percent in wave one….if wave 3 comes could be a nice buy here or soon if you have a strong stomach. All conjecture, you are responsible for and make your own decisions as Lara has warned us all many times, as well as amount invested, 2 to 3 percent. Good luck.
That’s a good point Dermot, thanks for the comment.
From the EW perspective: this could mean that minor C down may be relatively short in comparison to minor A. The target at 1,204 may well be all that the next wave down gets to.
What I’m looking for: a new low, even by a small amount, coming with divergence with RSI at the last low of 14th November. When Gold ends its waves it often (not always) does it with RSI moving to extreme, then a slight new price extreme with short term divergence with RSI. And that is the end.
As Dreamer correctly notes below there is longer term divergence already with RSI between the last two swing lows of 7th October and 14th November. I want to see that short term divergence as well, because the Elliott wave count needs one more low.
The reason why I don’t publish any analysis of COT reports is that it can remain extreme for weeks before price turns. That, and I just am not learned enough about this specific metric to be confident in analysing it for you. Cesar has purchased a copy of “The Commitments of Traders Bible” by Stephen Briese. It’s next on my reading list. When I’ve read that and digested it then I may add this to my daily analysis for you. I think it is important.
I think your right about one more low. Some gold stocks have already reached their 61.8 percent levels, assuming this is a 2 down and this is where 2’s sometimes end. Gold and silver aren’t quite there. I think gold would have to reach 1172 plus or minus and silver about 16.5. Probably would be some churning there, but as you say may not get below 1204. I guess nibbling is the key, trying to get what you are comfortable with knowing there may be more downside but possibility of big upside. Cots don’t work on a dime but they sometimes come in handy when they get at extremes and everyone is bullish or bearish. I would think most are bearish on gold stocks right now. The $bpgdm on stock charts for gold stocks is around 10 percent now. That coupled with oversold stochastics and a possible switch by the commercials to going long may suggest a bottom here. I would feel a whole lot more comfortable with the commercials confirming otherwise may just get a bounce. In the prior bull market commercials net short 175 k contracts seemed to be the bottom zone. In gold bear market it was about 50 k net short.
Hi Lara, or any other experienced traders.
Oil is correcting, would this offer another entry point to enter short?
Where do you think it could turn south again?
I’m concerned that this upwards day is too strong for Oil to be a smaller correction, I’m concerned that something else may be happening.
However, my short position has such a good entry point at 50.261 I don’t think that’s going to be taken out yet, and the Elliott wave count for Oil requires a minimum low at 28.61. I going to proceed on the assumption that my Elliott wave count for Oil is right.
I think I’ll open a long hedge, and hold onto my short until it meets the target.
I do expect this is still a correction, but I think it is not done yet and will move higher for a few days. It has to relieve some extreme oversold conditions before price can fall again.
I want to hold onto my short because a fifth wave down is in the wings, they are usually explosive for commodities. I don’t think this upwards correction will get close to my entry.
So for those looking for an entry for Oil, hold off. This correction shows no signs of weakness yet. I’ll update Oil today then will comment when I expect this correction is done.
After taking a closer look at hourly and 15 minute charts I’m exiting the whole of my position. I may open a small long as this upwards wave currently shows no sign of weakness.
I’ll either open a small long position, or stand back and wait for the next entry.
Oil being updated now.
Maybe at the upper blue trend line. Chart by Eagle Seagle.
https://goldtadise.com/?p=387293
Lara is due for an update also.
Gold’s friend is in trouble. India is the largest retail gold market.
Yesterday I had a post why gold went down.
Effect of India’s currency rule is evident.
MUMBAI — The jewelry stores in India’s biggest bullion market were empty Monday as the nation’s gold trade reeled from the impact of the ongoing currency crunch.
Gold dealers said business, which should have been booming as the country enters its wedding season, has dropped off precipitously since the government’s surprise announcement that it was scrapping its larger currency notes and replacing them with new bills. India is the world’s second-largest consumer of gold.
https://www.washingtonpost.com/world/asia_pacific/indians-bought-gold-with-bags-of-money-last-week-this-week-nobodys-buying/2016/11/14/99baff04-41ad-4e29-b46e-d3980b975dfb_story.html
Lara, isn’t this considered positive (bullish) divergence when you look at RSI, MACD, and STOC versus price from Oct to now? or are you looking for a smaller range of divergence around the current price?
Yes, definitely, regular bullish divergence.
And yes, what I’m looking for is short term regular bullish divergence as well. What I notice is that RSI will move into oversold / overbought, then price will move slightly lower and RSI will move slightly higher. That’s a good signal that the low is in.
It does tend to work better for highs than lows though I think, but to be fair I’ve not done a quantitive analysis of that, it’s just a judgement on experience (and my judgement could be off).
You’re right. This does favour a bullish outlook for sure.
“I notice is that RSI will move into oversold / overbought, then price will move slightly lower”
Poorly chosen words there.
I’ve put it more clearly above in my reply to Dermot.