
Price moved lower and bounced up off the lower edge of the channel on the daily and hourly Elliott wave charts. This indicates the main hourly Elliott wave count remains more likely than the alternate.
Summary: The bottom line is still that it must be accepted there is no indication yet of an end to this upwards wave while Gold remains within the channel and above the confidence point of 1,195.82. However, the situation today is more bearish than recently, so it is more possible for Gold and GDX today that a high is in place. In the short term, now a new high above 1,210.64 would add confidence that the upwards trend is most likely intact, and the targets are now 1,234 or 1,288. If price breaks below the lower edge of the gold channel, then a target for a deep correction would be at or below 1,160.
New updates to this analysis are in bold.
Last monthly and weekly charts are here. Last historic analysis video is here.
Grand SuperCycle analysis is here.
MAIN ELLIOTT WAVE COUNT
DAILY CHART
Click chart to enlarge.
This main wave count has a better fit for prior movement. To see the difference between this main wave count and the alternate below please refer to last historic analysis linked to above.
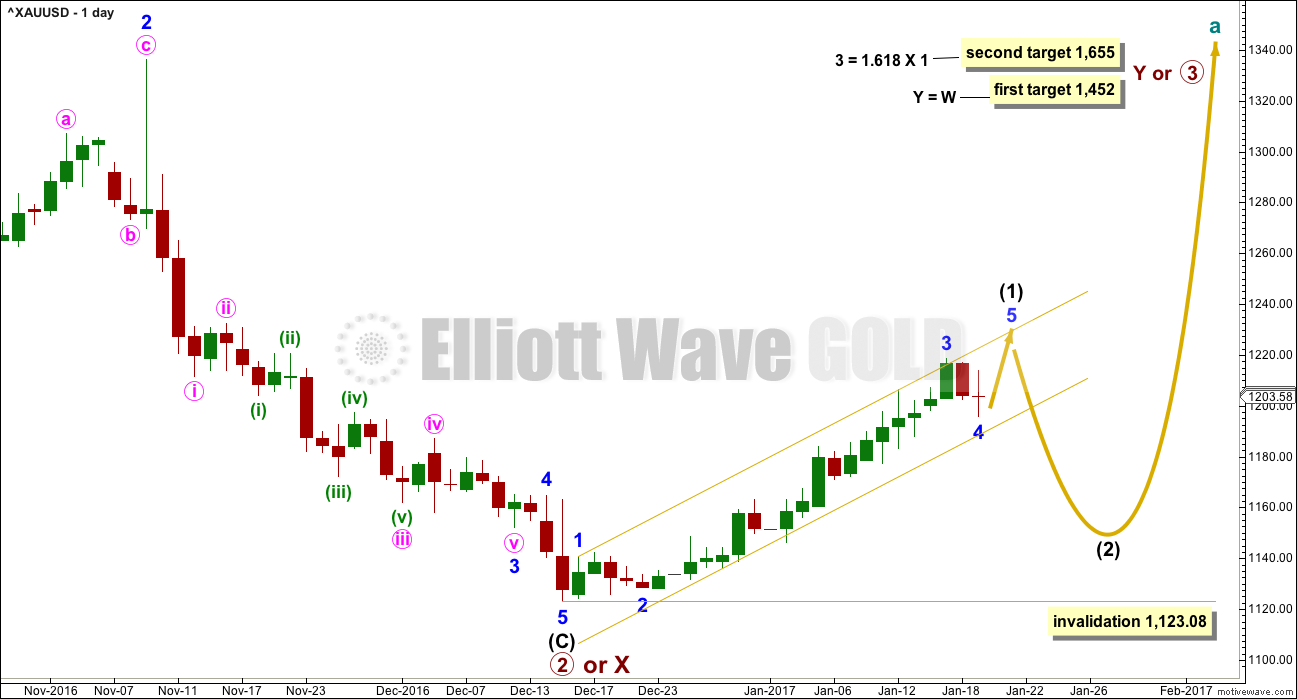
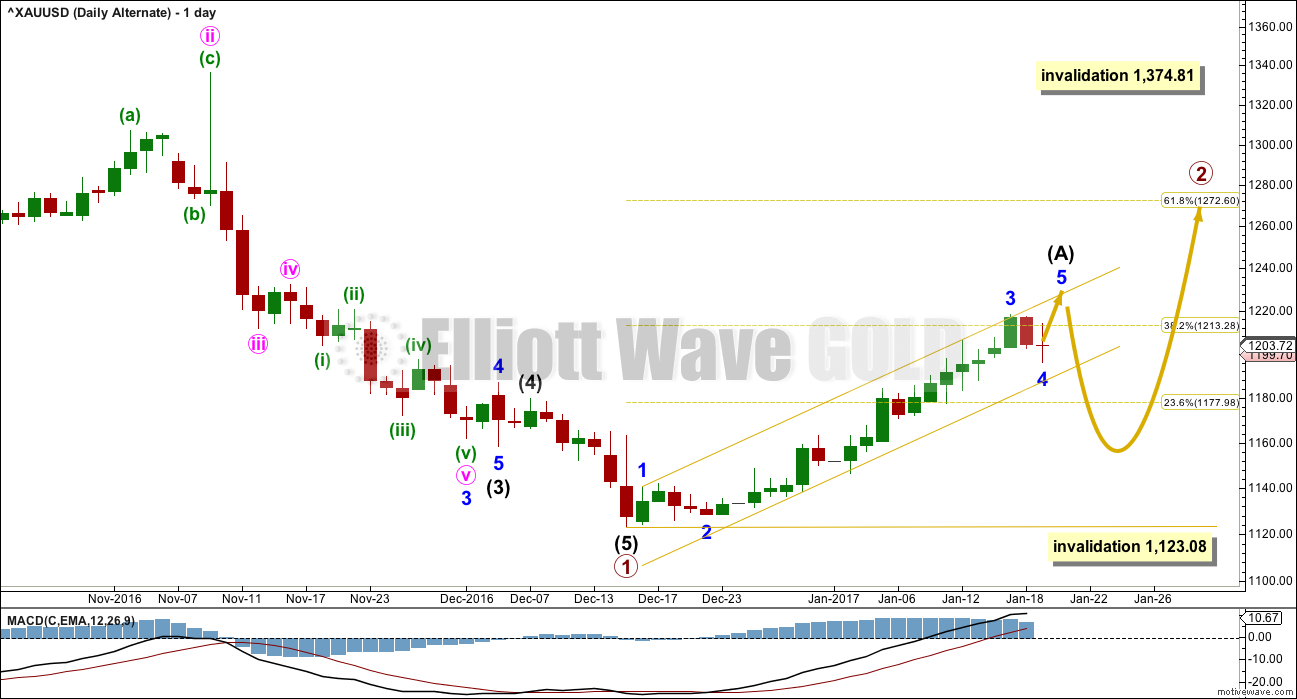
This main wave count expects Gold has had a primary degree trend change in December 2016. The new upwards wave is either a primary degree third wave, or a primary degree zigzag to complete a double zigzag.
Intermediate wave (1) may not exhibit a Fibonacci duration. So far price remains within the gold channel. A breach of the gold channel on the daily chart would provide strong indication of a trend change.
While price remains within the gold channel, then it must be accepted that it is likely to continue higher. A breach of the gold channel would indicate intermediate wave (1) is over and intermediate wave (2) has arrived.
The first in a series of second wave corrections for Gold’s new impulses is usually very deep. Intermediate wave (2) is expected to be at least 0.618 the depth of intermediate wave (1), and very likely may be deeper. It may not move beyond the start of intermediate wave (1) below 1,123.08.
The upcoming correction for intermediate wave (2) should present an opportunity to join a new trend.
Intermediate wave (2) may be at least as long in duration as intermediate wave (1), and fairly likely it may be longer. A Fibonacci 21 or 34 sessions will be the expectation. Corrections are often more time consuming than impulses.
The structure within intermediate wave (1) is today changed. The new labelling is shown below, and this now has a better look on the daily chart. The next wave up for Gold may now be minor wave 5, just beginning today.
Gold often exhibits swift strong fifth waves, but this does not have to happen for minor wave 5. But it is a common tendency, so traders should look out for it.
The touch of support at the lower trend line presents an opportunity to join the upwards trend today.
HOURLY CHART – DETAIL
Click chart to enlarge.
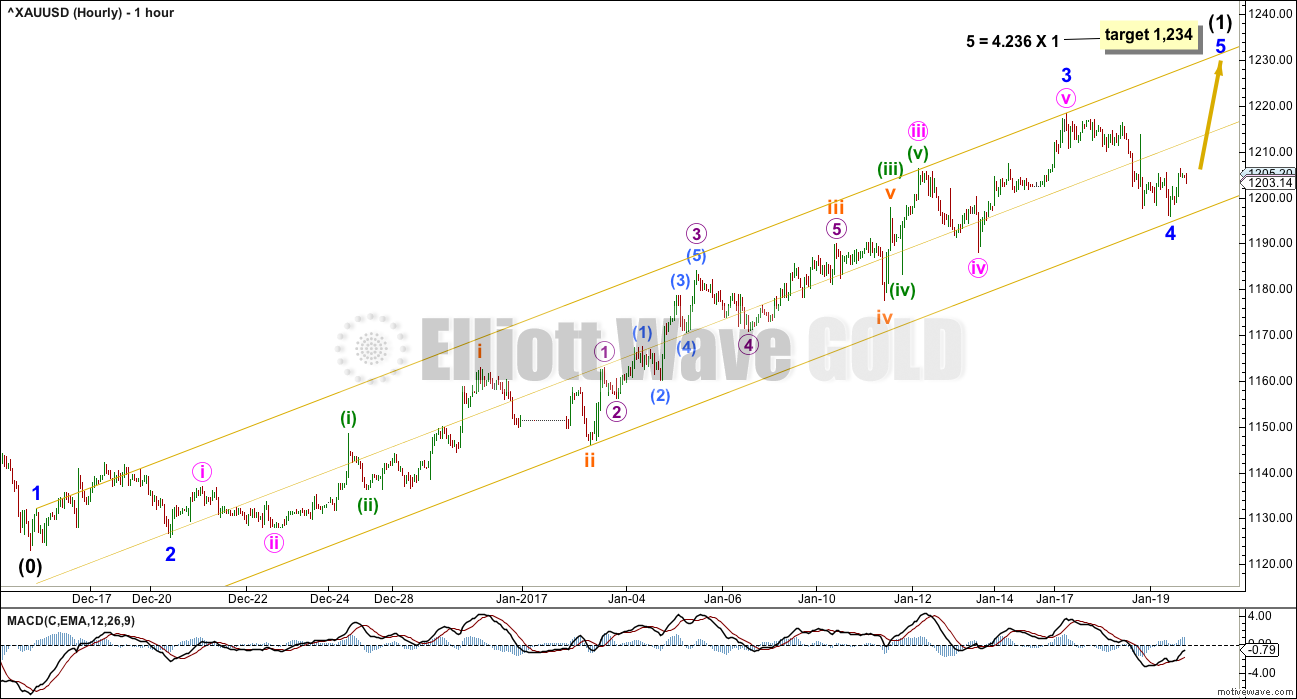
This hourly chart shows all the detail of intermediate wave (1) so far.
There is no Fibonacci ratio between minor waves 3 and 1. This makes it more likely that minor wave 5 will exhibit a Fibonacci ratio to either of minor waves 3 or 1, and most likely a ratio to minor wave 1.
Fibonacci ratios within minor wave 3 are: minute wave iii is 2.02 longer than 6.854 the length of minute wave i, and minute wave v is 1.30 longer than 2.618 the length of minute wave i.
Fibonacci ratios within minute wave iii are: there is no Fibonacci ratio between minuette waves (i) and (iii), and minuette wave (v) is just 0.27 short of 0.382 the length of minuette wave (iii).
Fibonacci ratios within minuette wave (iii) are: subminuette wave iii is just 0.57 longer than 1.618 the length of subminuette wave i, and subminuette wave v has no Fibonacci ratio to either of subminuette waves i or iii.
Fibonacci ratios within subminuette wave iii are: micro wave 3 is just 0.76 longer than 1.618 the length of micro wave 1, and micro wave 5 is 1.81 longer than 0.618 the length of micro wave 3.
Fibonacci ratios within micro wave 3 are: submicro wave (3) is just 0.37 longer than 1.618 the length of submicro wave (1), and submicro wave (5) has no adequate Fibonacci ratio to either of submicro waves (3) or (1).
All Elliott wave rules are met. Minor wave 1 is short and minor wave 3 is a long extension. Minor wave 5 may also be extended. If the target is wrong for this wave count, it may be too low. A higher target may be for minor wave 5 to reach equality in length with minor wave 3 at 1,288.
The channel is a best fit. Draw the first trend line from the ends of minor waves 1 to 3, then pull a parallel copy lower to the end of subminuette wave ii, so that all movement is contained. The bottom line is still that while price remains within this channel we should expect that the upwards trend is intact. Only when that channel is breached should we consider a trend change.
HOURLY CHART
Click chart to enlarge.
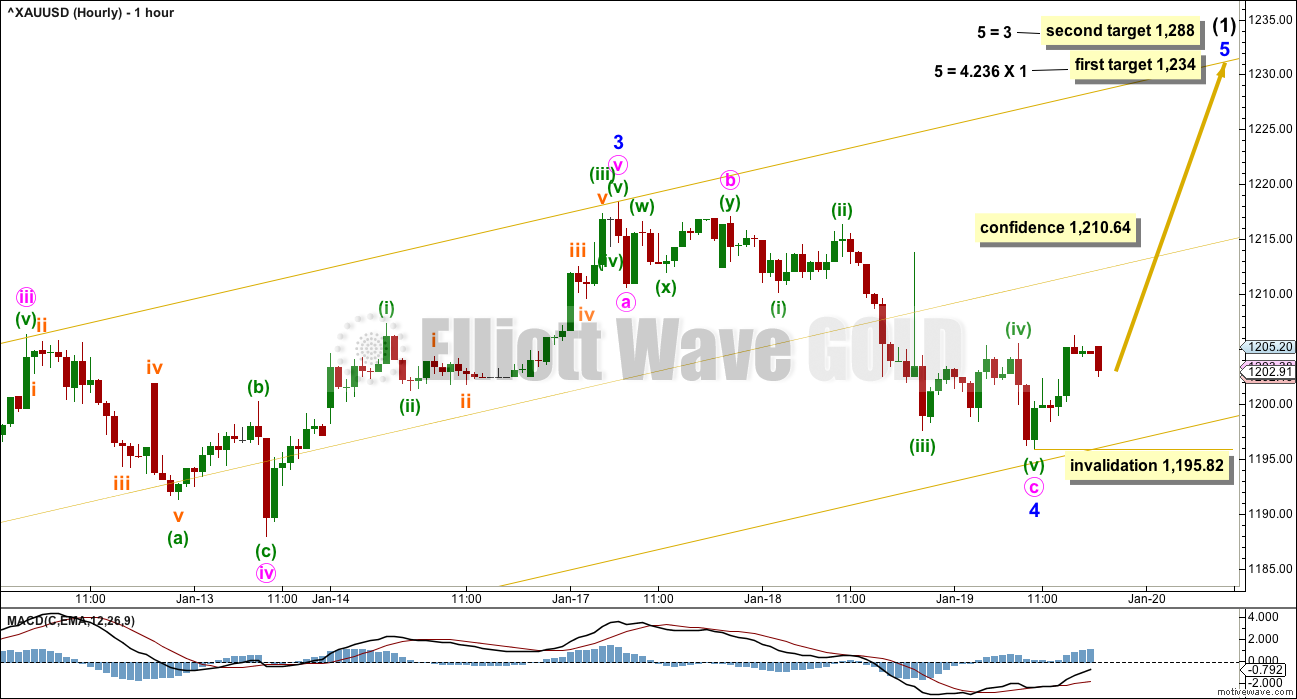
The test of the lower gold trend line today may have been minor wave 4. This has a good look at the daily chart level.
Minor wave 5 may be extended. When and if price gets to the first target, if the structure is incomplete or if price keeps rising, then the second target would be used.
Within minor wave 5, no second wave correction may move beyond the start of its first wave below 1,195.82. A breach of this invalidation point would also necessitate a breach of the gold trend channel. At that stage, the alternate hourly wave count below should be used.
We should always assume that the trend remains the same until proven otherwise. Assume the upwards trend is intact until proven otherwise by a trend channel breach. I define a breach as at least one full hourly candlestick below and not touching the lower trend line.
ALTERNATE HOURLY CHART
Click chart to enlarge.
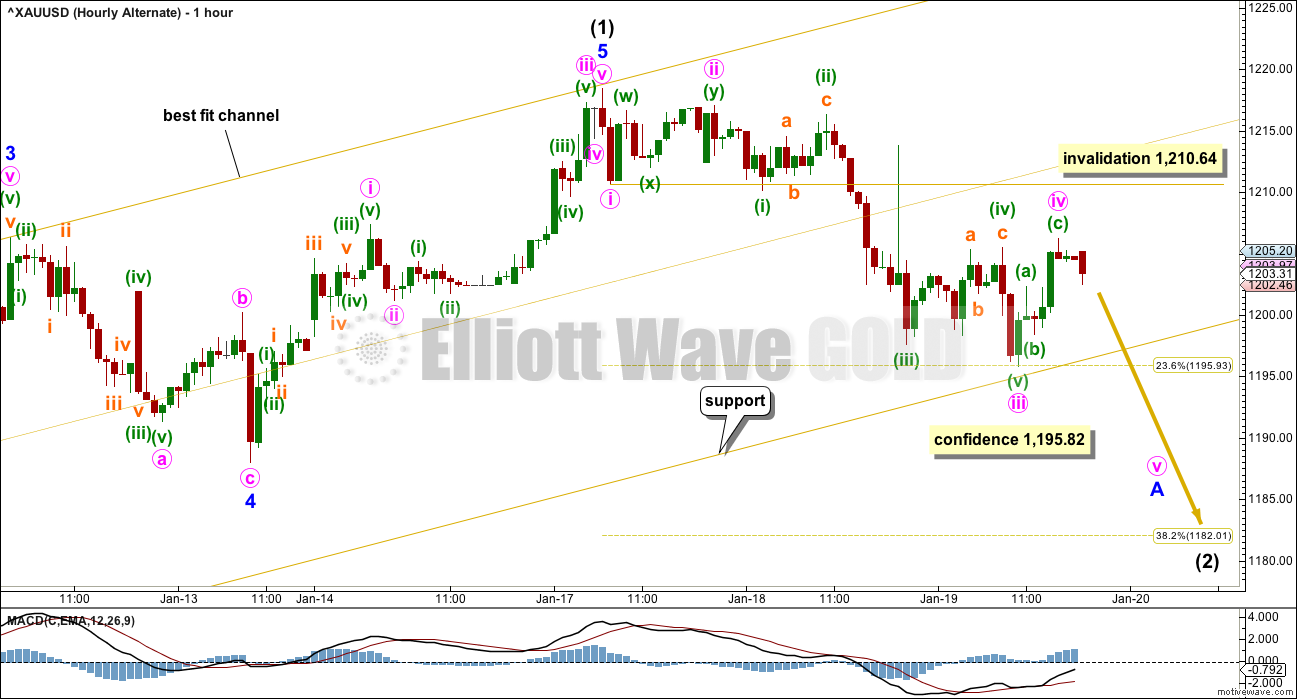
In the short term, a new low below 1,195.82 at this stage would now offer some confidence in a trend change.
Intermediate wave (2) should begin with a clear five down at the hourly chart level for a movement of this degree. So far only waves 1 through to 4 may be complete. At this stage, I am labelling them at minute degree, but this may need to be changed and moved down one degree.
Minute wave iv may not move into minute wave i price territory above 1,210.64. If this alternate is invalidated, that would offer some confidence to the main wave count.
If price comes down again to touch the lower edge of the gold best fit channel (which is drawn now very slightly differently on hourly charts), then watch it again very carefully. If price again bounces up from the lower gold line, then the main wave count would look more likely. But if price slices easily through this line on the next test, then the probability of this alternate would increase substantially.
If the lower gold trend line is breached, then long positions should not be held for the short term. The probability of a very deep correction would be high.
The first big second wave correction within Gold’s new trends is often very deep. The first target for intermediate wave (2) would be the 0.618 Fibonacci ratio of intermediate wave (1) at 1,160, but this may not be low enough.
ALTERNATE ELLIOTT WAVE COUNT
DAILY CHART
Click chart to enlarge.
This alternate wave count expects that Gold is still within a bear market. Targets for new lows can be seen on weekly and monthly charts.
Within the bear market, a primary degree correction is underway.
Primary wave 2 is most likely to subdivide as a zigzag. So far it looks like a five up is either complete now or very close to completion. This may be intermediate wave (A).
Intermediate wave (B) may not move beyond the start of intermediate wave (A) below 1,123.08.
Primary wave 2 may not move beyond the start of primary wave 1 above 1,374.81.
TECHNICAL ANALYSIS
WEEKLY CHART
Click chart to enlarge. Chart courtesy of StockCharts.com.
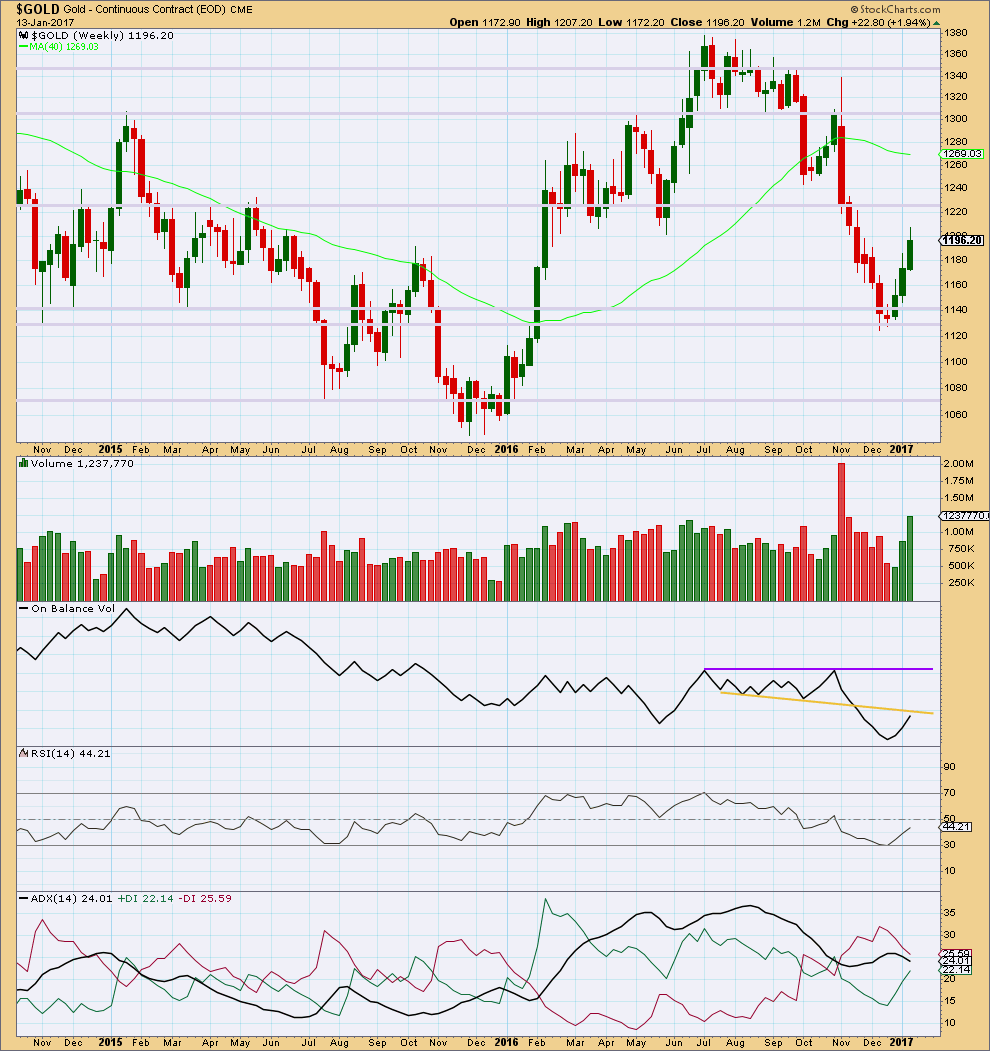
Gold has moved higher for three weeks in a row on increasing volume. The rise in price is well supported by volume. This upwards movement looks healthy.
A Morning Star candlestick pattern at the last low indicates a possible trend change there.
Next resistance is about 1,225.
On Balance Volume may provide resistance before that price point is reached though. It is coming up to almost touch the yellow trend line that previously provided support. However, there is some leeway in exactly how this line may be drawn, so it is not possible to tell with accuracy exactly where resistance is. It may be here or it may be just a little higher.
RSI shows increasing strength to upwards movement.
ADX does not yet indicate a trend change (this is a lagging indicator). The black ADX line is declining, indicating only a consolidation. The -DX line remains above the +DX line. No trend change is yet indicated at this time frame.
DAILY CHART
Click chart to enlarge. Chart courtesy of StockCharts.com.
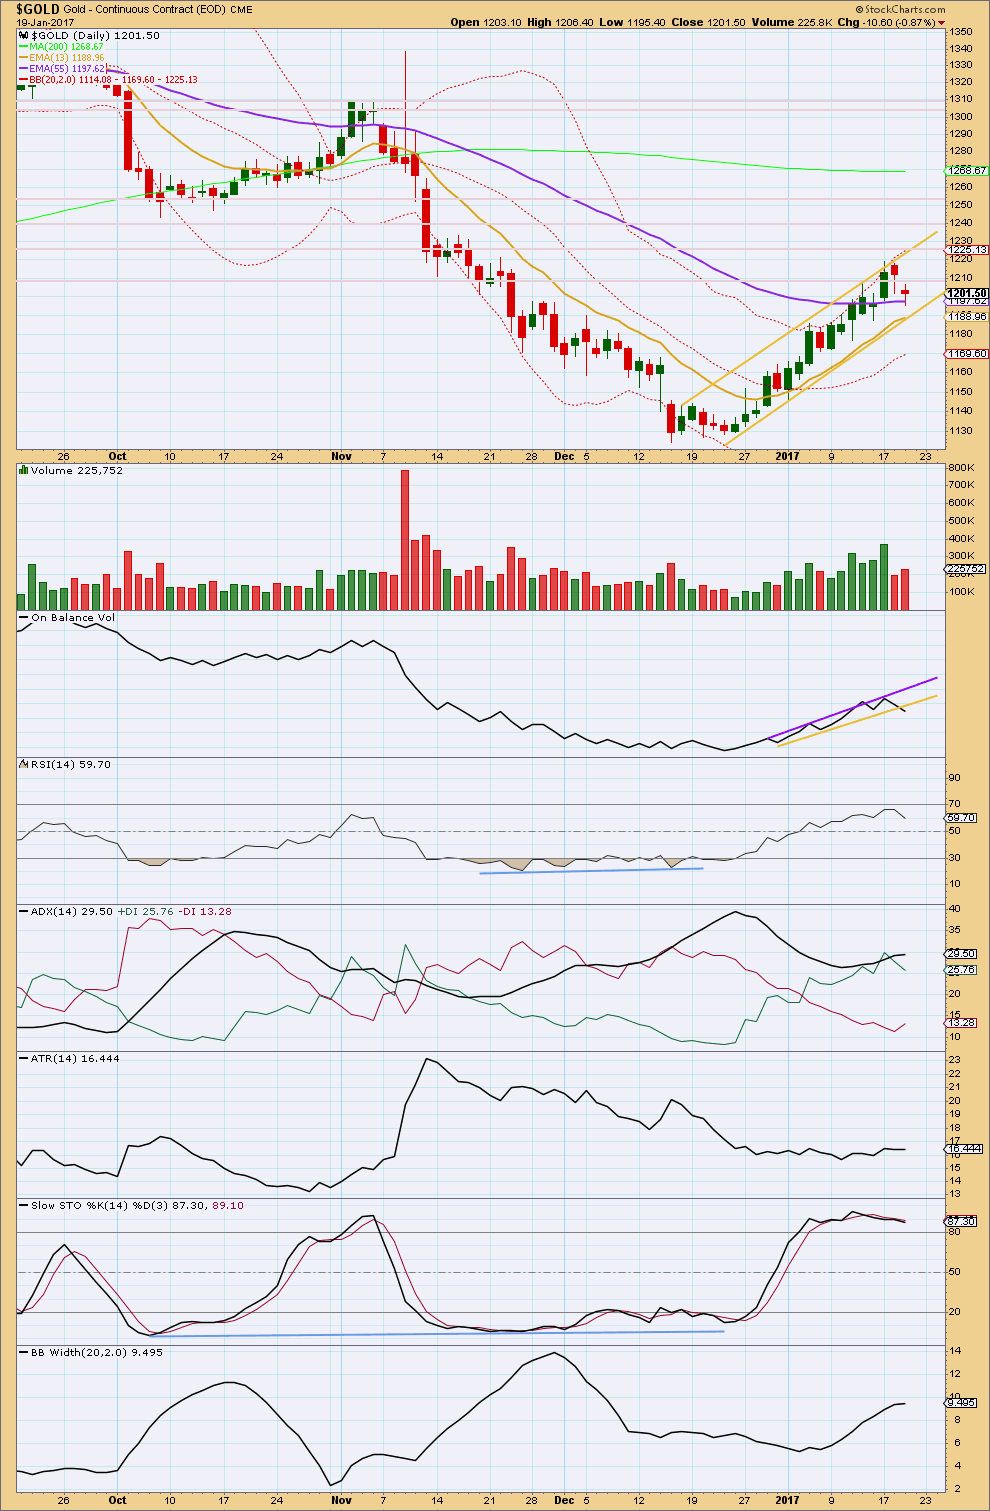
Price continues to move higher finding resistance at the upper gold trend line. Next resistance may be about 1,225, then 1,240, then 1,250. Thereafter, there is very strong resistance about 1,305 to 1,310.
The hanging man candlestick pattern for yesterday’s session is now followed by a small body red candlestick. This offers some bearish confirmation of the hanging man reversal pattern. This suggests a high may now be in place for Gold, and this supports the alternate Elliott wave count.
However, the bottom line remains that there is no confirmation of a trend change from up to down while price remains within the gold channel.
Today’s red daily candlestick comes with some increase in volume. The fall in price is supported today by volume. This is bearish and also offers some support to the alternate hourly Elliott wave count.
On Balance Volume today has broken below the yellow support line. This is a bearish signal that also offers support to the alternate hourly Elliott wave count. However, this line is reasonably steep and only tested three times before, so it does not offer good technical significance. This bearish signal is weak.
RSI is not yet overbought. There is room for price to rise further.
ADX is increasing, indicating the market is trending; the trend is up. The trend is now extreme as the black ADX line crossed the +DX line and is now above both directional lines. There is still room for the trend to continue higher though as ADX is below 35.
ATR is overall flat while this trend continues. This is normal for the first wave within Gold’s trends, and also for a counter trend movement. It is impossible still to tell which situation is occurring here.
Stochastics is overbought and exhibits divergence with price. However, this oscillator may remain extreme for reasonable periods of time during a trending market and may exhibit sustained and multiple divergence before price turns. I would not expect this trend to end here because Stochastics is overbought.
Bollinger Bands are widening as volatility returns during this trend. This looks normal. Bollinger Bands are not yet extreme. There is room for the trend to increase volatility further.
GDX DAILY CHART
Click chart to enlarge. Chart courtesy of StockCharts.com.
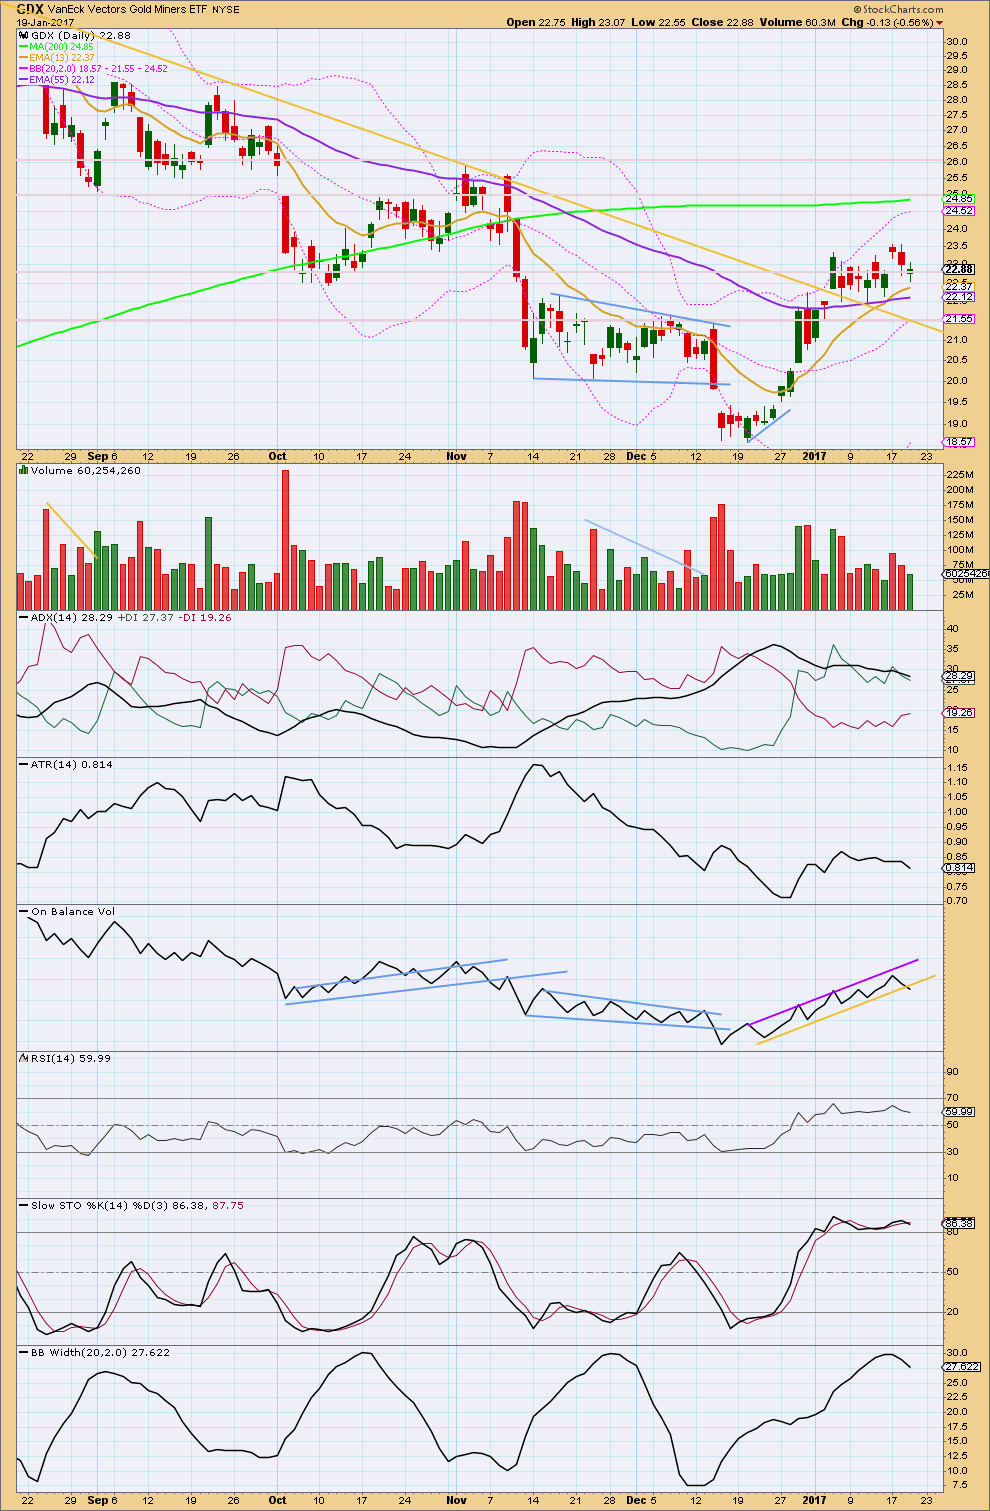
GDX has moved lower today but closed with a green small range candlestick. The balance of volume was downwards during the session and this showed a decline. The fall in price is not supported by volume today, so it is suspicious. This looks more likely to be part of a small consolidation within a continuing upwards trend than it does to be a new trend.
GDX has been essentially moving sideways for the last nine sessions, with a slight upwards bias. It is two downwards days during this period that have strongest volume suggesting a downwards breakout may be more likely than an upwards breakout. This technique does not always work for GDX; it is only one piece of information to weigh up in conjunction with others.
ADX is declining, indicating that GDX is not currently trending. ATR agrees as it is flat to declining.
On Balance Volume today offers a reasonable bearish signal with a breach of the yellow support line. This line is reasonably steep, somewhat long held, and tested four times, so it offers reasonable technical significance, But this signal is neither strong nor weak, just reasonable.
RSI did not reach overbought, so there is room for upwards movement to continue.
Stochastics did reach overbought and there exhibited divergence with price. This could continue to develop into multiple divergence before price turns, or price may have already turned.
Bollinger Bands are extreme and now beginning to contract. This supports the idea that GDX may have a high in place at this time.
On balance, this analysis for GDX is more bearish than bullish. My bottom line for GDX at this time would be to allow for the possibility that the upwards trend is intact while price remains above the last swing low at 21.90. If GDX makes a new low below 21.90, then look out for a deep correction for GDX.
This analysis is published @ 08:13 p.m. EST.
Some ideas:
Lara,
Seems like we finished Minor A at yesterdays low at 10 AM and a Minor B at todays high at 2:40 PM and now in Minor C down towards 1175 and lower of Intermediate (2).
Your thoughts? Thanks
The subdivisions fit, but the waves are far too brief. It looks just wrong.
Lara.
Could ssandysc’s proposed count be used as Minute 1 and Minute 2 of the alternate hourly instead?
(1218.43 – 1195.82 – 1214.24).
It has some merit.
Alan,
That is correct, I meant that. I have 1045 low as P[A] low and July 10th high as an Intermediate Wave (A), Dec 14th low as Intermediate Wave (B) low and after Minor 1 of Intermediate (C) of P[B] finished on Jan 16th recent high. After in Minute[i] and [ii] done at 1215.05 and now in Minute[iii] down, may go down to 1.618 of Minute[I], after [iv] and [iv] of Minor 2 of Intermediate (c) up of Primary Wave [B] up.
Interesting, commercials have been going long even during this move up, suggesting more upside.
We broke thru 1210.64 – briefly, but it should invalidate the bear count. I’m in long gold futures.
Unless a new high is made, the bear count can be reworked .
Theoretically, yes. But so far I have not been able to find a solution.
Not necessary. It only shows that Lara’s count, in its present form, is inadequate. But then, all of us have to work with a mathematical model given the known facts at the time. New information may reinforce or invalidate that. ssandysc’s proposal is one such alternative. It was also my thinking when price shot up to 1214.24. In the bigger picture, I am of the opinion that so long as price remains constrained within the long-term bearish, the market still remains bearish. At best, any price rise is but a bullish contrarian.
Getting closer to a channel breach?
Lara/Alan,
Thanks for posting extended hourly wave count from starting wave (0). To me this gold run and wave count felt similar to the historic wave count from gold’s bottom at 253 and the top in 2011 at lower degree. Where in the past wave was short , wave 3 was long and wave 5 was extended.
I went back and looked at the historic wave counts from 1999 to the top 2011.
From 1999 to 2011:
I @ 326 Wave I = 73
II @ 256
III @ 1033 Wave = 777
IV @ 681
V @ 1923 Wave 5= 1242
In this case wave 5 was extended by 1.60 to wave 3 and from wave 1 by almost 17.
At much lower degree the current wave will be extended also.
In looks this hourly count to me looked the same. Very long wave 3 compared to wave 1.
It will be nice you post long chart of hourly time to time. It gives us the total picture of the current wave counts.
Thanks.
Lara. I’m so glad you ignored that spike between minuette ii and minuette iii in yesterday’s data. BarChart is notorious in putting up data that are non-existent with other data feeds. I find that by ignoring these “anomalies”, I find my wave counts are much more accurate.
There is another weird drop on the hourly chart (to 1204.28, followed by a spike) today at 6 pm ET, Thursday 19, which I am going to ignore for my ongoing count.
They often disappear.
I have a theory about this tendency with BarChart data. It appears to spike in the direction that price will go.
If they don’t disappear then I can’t ignore it. I haven’t actually ignored this one, I’ve checked on the 5 minute chart and if subminuette i was short, the very first small wave down, then the spike is subminuette iv.
I haven’t put the labels on the hourly chart because subminuette i and ii are within the first hourly candlestick.
Lara: Why do u think minor 5 needs to be = minor 3 or 4.28 times 1?
Why not lower fib of 3 or = wave 1?
In 1 hour period gold chart shows a bullish candlesticks pattern. Several small red bodies sandwiched between two large green bodies.
Same bullish pattern in silver chart.
Because minor 1 was very short at only 9.07.
If minor 5 was only equal in length with minor 1 it would be substantially truncated. Even if it was 1.618 X minor 1 it would be truncated.
If it was 2.618 X minor 1 it would not be truncated, but it would be short.
I’m expecting the most common tendency for Gold to exhibit an extended fifth wave. It doesn’t have to do this, but it does it more often than not.
Thanks Lara/Alan. Learning every day.
Love it.
Papudi. If you look at price from a top-down approach, the C wave of Cycle A (in this case Primary Y) is usually 1.0, or sometimes 1.382 of A, for the simple reason that C waves are the counterpart of 3rd waves in a 5-wave sequence; anything less connotes some form of “truncation”. It is possible but it looks ugly. At Y=W, Primary Y sits at 1451.61, or 1452 for brevity.
To obtain 1452, Intermediate 1 at 1234 is about right (although slightly higher is preferred). This gives a respectable proportion to Primary Y. There is no need to resort to considering extended waves in order to achieve the projected target. You may recall some time back I have called for lowering the wave count by one degree, but now that Intermediate 1 is substantially higher than we had thought in the past, there is no necessity for that.
That is the reason why we now had to resort to using “abnormal” ratios like 4.236 to yield the intended result. In the normal course of events, 5=1 is quite often used as the norm. This has to presume an extended 5.