
Downwards movement was expected for Tuesday but did not happen.
Price has moved higher but remains below the invalidation point on the hourly Elliott wave count.
Summary: A new low below 1,202.90 would add confidence that the downwards pullback has resumed. The next wave down may be either wave C or a third wave. Both options should exhibit strength.
New updates to this analysis are in bold.
Last monthly and weekly charts are here. Last historic analysis video is here.
Grand SuperCycle analysis is here.
MAIN ELLIOTT WAVE COUNT
DAILY CHART
Click chart to enlarge.
This main wave count has a better fit for prior movement. To see the difference between this main wave count and the alternate below please refer to last historic analysis linked to above.
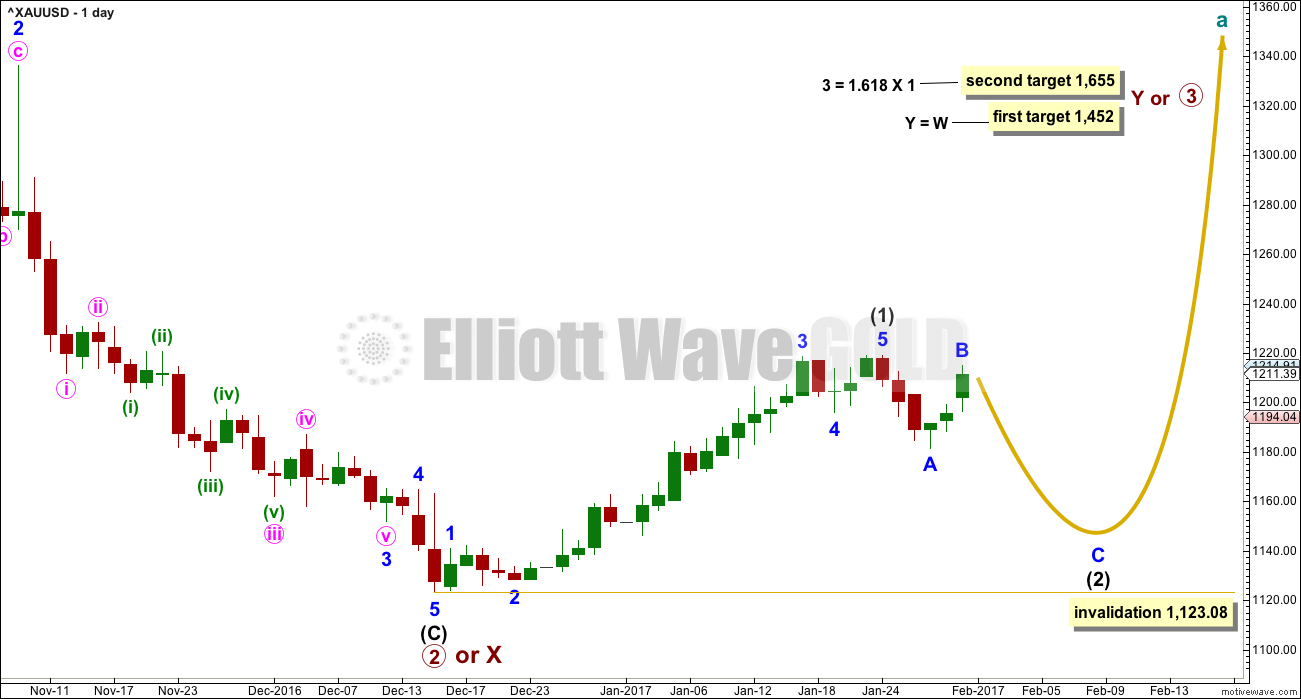
This main wave count expects Gold has had a primary degree trend change in December 2016. The new upwards wave is either a primary degree third wave, or a primary degree zigzag to complete a double zigzag.
At this stage, the degree of labelling within intermediate wave (2) today is tentatively moved up one degree. Minor wave A is complete and now minor wave B may be almost complete. If this is correct, then minor wave C down should be relatively time consuming. Intermediate wave (2) at its end should be somewhat in proportion to intermediate wave (1), which lasted 30 days. Intermediate wave (2) is expected to last a Fibonacci 21 or 34 days.
The first in a series of second wave corrections for Gold’s new impulses is usually very deep. Intermediate wave (2) is expected to be at least 0.618 the depth of intermediate wave (1), and very likely may be deeper. It may not move beyond the start of intermediate wave (1) below 1,123.08.
Minor wave A downwards may fit as either a five wave impulse or a three wave zigzag. Both possibilities should be considered, so both are now charted below.
HOURLY CHART
Click chart to enlarge.
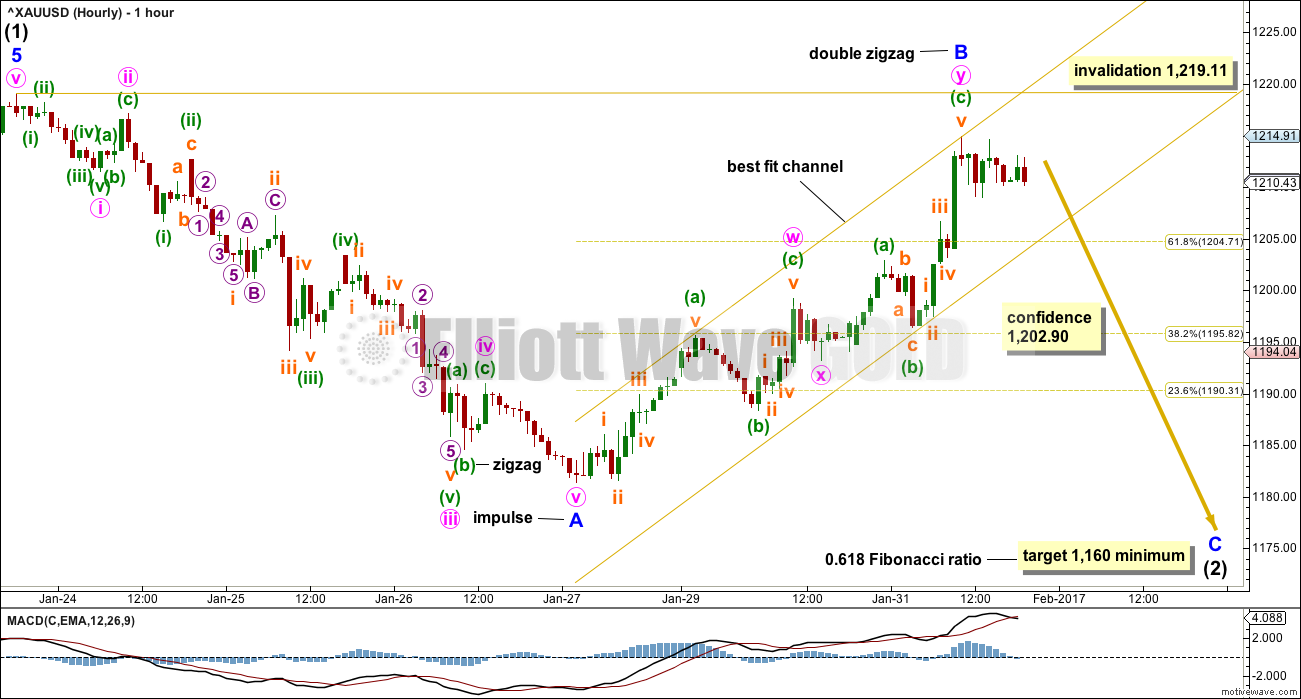
A movement at intermediate degree should begin with a five down at the hourly chart level. This may now be complete. This is still the main wave count today because intermediate wave (2) would most likely begin with a five and not a three.
Minor wave A is seen here as a five wave impulse.
Fibonacci ratios within minor wave A are: minute wave iii is 0.73 short of 4.236 the length of minute wave i, and minute wave v exhibits no Fibonacci ratio to either of minute waves i or iii.
Minute wave ii is a zigzag and minute wave iv is an expanded flat. There is alternation in structure.
Fibonacci ratios within minute wave iii are: minuette wave (iii) is just 0.48 longer than 1.618 the length of minuette wave (i), and minuette wave (v) is just 0.21 longer than equality with minuette wave (iii).
Subminuette wave iii within minuette wave (iii) within minute wave iii ended with a very strong downwards movement. This was followed by a truncation for subminuette wave v. This is acceptable.
Minor wave B may be a complete double zigzag.
Within the both zigzags of minute waves w and y, there are no adequate Fibonacci ratios between minuette waves (a) and (c).
A new low below 1,202.90 would add confidence that the upwards wave of minor wave B is over and minor wave C downwards then should have begun.
The key difference within downwards movement between this main hourly chart and the alternate below is the structure of minuette wave (b) within the expanded flat of minute wave iv. This main hourly wave count sees this small wave down, which lasted only an hour, as a zigzag. On the five minute chart, this small wave looks very strongly like a zigzag. This increases the probability of this main wave count over the alternate.
The upwards movement labelled minor wave B may be a complete double zigzag. It may also be an incomplete single zigzag as labelled on the alternate hourly chart below. If a new high is seen, then that is how minor wave B would be labelled.
If minor wave A has subdivided as a five, then minor wave B may not move beyond its start above 1,219.11.
ALTERNATE HOURLY CHART
Click chart to enlarge.
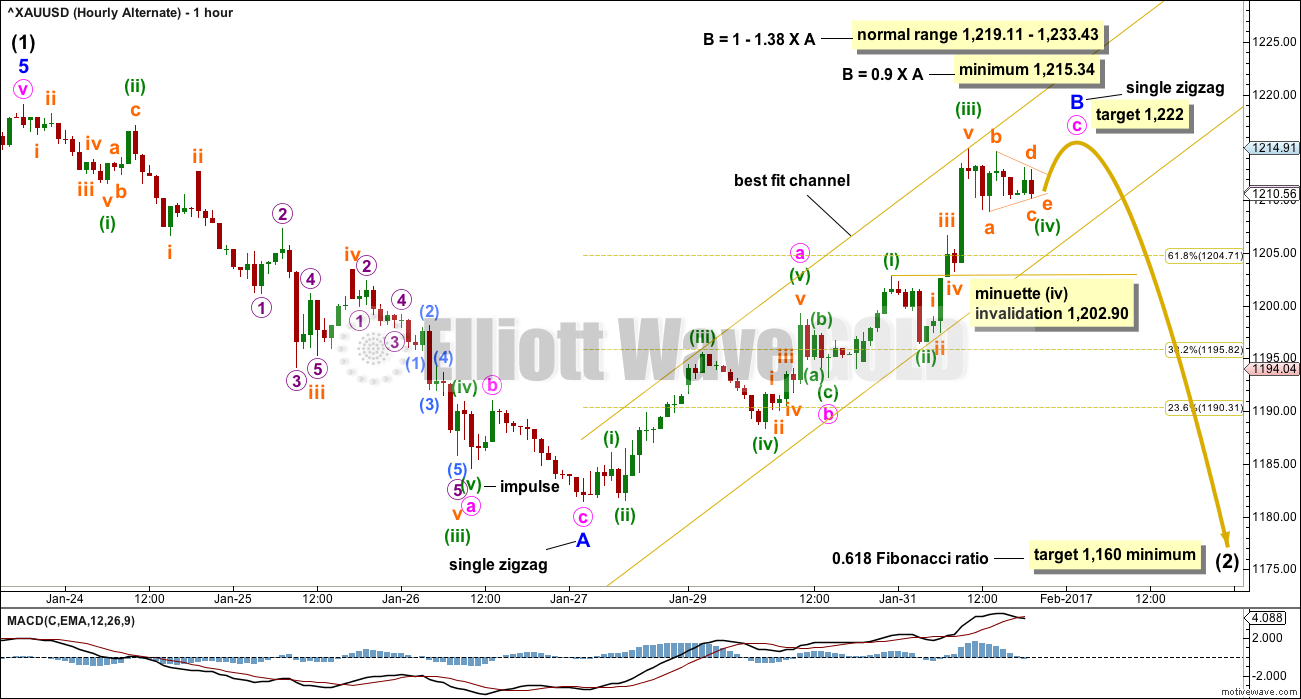
What if minor wave A was a three?
Minor wave A will fit as a single zigzag. There is no Fibonacci ratio between minute waves a and c.
Fibonacci ratios within minute wave a are: minuette wave (iii) is 0.73 short of 4.236 the length of minuette wave (i), and there is no Fibonacci ratio between minuette wave (v) and either of minuette waves (i) or (iii).
Fibonacci ratios within minuette wave (iii) are: subminuette wave iii is 0.48 longer than 1.618 the length of subminuette wave i, and subminuette wave v is just 0.21 longer than equality in length with subminuette wave iii. This piece of movement is seen as a complete impulse in the same way for both wave counts.
This alternate has to see the downwards movement of minuette wave (v) within minute wave a as a five wave impulse. On the five minute chart, this small piece of movement looks very strongly like a zigzag. That reduces the probability of this alternate today.
If minor wave A has subdivided as a three wave structure, then the correction one degree higher of intermediate wave (2) is indicated as either a double zigzag, flat correction, or double combination.
Within a flat correction, minor wave B must retrace a minimum 0.9 length of minor wave A.
The normal range for minor wave B within a flat correction is from 1 to 1.38 the length of minor wave A. Minor wave B may make a new price extreme beyond the start of minor wave A as in an expanded flat.
This movement may also be relabelled minor waves W – X – Y for a double zigzag or double combination.
ALTERNATE ELLIOTT WAVE COUNT
DAILY CHART

Click chart to enlarge.
This alternate wave count expects that Gold is still within a bear market. Targets for new lows can be seen on weekly and monthly charts.
Within the bear market, a primary degree correction is underway.
Primary wave 2 is most likely to subdivide as a zigzag. Intermediate wave (A) is complete and a correction for intermediate wave (B) has begun.
Intermediate wave (B) may not move beyond the start of intermediate wave (A) below 1,123.08.
Primary wave 2 may not move beyond the start of primary wave 1 above 1,374.81.
TECHNICAL ANALYSIS
WEEKLY CHART
Click chart to enlarge. Chart courtesy of StockCharts.com.
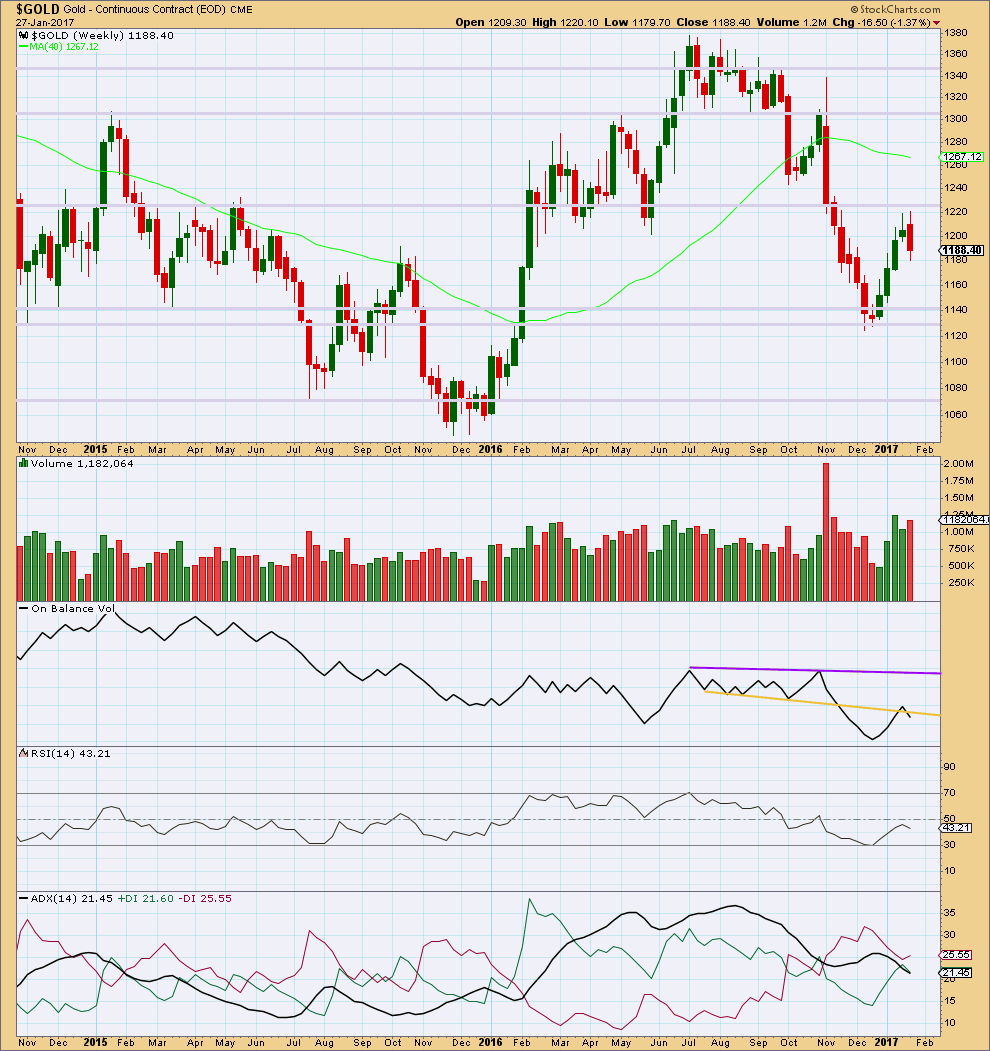
Last week completes a bearish engulfing candlestick pattern. This is the most reliable reversal pattern. It is supported by an increase in volume from the prior week. Price has found strong resistance about 1,220.
On Balance Volume gives a weak bearish signal last week with a break below the yellow line. The signal is weak because the line has been broken before.
At the weekly chart level, ADX indicates no clear trend.
DAILY CHART
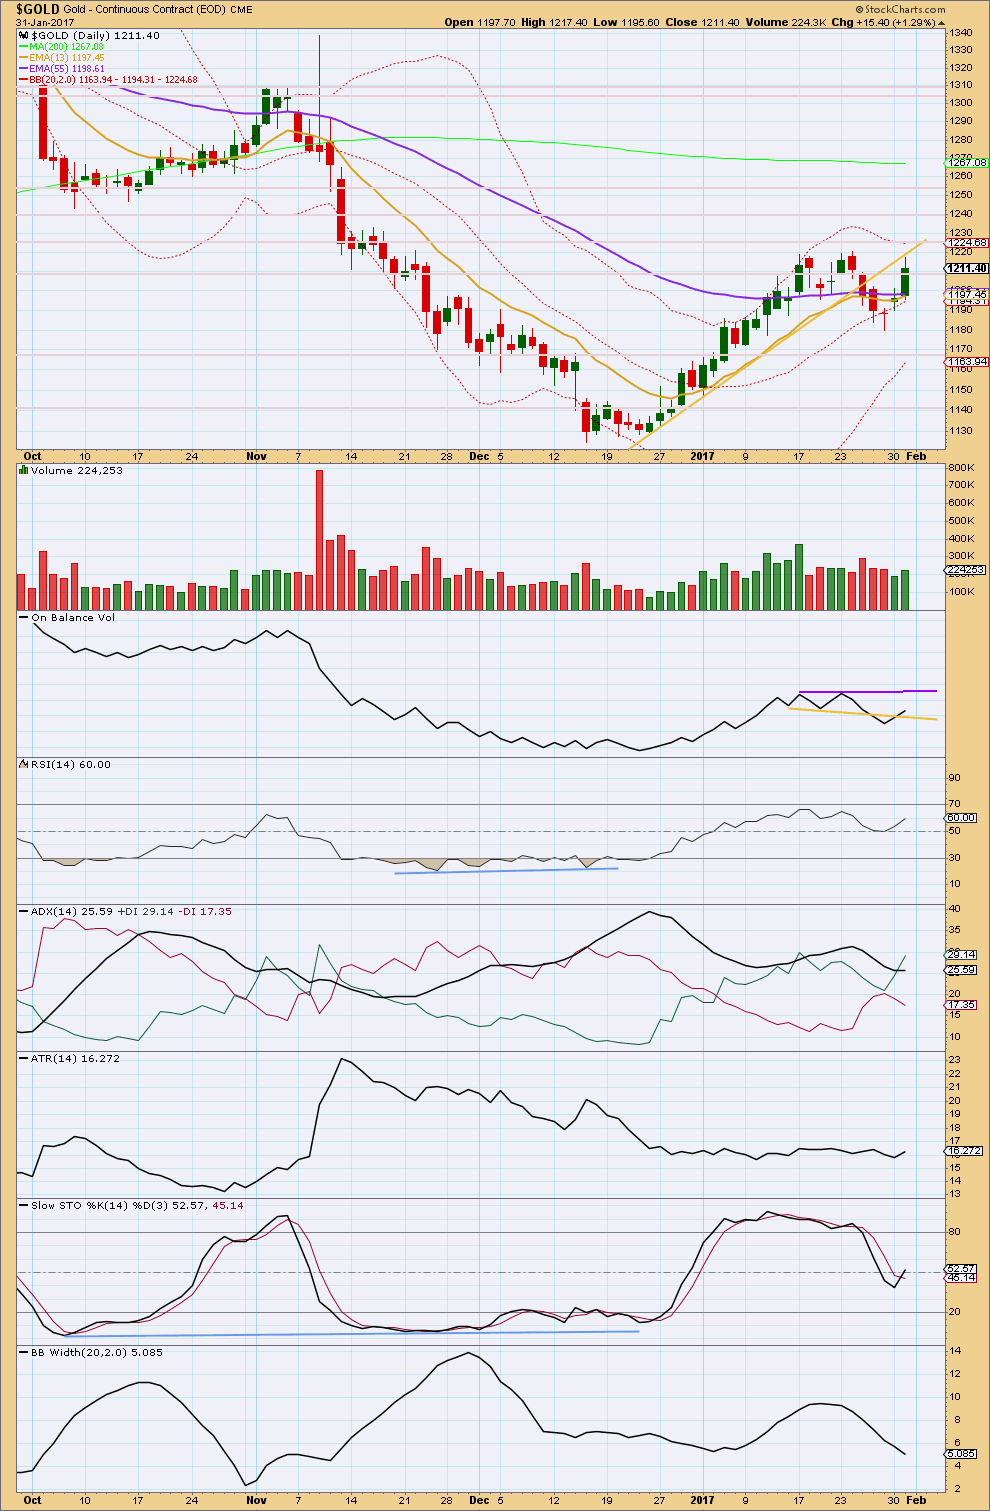
Click chart to enlarge. Chart courtesy of StockCharts.com.
An upwards day shows some increase in volume, but overall volume for the last two upwards days are both lighter than the prior three downwards days. Overall, there is some support today for the rise in price, so look out for a little more upwards movement before it is done. But lighter volume for these upwards days compared to prior downwards days indicates more support for the fall in price, so the upwards days look like a small counter trend reaction. This supports the Elliott wave counts, but cannot tell if the main or alternate hourly wave count is correct.
On Balance Volume has broken back above the yellow trend line negating the weak bearish signal of a few days ago. This line is short held and only tested twice and has little technical significance.
The purple line on OBV may provide some resistance.
RSI is not extreme and exhibits no short term divergence with price to indicate any weakness.
ADX today shows a slight increase. It now indicates an upwards trend may be in place. The trend is not extreme.
ATR overall remains flat.
Stochastics is returning from overbought but has not yet reached oversold. With Stochastics not extreme, there is again plenty of room for price to rise.
Since the last high in price Bollinger Bands have been contracting. This suggests that prior upwards movement was a trend and now downwards movement is a pullback. The two upwards days of today and yesterday have not come with an expansion of Bollinger Bands; these may be a small correction within the pullback.
Price may find some resistance here at the yellow trend line. The two upwards days may be a throwback to test the line after it was breached.
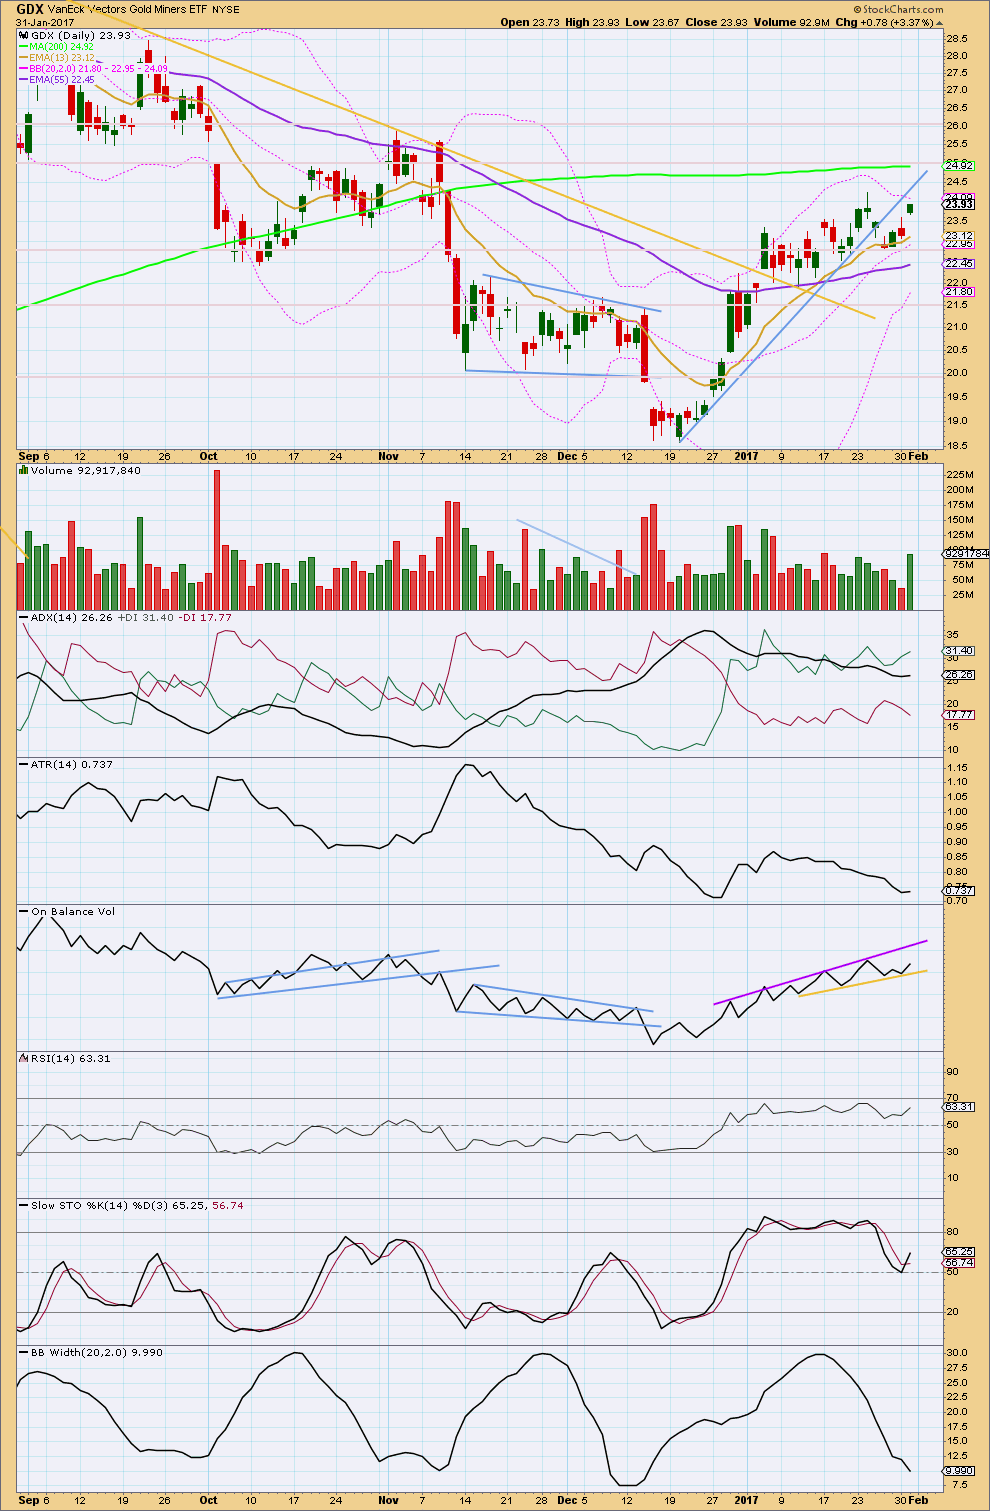
GDX DAILY CHART
Click chart to enlarge. Chart courtesy of StockCharts.com.
A small range upwards day comes with a strong increase in volume. This does not necessarily mean that price must keep rising though. This has happened before three times on this chart (21st September, 2016, 29th December, 2016, and 5th January, 2017) and has been followed by a reversal shortly after. The next session may be expected to move price higher, but it may end after one more session.
This upwards day has not broken above prior resistance at 24.25, but it is very close. One more upwards day with reasonable volume may be an upwards breakout.
ADX is increasing, indicating an upwards trend is in place. The trend is not extreme. There is plenty of room for it to continue.
ATR is still declining, indicating the market is consolidating. Price is still range bound. Some suspicion on the trend indicated by ADX is reasonable.
On Balance Volume remains constrained. It has given no indication yet of the next possible direction.
RSI is not extreme and exhibits no divergence with price today to indicate any weakness.
Stochastics is still returning from overbought. Bollinger Bands are still contracting.
Overall, it still looks like GDX is consolidating and that the breakout may most likely be downwards.
This analysis is published @ 08:58 p.m. EST.
Is there any possibility we completed wave 2 down at 1180 and are starting wave 3 up? We had a fib correction of .382 down to 1180 from wave one up. Maybe we aren’t going to get a .618 wave 2 correction.
Dreamer
May I request 1 hour period chart from No 82016 to YTD for silver.
A big base is built for silver and gold to rise. Silver broke out of several HnS patterns o top of each other. Similar to to wave counts of lower to higher degree wave counts (waves within waves).
Silver back tested yesterday breakout at 227.30 and now trading at 17.70.
Thanks
It is not too often that you see money lying around in a corner as one famous investor opined. SLV clearly bucking the trend with another visit above its upper BB while Gold’s downtrend has been confirmed. Picking up the Feb 17 16.50 strike puts for the ridiculous price of 0.23 per contract. This could be a five bagger…. 🙂
Hi Verne,
I saw the same price action you saw in Silver. I am not adept enough in options to be nimble as you are to quickly choose a strategy, know which option/s to choose and quickly decide to put on a trade and manage it correctly.
I admire what looks like a skill that took you a fair amount of time to learn.
You had mentioned John Carter’s courses to me. BUT , I am interested in which mentors/courses/books you may have used to gain a sound understanding in the basics. Do you mind sharing?
I am also curious to know if you use spreads and how nimble you consider yourself in understanding how to replace/take away legs, roll out etc. I notice that most of the time you mention trading a call Or a put. I’ve not noticed your mentioning spread trading.
I would love to find a reliable, complete and practically applicable source to become educated in individual options and spreads with out ‘breaking the bank’ as they say. I don’t want to rely on these ‘black box’ services. I want to be able to figure it out for myself.
I’d appreciate your ideas….Thank you.
I learned the most about options from Ken Trester, who is an expert in spread trading, and Bryan Bottarelli of Bottarelli Research . Ken has written a few books and so has John Carter who I previously mentioned, but in my honest opinion, the very best way to get some skill in this particular area is to watch, and if possible trade along with someone who is good at it. Of course you also learn a lot from your mistakes! The strategies and tactics you learn from trading with very experienced traders are generally not going to be found in in too many courses as these guys keep their methods very closely guarded. I subscribed to both Ken and Bryan’s trading services for quite some time and the things I learned from them I have never seen written in any course or manual.
You are right about spreads and they are the most common trades I make even though I rarely mention them as they are so boring. They happen to be the safest trades one can make for steady income with strictly limited risk.
I certainly don’t mind sharing some of the ones I enter if you think that would be helpful. Spreads are better with low volatility, slow movers that are fairly predictable and remain in trends over a long period. One that I like is TLT which I think is about to move up in a C wave of an ABC correction and a good candidate for bullish put credit spreads- will post when I open.
Hi Verne,
In other words…you may be saying that I am not going to learn what I really need to know in ‘Think or Swim’ courses?
Thanks for sharing a few good names which I will check out. Spreads may seem boring, but I have met a few men in courses (not option courses) that suggest they are making their main living off those boring spreads and what they are looking for is exactly what you said…low volatility to make them work…at least certain spread strategies…as I understand it. They may ‘cap’ what they can make, but if you know how to construct and manage each spread based on the underlying….one can do well….simply put, boring and lower risk is a good thing.
Yes…I believe TLT is retracing in an a-b-c from its recent decline. I’d like very much to understand how you put this spread on and how you manage it.
Have a good night.
The confidence point is breached. The best fit channel is breached. It does look like the pullback has resumed it’s short / mid term downwards trend.
I’m short already. Will move my stop to breakeven and see if this one sticks.
I had high confidence in your original count and hedged my JDST position with short calls. We sometimes forget the wave forms are reflecting human behaviour and I had every expectation that ahead of a strong move down the banksters would try to bamboozle short side traders with a more complex second wave and that is exactly what they did. I think the next critical pivot is 1160.00 so here we go…
Waiting for this thing to consistently trend downwards is like watching paint dry…haha. Thanks FOMC…:) Technicals still intact w/ the channel beach, so personally not worried on this recent uptick, as it’s still below the channel…but I’m all ears if you guys are seeing something else.
Thanks, Lara, for the update.
Gdx is higher today with gold at 1211 then it was when gold was at 1215 or so a few days ago. Sometimes gold stocks lead up.
Go off the grid for a hours, the FED opens their mouths and everything flips over.
LOL
That’s exactly what I did. Went surfing 🙂
Hello Lara or anyone who cares to reply.
On my Gold chart, it would appear the 1202.90 was breached and therefore the Alternate count invalidated?! I’ve seen Gold as low as 1199.00 in the past few minutes.
The second Fibo level is at 1195. Maybe enough for today?
We will see!
Yes. I have the low so far for this session at 1,198.48.
This can’t be a fourth wave correction on the alternate because it would be now back in first wave price territory.
Personally I am expecting new lows following FOMC statement in just over an hour – this is likely to be hawkish, especially after strong NFP earlier today. This might fit well with our expectations of an impulsive minute iii wave.
FOMC?
SAFSN….Sound and fury etc. etc. 🙂
Oh well, that would have been too easy 😑