
A breach of the trend channel and a new low below 1,227.82 has invalidated the main wave count and confirmed an alternate.
Summary: Probability has shifted back to a deep pullback beginning here. The target is at 1,149.
Follow my two Golden Rules of risk management:
1. Always use a stop.
2. Invest no more than 1-5% of equity on any one trade.
New updates to this analysis are in bold.
Last monthly and weekly charts are here. Last historic analysis video is here.
Grand SuperCycle analysis is here.
MAIN ELLIOTT WAVE COUNT
DAILY CHART
Click chart to enlarge.
This main wave count has a better fit for prior movement. To see the difference between this main wave count and the alternate below please refer to last historic analysis linked to above.
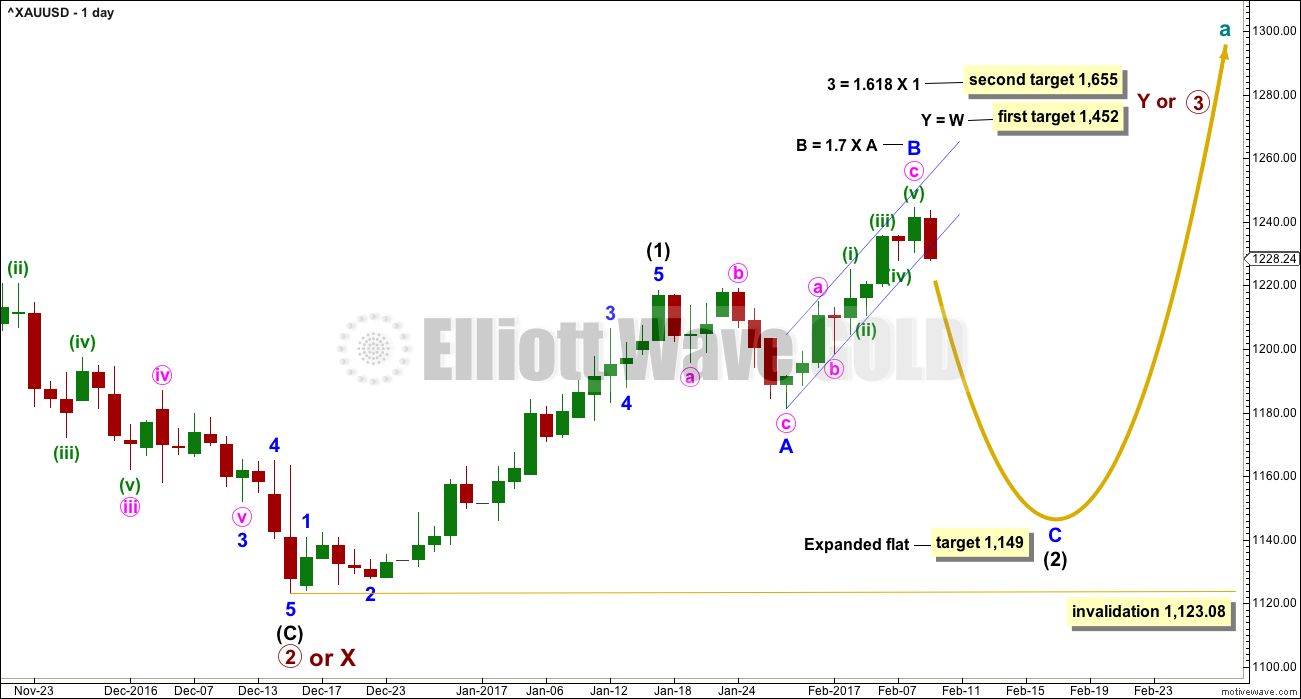
This main wave count expects Gold has had a primary degree trend change in December 2016. The new upwards wave is either a primary degree third wave, or a primary degree zigzag to complete a double zigzag.
Intermediate wave (2) is now reasonably likely to be continuing further as a deep expanded flat correction. These are very common structures. Within them the B wave is most commonly from 1 to 1.38 times the length of the A wave, but in this instance minor wave B is longer than normal at 1.68 times the length of minor wave A. This is entirely acceptable although it is less common.
When B waves of expanded flats are very long, then the appropriate Fibonacci ratio to use to calculate a target for wave C is 2.618 the length of wave A.
So far intermediate wave (2) has lasted twelve days. If minor wave C lasts nine days, then intermediate wave (2) may total a Fibonacci 21 days. If minor wave C lasts 22 days, then intermediate wave (2) may total a Fibonacci 34 days.
HOURLY CHART
Click chart to enlarge.
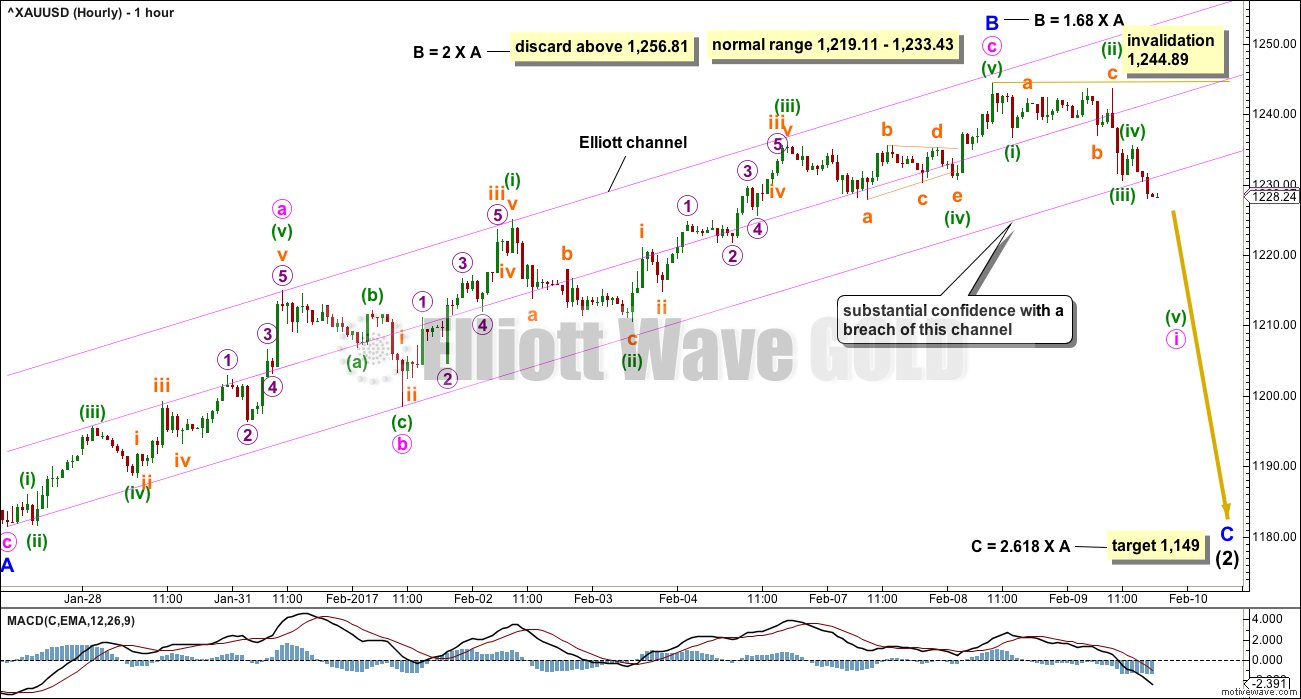
If upwards movement labelled minor wave B is seen as a single zigzag, then it has a good fit. There is no Fibonacci ratio between minute waves a and c.
Fibonacci ratios within minute wave c are: minuette wave (iii) is 1.58 short of equality in length with minuette wave (i), and minuette wave (v) has no Fibonacci ratio to either of minuette waves (i) or (iii).
There is now at least one if not two full hourly candlesticks below the lower edge of the trend channel and not touching it. This provides a clear breach and confidence in this wave count.
When the first five down for minute wave i is complete, then the following correction upwards for minute wave ii may not move beyond the start of minute wave i above 1,244.89. Minute wave ii may find resistance at the lower edge of the channel for a back test of resistance. If price behaves that way, then it would offer a good entry point to join a downwards trend.
ALTERNATE ELLIOTT WAVE COUNT
DAILY CHART
Click chart to enlarge.
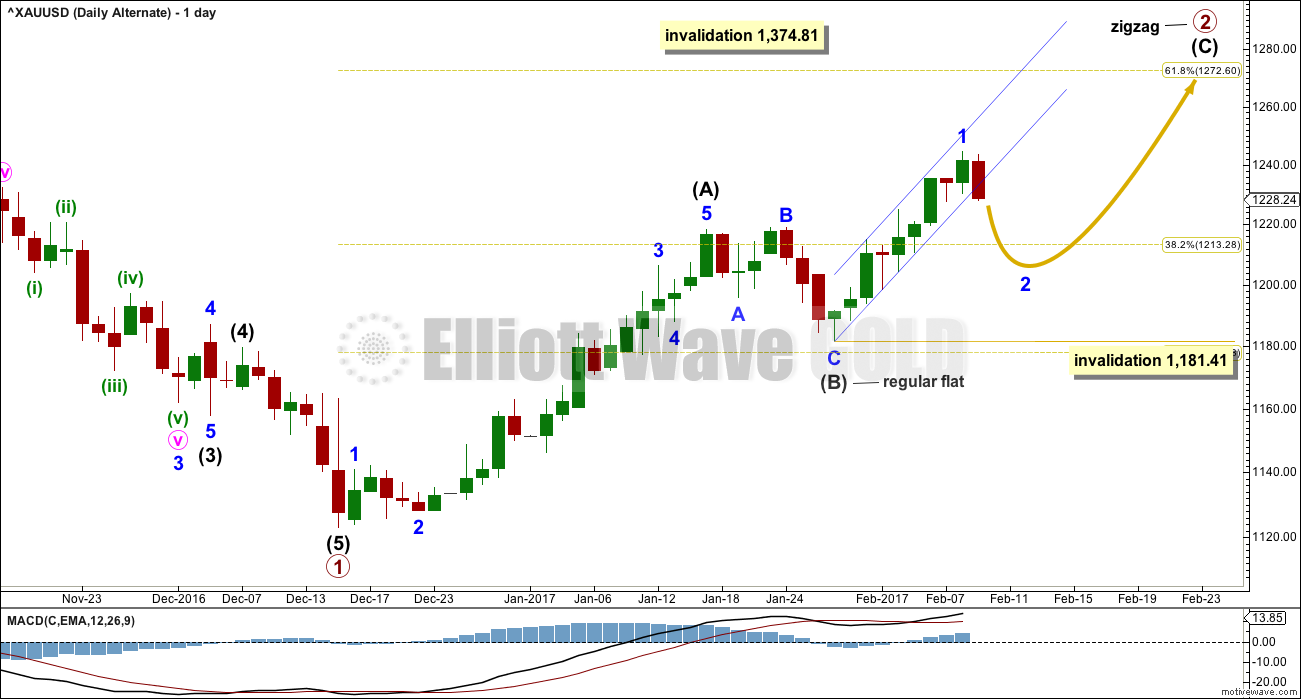
This alternate wave count expects that Gold is still within a bear market. Targets for new lows can be seen on weekly and monthly charts.
Within the bear market, a primary degree correction is underway.
Primary wave 2 is most likely to subdivide as a zigzag. Intermediate wave (A) is complete.
The alternate idea today reverts back to seeing the correction here labelled intermediate wave (B) (and for the main wave count it would be labelled intermediate wave (2) ) as a complete expanded flat.
The next five up, for this alternate labelled intermediate wave (C) (and for the main wave count labelled intermediate wave (3) ), may have begun.
Within the impulse upwards, a first wave labelled minor wave 1 may now be complete. The breach of the channel on the hourly chart strongly suggests this wave is over and the next wave down has begun. Minor wave 2 may not move beyond the start of minor wave 1 below 1,181.41.
Primary wave 2 may not move beyond the start of primary wave 1 above 1,374.81.
HOURLY CHART
Click chart to enlarge.
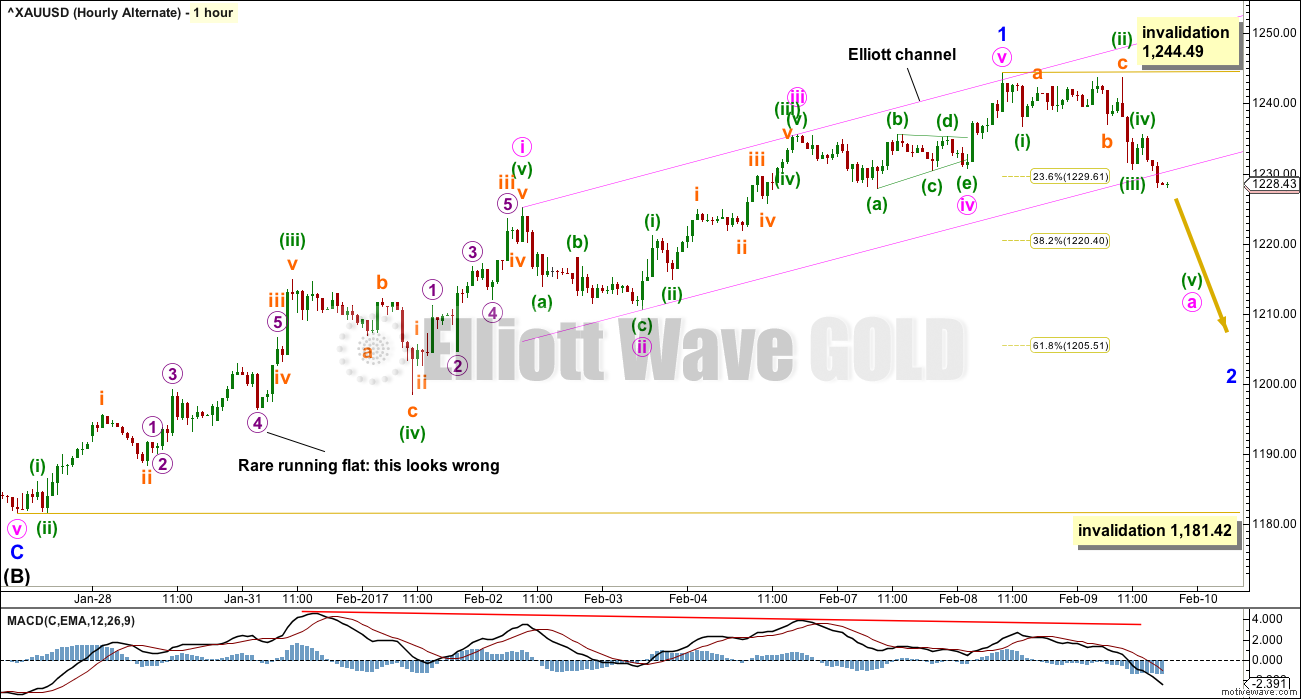
This wave count must see the upwards wave labelled minor wave 1 as a five wave structure. It will not meet the rules for a diagonal, so it may be seen as an impulse.
In trying to see this wave up as a five wave impulse the correction for micro wave 4 (noted on the chart) must be seen as a rare running flat.
Running flats occur right before a movement that is very strong which skews the correction in the direction of the trend one degree higher. In this case, the end of minuette wave (iii) was the strongest part of this upwards wave, using MACD as a guide for momentum. This makes the running flat slightly more acceptable. However, the truncation within micro wave 4 is 3.14 and that is too large to be reasonable. This problem within the wave count substantially reduces its probability.
The most likely point for minor wave 2 to end would be the 0.618 Fibonacci ratio about 1,206.
Fibonacci ratios with minor wave 1 are: minute wave iii is 1.96 less than 0.618 the length of minute wave i, and minute wave v exhibits no Fibonacci ratio to either of minute waves iii or i.
Fibonacci ratios within minute wave i are: minuette wave (iii) is 1.68 longer than 6.854 the length of minuette wave (i), and minuette wave (v) exhibits no Fibonacci ratio to either of minuette waves (i) or (iii).
TECHNICAL ANALYSIS
WEEKLY CHART
Click chart to enlarge. Chart courtesy of StockCharts.com.
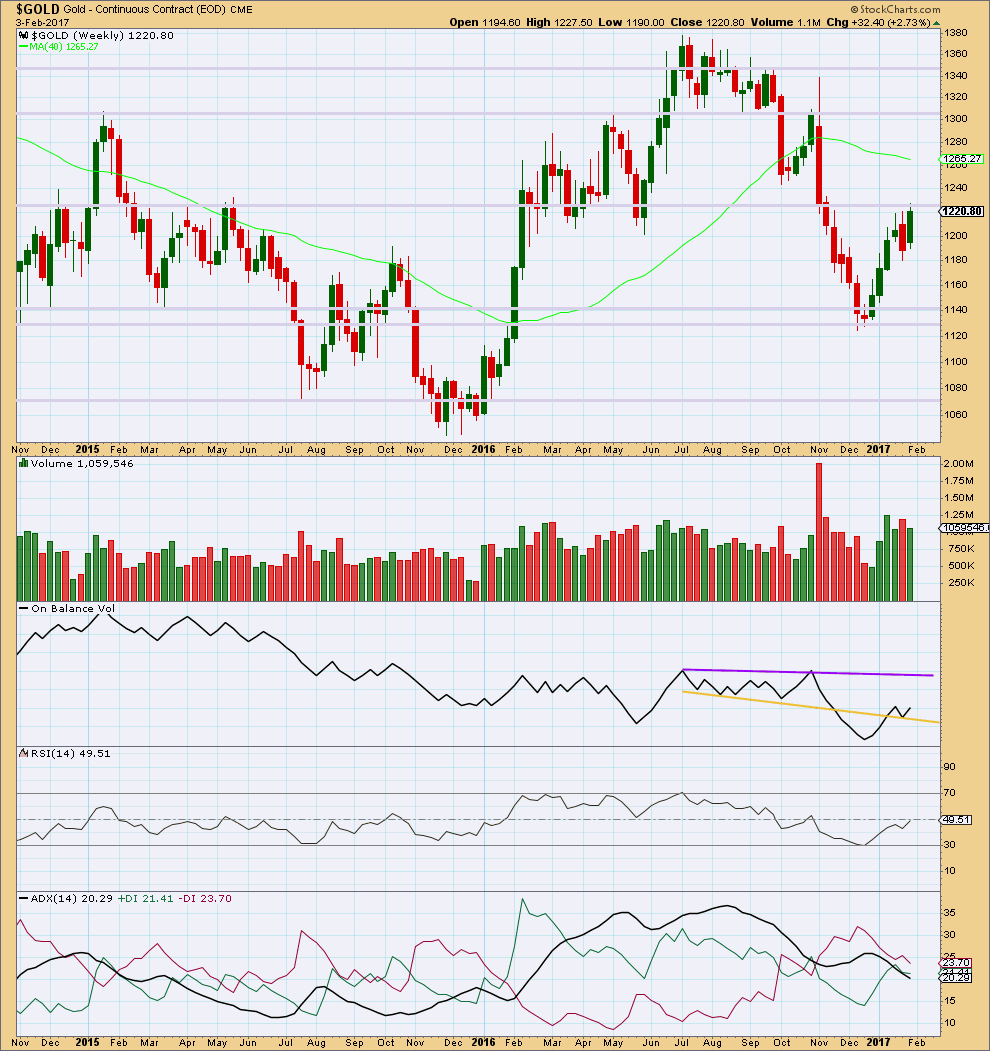
The bearish engulfing candlestick pattern of last week has failed. Price has made a new high.
Since four weeks ago, volume is overall declining. Price is still finding strong resistance about 1,225.
On Balance Volume has bounced up off the yellow support line. Next resistance is some distance away at the purple line. Another breach of the yellow line would be a weak bearish signal.
RSI is not extreme and exhibits no divergence with price. There is plenty of room for this market to continue higher, or lower.
ADX is strongly declining, indicating a consolidation. The -DX line remains above the +DX line, so at this stage a downwards trend would be indicated if ADX turns upwards.
DAILY CHART
Click chart to enlarge. Chart courtesy of StockCharts.com.
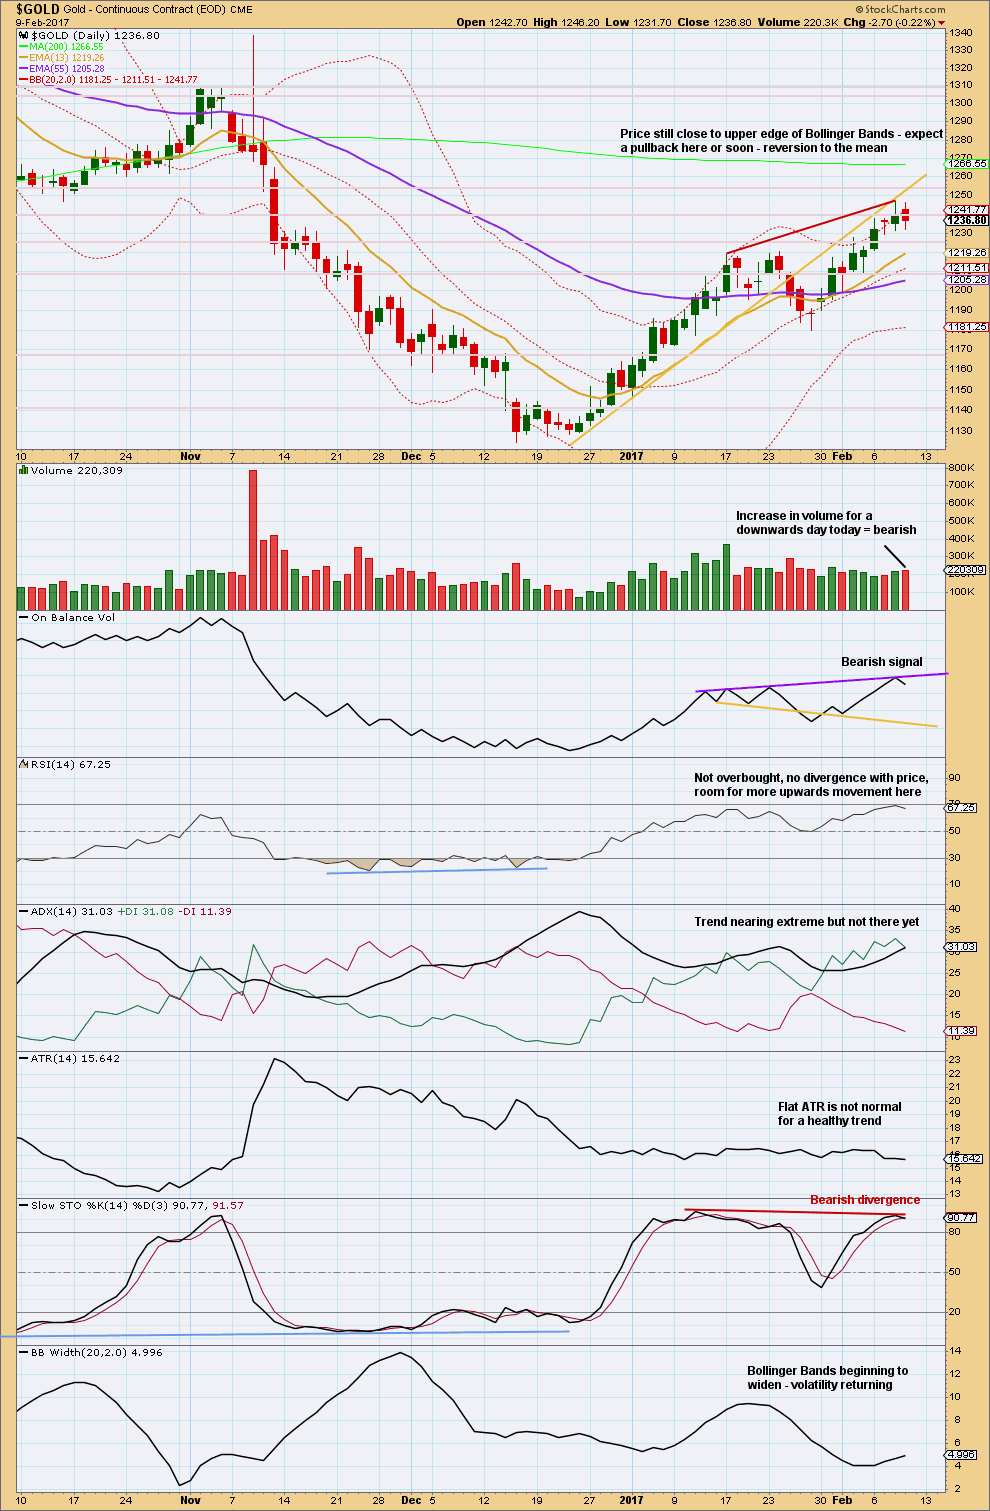
Most commentary will now be on the chart.
Price has continued to find resistance at the yellow trend line.
Bearish: volume, On Balance Volume, ADX (very slightly), ATR and Stochastics, price at upper edge of Bollinger Bands.
Bullish: RSI, Bollinger Bands widening.
There is more bearishness today in this chart than bullishness. This supports both wave counts as both expect a pullback here.
GDX
DAILY CHART
Click chart to enlarge. Chart courtesy of StockCharts.com.
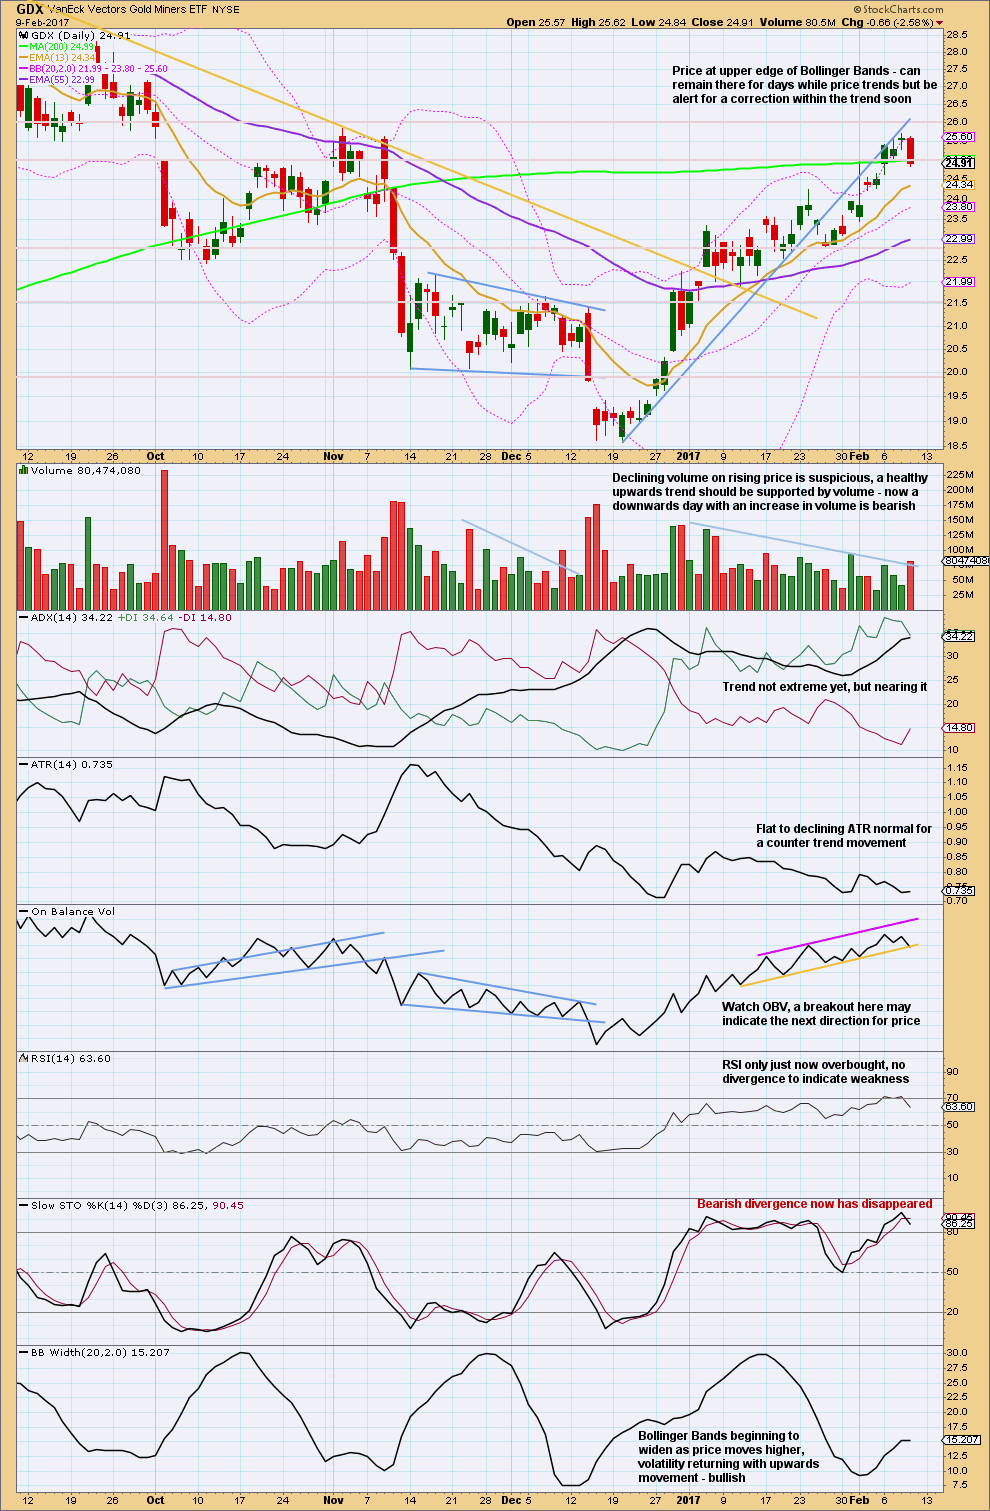
Most commentary is on the chart.
GDX showed strong notes of caution about the upwards trend yesterday. That caution is seen to have been warranted today as a strong downwards day closes with a strong increase in volume.
A pullback looks to have begun for GDX.
Next support is about 22.80.
On Balance Volume may be breaking below the yellow support line. This needs to be clearer before it may be read as a bearish signal. If that happens, then have confidence in a pullback here for GDX.
This analysis is published @ 06:46 p.m. EST.
Just FYI in case anyone’s wondering. Normally I know I’d have your end of week analysis published by now.
We had a function to go to yesterday so it did not get proofed and published before we had to leave.
I will always undertake to have your end of week analysis published by Saturday evening EST so that you will have all of Sunday to read and digest it.
It will be done in a few hours. Thank you for your patience.
Thanks Lara, we appreciate everything that you do for us.
Exited my TLT spread. and sold remaining calls. The market is behaving ststrangely wi th quite a few correlations going haywire so I will SOH on TLT until this resolves. C could be done
Double ZZ for minute two perhaps? Only problem is second has not so far really extended the upwards correction….
Expanded flat.
Cesar’s going to proof and publish shortly I hope.
Anyone…did gold spike up past (i) last hour and if so did that invalidate the current count!? Thanks
The number to watch for all current counts is the recent high at 1244.49
Any retrace that does not exceed that number will not violate either counts and still qualifies as a second wave. (minute degree per Lara’s post today)
How do I miss that so easily. Thanks Verne
🙂
I want to thank everyone for their input. Though not at my desk on the computer, have decided to try a short entry.
I’d appreciate input. When I put a Market Stop in on JNUG/JDST, I notice that I am being taken out well before my Stop is hit (ie: 15-20 decimals). Should I be using a Stop Limit instead, OR, do I risk ‘just being passed by’ and left ‘holding the bag (trade)’ with a Stop Limit.
Continue using a Market Stop and feel lucky I got out when it goes against me??
Suggestions??
These are not instruments I’ve ever traded, so I can’t give accurate advice for you in this instance.
However, I’ve noticed that my broker spread (this is mostly on currencies, my preferred instruments) widens quite a lot during times of high volatility, like news releases.
So I look at the normal spread, multiply that by 3, and set my stop that far away from my trend line or invalidation point, what ever method I’m using to calculate my stop.
Maybe you’re being stopped out by the widening broker spread?
Watch the spreads during a news release to see how they behave. That may help you.
I count five up off the morning lows for JNUG in what looks a lot like a contracting ED complete with wave one penetration by the fourth wave. The problems is I am not sure if this is permissible for a second wave according to EW rules….?
The move up today in the miners looks corrective. I would recommend that you use GDXJ if you are trying to use EW on JNUG. In my opinion the leveraged ETF’s distort the count.
Dreamer…
I agree. I look at these 3X ETFs as derivatives and would only trust the instrument they represent to attempt to count waves, in this case GDXJ for JNUG or JDST.
By the way…your charts are beautiful and truly well thought out.
Thanks Melanie. If I can only get them more accurate….
I would actually not put much weight on any EW count for any individual equity.
Even AAPL. It doesn’t have sufficient volume for decent looking EW counts.
It’s one reason why I don’t often update my GDX count.
For EW to work it needs a market with really big volume. The indices have that, and Gold as a global market has it.
Good idea.
For members here complaining about losses, I did also give you a near perfect entry (so far) for trades on NZDUSD, EURUSD and USD Index earlier this week. All are going in the expected direction.
I am trying to give you guidance now for an entry for Gold, and I did give plenty of warning about the long side for Gold this week.
If you’d rather go it alone I will happily cancel your membership. Email me if that’s what you want.
Hi Lara,
I wasn’t complaining about losses.. I was just making light of the reality we all face when we decide to trade. We win some and hopefully we win more!!
Spending a loss on lunch was just having some fun. If I get too serious, I’ll give up based on emotion.
Cheers
No worries Thomas.
🙂
All good w/ me too, Lara. I’m finding all this very useful…:)
If I may, I want to make a suggestion for those of you who are new to Lara’s analysis regarding what is the most important thing I have learned in the years I have been a member. PAY ATTENTION to her price targets!
If is far too easy to let the short term gyrations of the market distract and discourage you. Unless price action tells you the wave count is incorrect, and frankly that is why she gives clear invalidation points, stay with the counts, and the cited targets. Frankly, for as long as I have been a member, it was only very recently that it dawned on me how often the cited targets were right on the money, and that ignoring them was resulting in a lot of unnecessary exiting and re-entering positions. Hope that helps a bit. It has for me.
Good point Verne
Gold today is behaving pretty much as expected. This green candlestick has a lower high and a lower low, so it’s the definition of downwards movement at the daily chart level today.
Price has just this last hour come up to perfectly touch the lower edge of the channel and so far reacted down from there. This is typical behaviour. If the wave count is right and the channel breach is confirmation of a trend change then this is the perfect entry to go short.
Do not invest more than 1-5% of equity on any one trade, always use a stop.
FWIW this price behaviour with a trend channel (back test) is almost my preferred entry set up. The only thing that could be better here would be if the breakout had been from a sideways consolidation and the “channel” was horizontal. This one has a steep slope. It’s my next preferred set up.
I think what threw folk off was the quick completion of minute one down this morning and quick turn for minute two, but that is exactly what I assumed after it became clear that it could not be a fourth wave correction. Thanks for the confirmation! 🙂
It was very quick, wasn’t it. Now theres a small overshoot back into the channel at the end of the session. That’s okay, sometimes that happens. Price still found good resistance there, and the overshoot has a long upper wick on that candlestick = bearish.
Looks like minute ii is over now.
Turns off corrections against the main trend are happening swiftly. We saw the same thing at the start of the most recent move up off the last low that took us by surprise. Again minute two happened very quickly after a new low this morning.These turns are quite sharp and can obviously cause a lot of confusion about the trend, especially since it seems that Silver and Gold are diverging. Some are even now claiming that the most recent correction for Gold is already done.
Trump is golfing with leader, Abe, from Japan. Trump hates currency manipulation which Japan has been doing with the strong policy of devaluing the Yen, which pushes gold down. Trump is a deal maker and likely will be telling Abe, this can’t happen any longer, so at the 1 pm presser, we could get an announcement the rallies the Yen, which pushes dollar down and gold up. Yen and gold are highly correlated as can be shown on this daily chart of gold with the Yen in purple.
Yep! The two have indeed been historically tightly correlated. The same is true of the Swiss Franc.
By the way, looking at those two proxies suggesting that Gold could be simply correcting its initial move down….
Trump made an interesting statement about being on a level playing field that was a warning. He said china , Japan and the us needed to be on a level playing field. To me this means our currencies will be tied together. I would think that the dollar would have to drop for this to occur, since trump wants a weaker currency. It could even mean currencies tied to gold but I doubt it.
Massive Yen devalue since 2012…I’m with you, Dermot, I believe Trump is going to tell Abe to knock it off. Who do you think will be driving the golf cart tomorrow?
I think Trump is going to get fair trade deals setup for the US. I was watching a Senator yesterday who was illustrating how unfair some of our trade deals are and he compared selling a Harley in Germany to a BMW motorcycle in the US and said, “The Harley is taxed on import to Germany. The BMW gets a German government subsidy when it leaves Germany and no tax upon entering the US. How can Harley compete with this type of unfair trade?”
If JNUG stays below 12, this morning’s pop would have been a three wave correction, FWIW…
Unless we had yet another expanded flat, it would take a rise of JNUG above 13.03 to negate what appears to be a recent change in trend from up to down.
Silver is on a tear! I somehow had Lara’s chart for Silver complely mixed up in my mind with the alternate for Gold and when we broke that channel in Gold yesterday, forgot entirely what the EW count for Silver was projecting. A good reminder that one cannot make assumptions and has to think about individual charts. Nonetheless, I think it would be highly unusual for Gold and Silver to go in separate directions trendwise….
Any thoughts on whether Gold could be in a corrective second wave while Silver is completing an impulsive third up?
Silver is more difficult for me to analyse than Gold, it has truncations and it’s corrections are less often proportional so it’s EW structures don’t look as good. It appears to be more volatile.
There is a fair amount of room for Silver to go lower here. It could have another second wave correction while Gold completes it’s C wave down.
I’m not going to let my Silver analysis influence Gold, but I will slightly let my Gold analysis influence Silver. On a rare occasion I may have a lot more confidence in my Silver analysis and then it may be given some weight when considering Gold, but I don’t like to do that.
I just noticed that Lara’s Silver chart has a target of 18.33 to finish minor three so it is behaving exactly as expected. I managed to overlook the call for divergent price action before as that is always a cautionary note for me personally. They rarely go in different directions so I am re-thinking my view on what is going on with Gold.
Did anyone else notice that?
I cannot tell you how close I came making a cynical post about what the banksters would pull once we had confirmation of breach of that channel yesterday but I figured I would start to sound like a broken record. Those guys never dissapoint!
Personally I am waiting for a close below 1230 on good volume before I close that bullish spread.
Is there a chance of the back test, or are we past that?
Hi Joseph..
it appears to be back testing since the us markets opened this morning.. I can’t see the channel on any of my devices that ive got with me, but someone on here should be able to give you an idea.
No problem, Thomas….thanks for the note.
It looks to be in the 1233-1234 area and we are challenging that level as we speak. If it moves back above 1235 it would have clambered back into the channel. This reminds me of a nasty habit that SPX has had for quite some time, no doubt due to bankster ambushes. It now appears as if the Gold price is being subjected to the same kind of meddling. I am still considering this a second wave move until price tells me I am wrong.
Thanks for the comments, guys. Test of wills. If I were to look at my recent trades, I’m spend about 5% in the upper BB. Good luck to you guys, too.
I’m going to go spend my recent loss on some lunch! 🙂
Equities, precious metals, and the dollar all printing green today so who is pulling our leg?!
No kidding! Markets, Dollar and Gold…All up! What’s or who is going on?!
Somebody played the trump card?
Reading the news I’m convinced the banksters are blaming everything bad on Trump when it’s the banksters who have been screwing us for decades with their market manipulation, financed by you know who…us through government bailouts. Even what would ordinarily be “good” news is twisted to seem bad, if they can get a little chaos going. Trump tweets( oh dear, that is so frightening!) and the banksters, in the shadows, manipulate and blame someone else…Trump or Russia or anyone but themselves. Sorry if any of you are a bankster..I mean all this in a nice way!!! 🙂
Yea…I give up. I’m convinced I’ll have better luck just going off “hot” lists and chase…Nothing is normal (yea, emotion here)
The markets are indeed unhealthy, and nothing is as it seems. We are not only contending with nefarious banksters who excel at gaming the system, and devouring the retail investor, now some 60% of trading volume comes by way of various bot trading systems- its a veritable jungle.
Silver is looking very strong today. Both may be moving back to test underside of broken channel. Volume so far light, but it looks like there is still very strong buying interest in the precious metals…
Hi Verne,
Watching Gold this morning and after seeing your conversation with Dreamer and Alan…does it appear Gold has invalidated that count? I’m on the road and don’t have all my usual tools, but it appears Gold’s current move has eliminated the idea of a wave iv as it has passed into i territory. Any comments? Is it possible v ended at 1221ish and we are now in another crazy B wave to back test the bottom of the channel?
At what approximate point do you see the under side of the channel being tested? Dreamer or Alan are welcome to respond as well. Just trying to get a grip with so little info. Thanks
I have minuette i at 1236.74. Minuette iv is currently at 1232.56 in my delayed BarChart. iv has not entered into i territory.
Thank you for responding Alan. Like I said..my resources are limited today, so I’m trying to get you all to be my eyes and ears! 1236.74 = i
I know it’s changes as we move forward, but would the bottom of the channel be around that number as well?
Ok.. now I see v ending at 1221ish and failed to zoom in on Dreamers awesome chart to see v of (iii). I was looking at the (red) i and not the (black) (i)!
I am assuming some kind of second wave correction unless and until we take out the invalidation point at 1244.49 If we approach that level within a few points I will probably buy back half my short GDXJ puts.
Well, I’m 0-5 since joining this site. Went long at 1232 yesterday on the pullback to channel support and bullish EW count to 1336 target. Although, bouncing now. I’m not sure what to do. I feel like if I flip back short here, I will lose again. Is EW always this difficult or is this an anomaly?
I’m 0-2 now….would like to understand if every day is a 50/50 as well. I get the probability piece, but when probabilities are 50/50 and thoughts are totally mixed… Doesn’t yield confidence. I hope this is an anomaly…
9 bad trades that close at break even and 1 good solid trade is a fantastic set of trades. I always trade tiny lots while adjusting to a new system while using technical analysis you are used to in the past to ensure you are entering at right times. Stops are your best help, exit early if unsure, and no early entries into trades are key points i have to follow closely still to this date. You’ll be okay; just be patient, watch emotion. I’m not preaching I hope, just sharing what I had to learn too and remind myself all of the time. I’d rather win small than lose big. Good luck, chart, share charts, get input too.
Thanks, Joseph… yea, it’ll take getting used to
Don’t feel badly David you are not alone. For quite some time now, making directional trades in these markets has been extremely difficult – whether due to vicious whipsaws in the form of oddly proportioned expanded flats, or strange and persistent multiple standard deviations from the mean, fracturing of normally reliable correlations, and a host of other “anomalies”, there have been some very strange goings on. The only thing one can do in this kind of situation is hedge every trade, even when you think you are certain about the trend. To be honest, what is happening now with Gold and Silver is clearly not at all what we were expecting but if the count is right, we have to consider it a counter-trend move and trade accordingly, until of course we are proven wrong.
David. Don’t feel too bad. All of us are in the same boat. I for one dare not place high bets as the current volatility is too ominous. Small bets and small winnings are the safe way forward.
You may like to read my comments below to weiquan for a theoretical grasp of the general situation.
Possible hourly
https://www.tradingview.com/x/H7ZpIKdI/
I am getting convinced that the points labelled as minuette iii and iv are actually subminuette i and ii of minuette iii. With this, minuette iii has ended at the current low of 1221.71. I am looking at Minute 1 reaching down to 1212 or 1203, with the view of shorting at Minute 2. Let’s see how this plays out.
Yep. We agree on the short term, although as of now I’m thinking that this entire correction may not be much lower than 1,200 and may be over by later next week. We’ll have to see how it goes…
That would be the scenario for the alternate count. Lara has it as an ABC. For the main count, Minor C is a 5-wave structure. It would be interesting to see which structure is the more likely. If it swings the other way, then poor Lara had to vacillate once more.
I agree that this correction is not going to be very deep and that is why I kept my bullish put spread on GDXJ. I do not fully trust this “breakout” we are seeing in the equity indices and think that they are all close to an interim top, which means that PMs are not going to decline very much before the uptrend resumes.
At the moment, my target is 1205. In fact, I have a few other indicators that point to 1205 being the low.
The only exception is Lara’s current Main Count. If that is correct, then gold is headed to the 1170s, at least lower than 1181.41 to avoid a truncation.
When 1205 is reached, the rebound will determine which scenario is correct. That will be next week’s adventure. That Mr Market had deemed it right to conceal his hand, we have no other (safe) choice but to take it one step at a time.
Gold daily. This is the more bullish version of Lara’s alternate.
https://www.tradingview.com/x/3NocxoGv/
Link for Harald. Same as the chart shown.
Thanks! The linked version is perfectly clear for me 🙂
How to save image from pmbull live chart? It was possible before but now the site has changed and does not allow.
Thanks
Gold and silver just back tested the breakout at NL of 4 hour, 3hr, and 1 hr period HnS’s from Nov 8 2016 at 1220.
Target same as Lara’s 1330+.
Thanks again for the excellent chart summaries Dreamer.
Thanks Verne. I learn from reading your Daily thoughts. Keep up the good work!
Here’s the USD via DXY. Looks like a clean breakout today. Expecting a move toward 102, then we’ll need to watch carefully for direction.
Lara, just curious, do you have the “ultimate” version of Motive wave? If so, does the “scanner” function work to help find 3rd wave candidates for your Trading Room?
Good question Dreamer. Yes, I have the full ultimate version of MW. Have never used their scanner, and I don’t use their auto wave labelling either.
I use my eyes… and Cesar 🙂
Successful short term trading is really hard. It requires a long time tested trading system…Good luck!!
weiquan, for short timeframes, as we move down to lower degree waves, the “noise” becomes more pronounced. I would not base my trades solely on any system, time-tested or otherwise. I only use that as a beacon, with appropriate inflection points prominently displayed. Lara’s change in stance with the main and alternate counts in the last two days is a good example. Kudos to her for being quick to adapt to change.
Any system is basically a mathematical model, usually based on a linear forecasting technique to predict a non-linear market. As such, one has to be nimble, and quick to adapt to scenario changes. Situations change on a whim, driven by Chaos Theory. Until someone develops a computer simulation model based on the Chaos Theory equations, coupled with reliable live feeds at sub-second level (with a sampling rate of at least 8 data points per second), no mathematical model can truly align forecasts with reality.
The woes of short term traders are exacerbated by the fact that they often trade on leverage, and any abrupt change is greatly magnified. Yet, all this contribute to the thrill of the challenge of besting Mr Market. The euphoria is akin to a fisherman landing “the big one”.
I think that the Silver correction will likely end near it’s neckline
Here’s the hourly
The expanding diagonal idea for GDX went higher than expected, but with the strong downwards move today, it seems to be correct. My only question is whether it is a LEADING diagonal or ENDING diagonal.
ENDING is more common, but I think in this case a LEADING diagonal may look better as it keeps the correction above the neckline extension rail. See notes on chart with invalidation point for the LEADING idea.
This correction, when complete, should offer an excellent long entry opportunity.
Dreamer your charts on here are pretty blurry and hard to read values and smaller text on. Can you also post the direct links to the TradingView image files? I think that would be better. Thanks!
Hi Harald,
I actually don’t post them on Trading View. I just screenshot them. What do you view them on?
I can see them very clearly on my iPad or iPhone by just enlarging the page with a pinch. If you are using a Windows PC with most browsers you can adjust the zoom by going to the view tab.
Hope this helps. If not, let me know.
PS unfortunately the software that EWG uses doesn’t allow charts to enlarge when they are clicked on. We asked Lara about that some time ago.
I’m on a Mac. I can enlarge them but the font is still very blurry. When you’re on TradingView there’s a camera icon on the bottom toolbar. If you use that one you get a link which will have the chart as picture in good quality. (It’s not the same as sharing an idea on TradingView). I think if you could post that link that would solve my problem!
OK.
The Image quality is quite good on my tablet.