
Introduction:
The Trading Room is a new idea that I want to test and develop over the next few months.
I find myself spending a lot of time writing and publishing analysis of Gold and the S&P500 (over at Elliott Wave Stock Market) when those markets are quiet and range bound and offer no good trading opportunities. This focus on inactive markets takes focus away from markets that are trending and do offer good trading opportunities.
What if the focus was on finding good trading opportunities over a range of markets rather than daily analysis of specific markets? What if the Trading Room can be the platform for publishing these good trading opportunities?
Therefore, this Trading Room approach will look over a range of markets to identify any possible trading set ups which may unfold now or over the next few days, and the focus will be on trading set ups and not on teaching and learning Elliott wave.
Analysis will be brief and to the point.
As always, it is essential that anyone using this analysis for trading advice manages risk carefully. Follow my two Golden Rules:
1. Always use a stop.
2. Never invest more than 1-5% of equity on any one trade.
Trading is about probabilities, not certainties. Failure to follow my two Golden Rules of trading indicates failure to manage risk.
Today’s Trading Room focuses on NZDUSD, EURUSD, USD, and GDX:
EURUSD
TECHNICAL ANALYSIS
Click chart to enlarge.
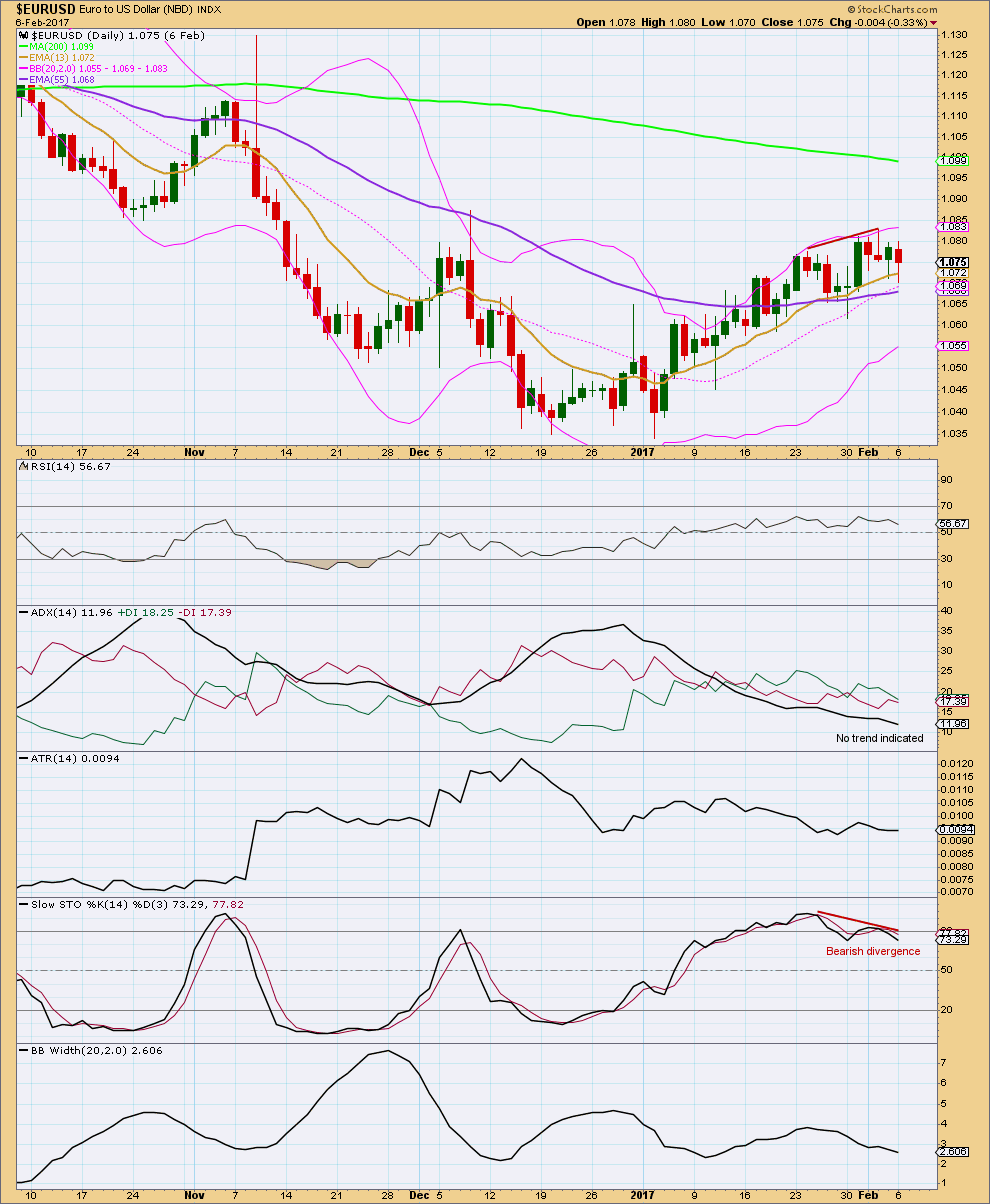
So far upwards movement should be assumed to be a counter trend movement, until proven otherwise. The prior wave down put ADX into extreme and upwards movement from the 3rd of January has brought ADX back down from extreme. There is again room for a trend to develop.
Single divergence with Stochastics on its own is not enough to indicate a high in place. A breach of a support line should be seen before entering short.
Stockcharts do not offer volume data for currencies, so this is analysed below with BarChart data.
ELLIOTT WAVE ANALYSIS + VOLUME ANALYSIS
Click chart to enlarge.
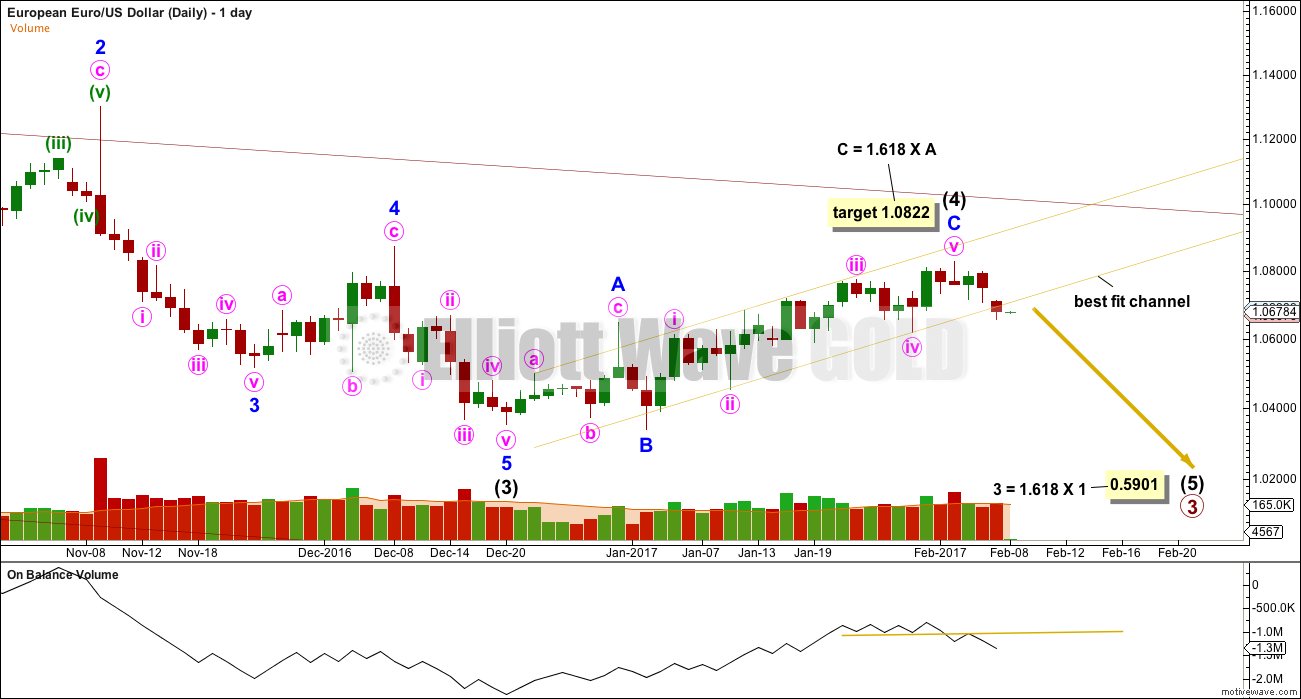
The best fit channel is slightly adjusted to be more conservative than the last published chart for EURUSD. If price can print a full daily candlestick below the lower edge of the yellow channel, that would offer further confidence in a trend change. When that trend line is breached, then it should offer resistance.
Stops may be set a little above the trend line offering a low risk high reward opportunity. Do not set stops too close to the line; allow the market room to move. Sometimes trend lines are overshot and this trend line is not perfect.
On Balance Volume has confidently breached a horizontal support line which offers strong technical significance. A retest of resistance at that line shows it holds. This is a strong bearish signal.
NZDUSD
TECHNICAL ANALYSIS
Click chart to enlarge.
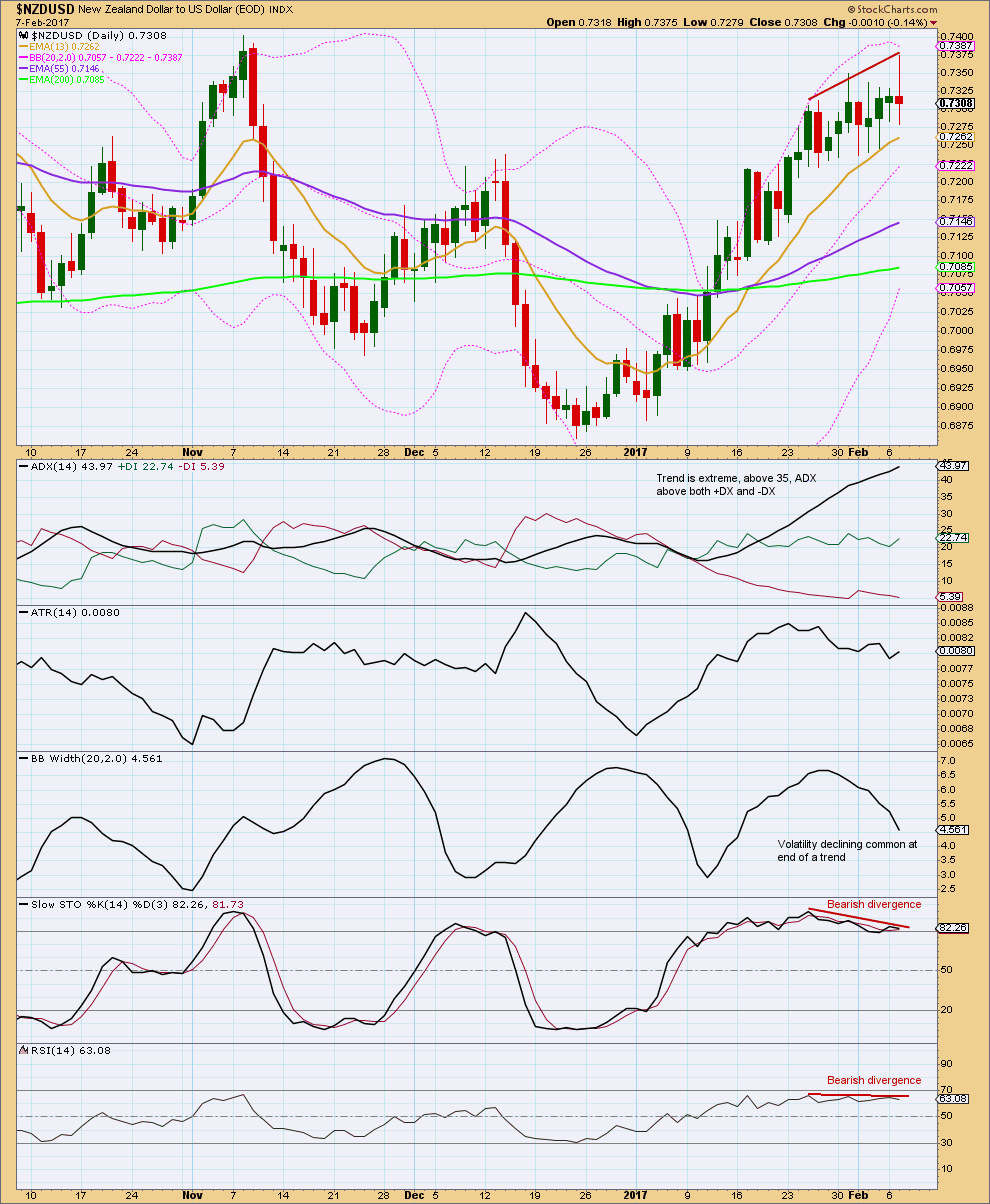
Classic technical analysis of this pair is very bearish. The long upper wick on this last daily candlestick is bearish. This trend is extreme; it will end sooner rather than later.
ELLIOTT WAVE ANALYSIS + VOLUME ANALYSIS
Click chart to enlarge.
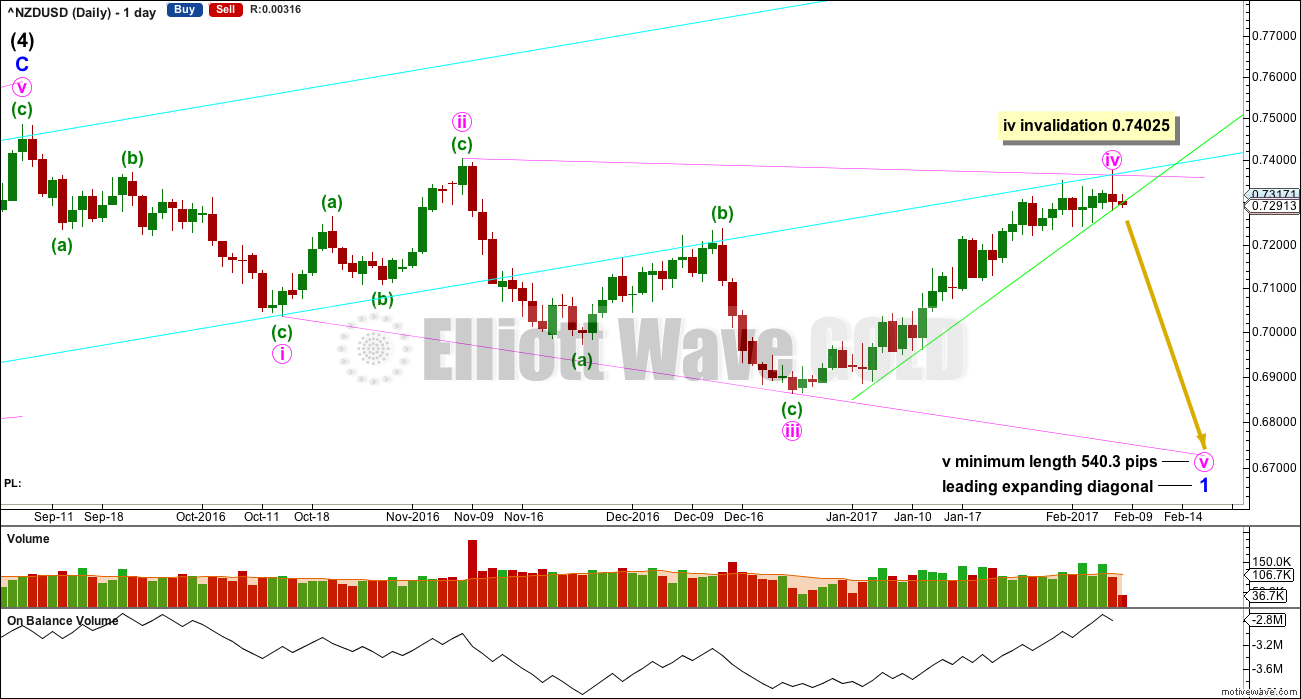
On Balance Volume has no trend line. Any trend line drawn would have too steep a slope to have reasonable technical significance.
If an expanding diagonal is unfolding, then minute iv must be either over now or very close indeed. There is almost no room left for it to move.
I have been analysing NZDUSD (because I’m a Kiwi) for years using Elliott wave and I will note that NZDUSD rarely offers good looking Elliott wave structures. Therefore, I place more weight in classic analysis of this pair than Elliott wave analysis. The Elliott wave analysis is supplementary.
I will wait for the green support line to be fully breached before going short here.
USD INDEX
TECHNICAL ANALYSIS
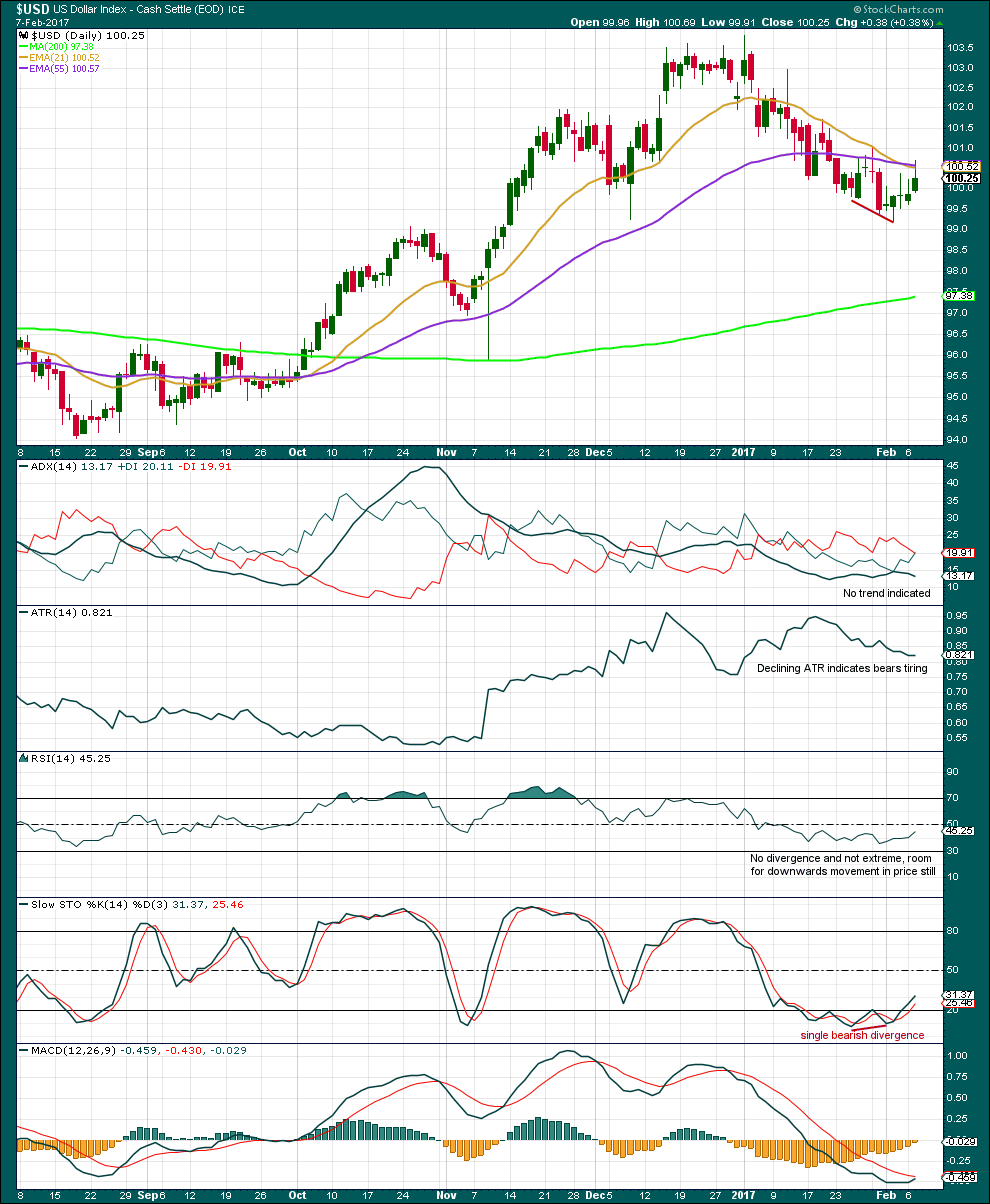
Click chart to enlarge.
There is not enough bullish indication here to go long yet. Upwards movement on this chart is a clear trend and downwards movement is choppy and overlapping, so downwards movement looks more like a counter trend movement. If that conclusion is correct, then USD should break out upwards.
The larger trend at the monthly chart level remains up and the 200 day moving average still has a positive slope.
ELLIOTT WAVE ANALYSIS
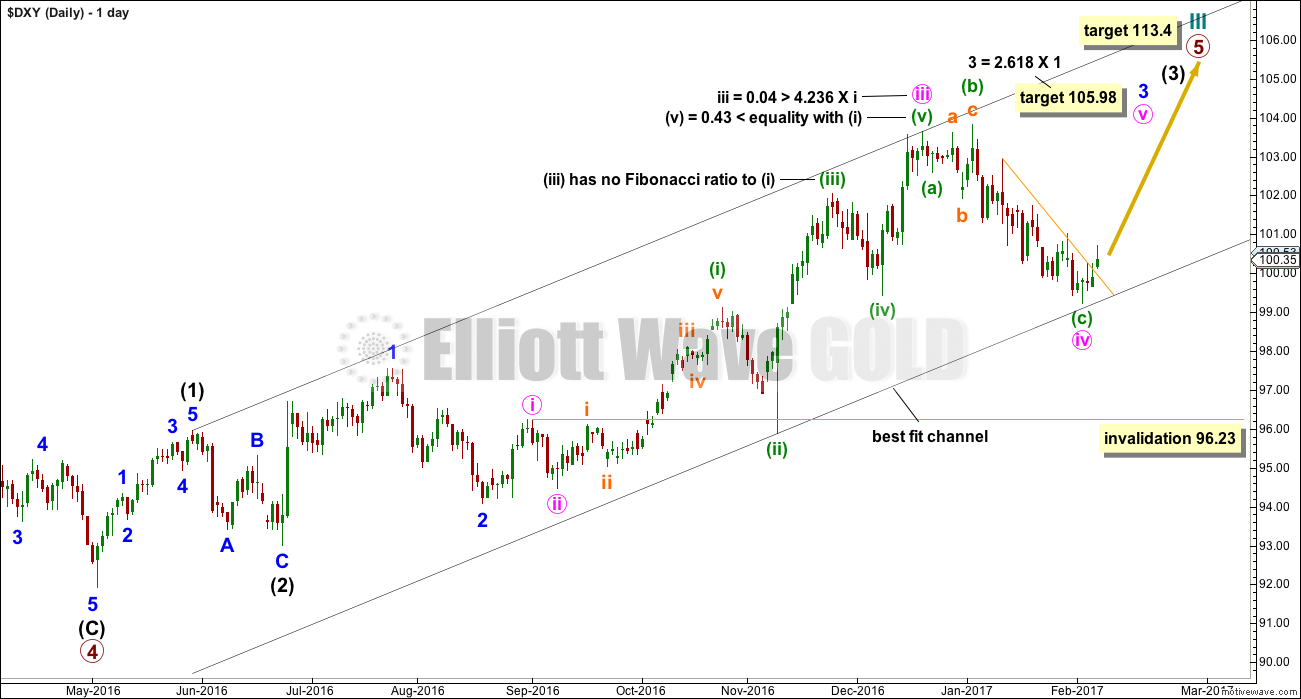
Click chart to enlarge.
Neither Stockcharts nor BarChart have volume data.
The short term yellow resistance line has been breached. However, the long upper wicks on the last two daily candlesticks gives some cause for concern.
Price may be bouncing up from the lower edge of the best fit channel. With another upwards day moving further away from the trend line, a long position may be entered. A stop may be set just below the last low.
GDX
TECHNICAL ANALYSIS
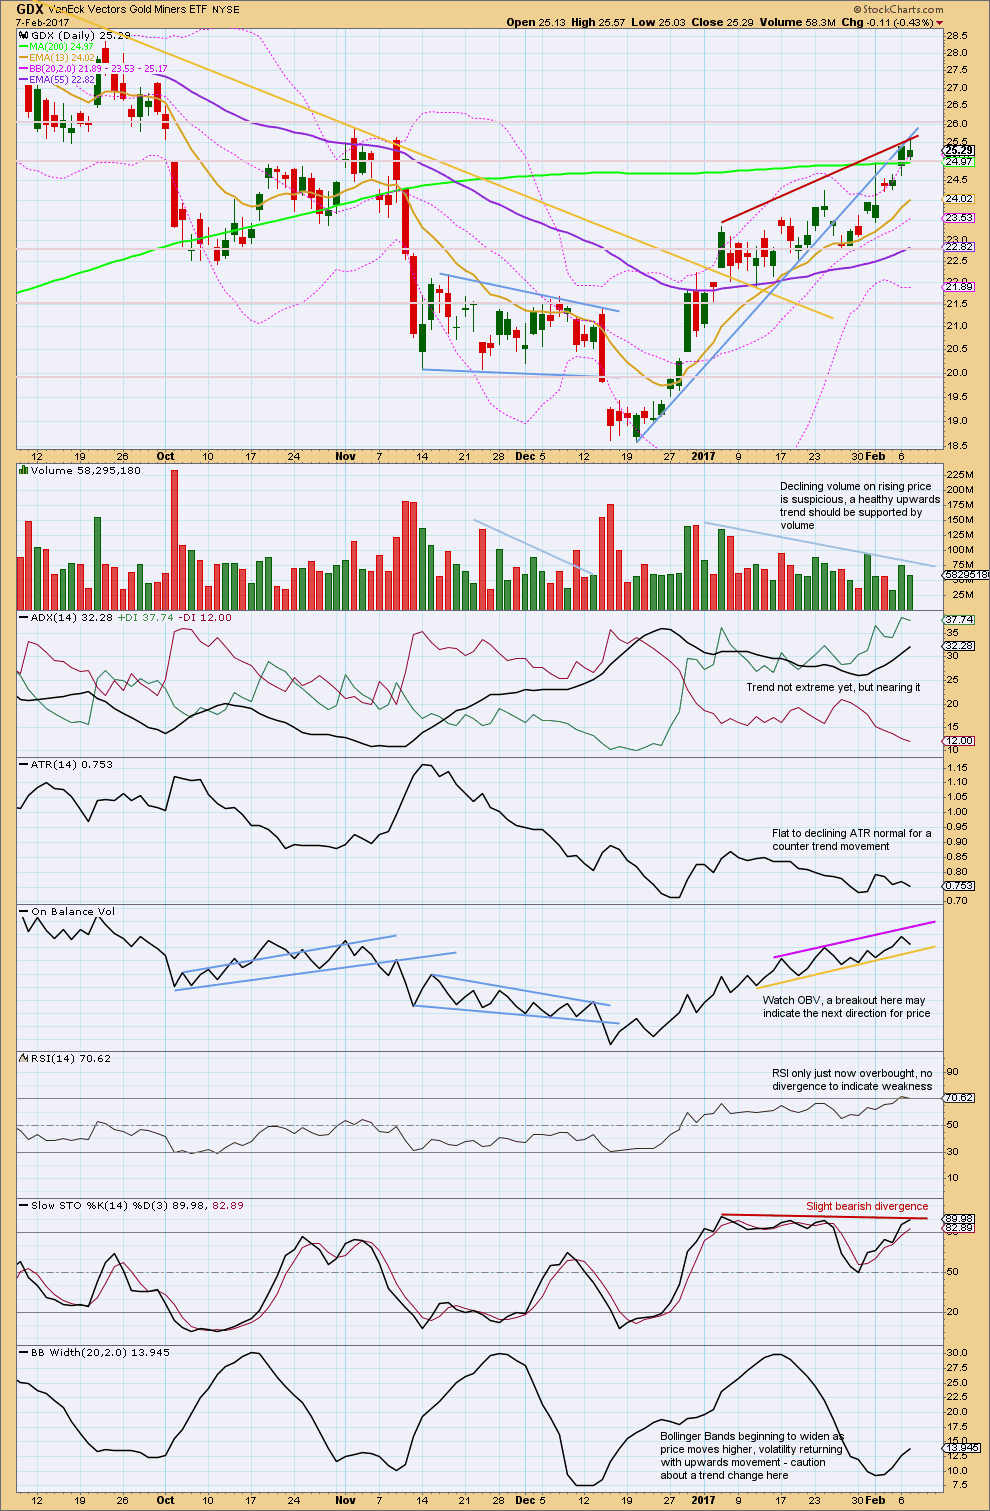
Click chart to enlarge.
Next resistance is at 26.0.
This chart is provided today mostly for members of Elliott Wave Gold and not because I see a trading set up here, because I don’t. (That doesn’t mean one does not exist, only that I don’t see it today).
Going long here risks entering at the end of the trend. ADX is nearing extreme and price has closed above the upper edge of Bollinger Bands now for the last four sessions.
Going short here is trying to pick a top. Before going short at least two of the following should be seen: a bearish candlestick pattern, a break of support by On Balance Volume, divergence with price from RSI while overbought, price to move below the short term 13 day moving average.
This analysis is published @ 02:59 a.m. EST.
Hello Lara,
Will you be doing an update today on the Trading Room?
Sorry Nick, just saw your comment.
I’ll be updating it twice a week at least, more if I see any other urgent opportunities.
Update on the situation today:
NZDUSD is printing a big fat red candlestick which breaks below the support line. If the next wave down is underway this is very early, I’m jumping in short.
EURUSD has had a small bounce with a green doji still touching that support line. OBV should find resistance and price should find resistance, a good opportunity for a punt on the short side. Use a stop! Just above the high at 1.08285 is best, or just above the yellow line (more risk of being whipsawed out).
USD index is printing a red daily candlestick, an inside day. This is now a full breach above my resistance line. Possibly a good opportunity here to go long. Use a stop! Just below the last low at 99.23 is safest.
Thanks for the updates 🙂
And yet another stroke of genius! Trading Room is a great idea, Lara. As Ari mentioned, please keep USOIL in mind. Its movement down over the last few days is close to confirming a trend change to the down side and should soon present a good trading opportunity for your members.
Yes, I will indeed.
My problem is that my US Oil data feed comes from FXCM, while the rest of the markets I’m analysing use BarChart data.
So I have to log into a different platform with Motive Wave to update my Oil counts.
That’s helpful feedback, thank you all.
The idea is to develop this and see how it goes over the next few months with twice weekly posts.
The idea is not to add this as a third website, the idea is Traders Room could replace both EWG and EWSM. There’s no way I’m going to be able to do all three, my time would be too spread out. If Traders Room as an idea is going to work it needs focus.
I’d also need to expand the number of markets I’m looking at daily to increase the chances of finding a good trend to join.
Which brings me now to Gold. I’m going to look for an entry to go long.
For years now, I have wished you would just tell us which markets are just starting a wave 3 long or short. That would save you time and allow us more quality trades.
Yeah, for years now I’ve wished I could do just that 🙂
Brilliant idea! Keep up the good work… This will be useful
Like the new trading room idea. I don’t care what I am trading as long as I can get a return on my investment. Waiting for one market to setup is opportunity cost so it would make my trading days more efficient.
That makes sense to me Lara. I would like to seek a EW on the Iwm and transports. The russel has fallen below its 50 day moving average. MACD seems like it is thinking about rolling over for the qqq s.
Hedging short GDXJ trade with sale of an equal number of 45 strike puts, essentially turning trade into a bullish put credit spread. Waiting for option chains to list to see what they are offering. We could go much higher as Alan has suggested. My! Such bullishness!! And that a’int no bull! 🙂
TLT trade looking good pre-market. Will be rolling calls into 122.50 strikes as I think we have potentially much more upside. Looking for Oil to break the critical 50.00 pivot to add to short positions.
Look at Gold and Silver go! If they close in the green today it will be the third day sailing along above the upper BB. I think my half-in-jest musing about movement above the BB being a buy signal for algos does carry some at least some slight possibility. Who is buying at these levels??!!! 😀
Oh…and Dreamer, don’t forget the fourth and equally important reason – you guessed it…to make money!! 🙂
Absolutley BRILLIANT Lara!
A fantastic, and most welcome expansion and application of your considerable analytical skills.
Wow! Looking forward to seeing this unfold. There is always a third wave developing somewhere…let’g go find em!! 🙂
Another great advantage of this idea is the market moving power of a trading posse.
As the membership grows, and we all become more comfortable recognizing and taking action on the setups Lara identifies. It makes it much more difficult for market makers to ambush trades, which is often easy to do with individual traders.
I still remember when I was trading with Bryan Bottarelli how our positions would absolutely explode into profitability as members made the trades, and market makers had to scramble to buy shares of the option calls as they had no idea how many of them were going to be excercised. I know not everyone trades options but the principle still applies. This has the potential to be great fun!
I actually did consider buying the domain “trading posse.com” after your comment about how that worked previously 🙂
We would need a decent group of traders with good sized accounts.
Cool!
I like this!!! Would be good to take this to the next level (working on trade setups-entry/exit; long and short different markets). I trade currencies, stocks, indexes and commodities. Traded oil and /HO for decade. Indexes for few years. Stocks for 2 decades. Having said that, 2017/2018 will be one of the most interesting time period for traders.
Hi Lara,
I think you are going in the right direction with your new “trading room” idea.
I think people become members of your website for 3 reasons:
1) To make money
2) To make money
3) To make money
And a few may actually be interested in learning EW from the best EW analyst on the web. But let’s be realistic, EW basics are “easy” to learn, but the devil is in the details. Learning all the conventions, nuances, fib ratios, etc. takes work and most don’t have the time or attention to detail that is required to become a world class EW analyst.
So, the bottom line is that while you have developed the best EW learning site on the web, you have “limited”your audience to those that are true EW believers and those that have the “patience” to wait for the right trading opportunities.
As much as you love the detail analysis and teaching, realistically, your member count is most important for the health of your business. Retaining existing members and adding new members is the key to your success.
So how do you do that? Remember the saying, “there’s always a bull market somewhere”. Like you said, you do a lot of detail analysis on non trending markets. When inexperienced traders try to trade those markets, they often lose money, get frustrated, lose patience, lose faith in EW, and become “at risk” of ending their membership.
So if you could always provide your members with one or more trending markets to trade, even impatient members and those that don’t care so much about learning EW in detail can make money and be happy. Ideally, if you could identify markets in “3rd” waves that would offer “days to weeks” trades, that would be great. It would be a bonus if you could provide specific buy and sell recommendations (hint: new tab with a spreadsheet or “dashboard” look. You could even go one step further with accountability and visibly track your results for members ( I know, that’s risky).
In closing, I hope that you keep analyzing your core markets, Gold, Silver, GDX, Oil, in detail with your weekly and occasional videos as we do love the detail.
That said, if you do need to cut back a little on the core (especially when they are not trending), to free up time for the execution of your “Trading room”, that would be OK.
Looking forward to seeing this idea develop!
This is an idea of genius proportions!
“What if the focus was on finding good trading opportunities over a range of markets rather than daily analysis of specific markets? What if the Trading Room can be the platform for publishing these good trading opportunities?”
Yes, yes, and… yes!
I would add the current US oil to the list since it might just be breaking out to the downside providing price confirmation…
Hi Lara,
I think the Trading Room is an excellent idea- well done!
Thanks for your feedback Nick 🙂
Let me know if there are any tweaks you think may help you.
I’m interested in what members think of this format.
I’ll develop it over the next few months with your feedback.
Hi Lara!
This format is very interesting!