
A downwards reaction was expected after a strong upwards thrust. Fibonacci ratios are used as targets for this pullback to end.
Summary: Look for the pullback to end about 1,318. Thereafter, expect the upwards swing to continue to a target at 1,367.
New updates to this analysis are in bold.
Grand SuperCycle analysis is here.
Last in-depth historic analysis with monthly and several weekly charts is here, video is here.
There are multiple wave counts at this time at the weekly and monthly chart levels. In order to make this analysis manageable and accessible only two will be published on a daily basis, one bullish and one bearish. This does not mean the other possibilities may not be correct, only that publication of them all each day is too much to digest. At this stage, they do not diverge from the two possibilities below.
BULLISH ELLIOTT WAVE COUNT
FIRST WEEKLY CHART
Click chart to enlarge.
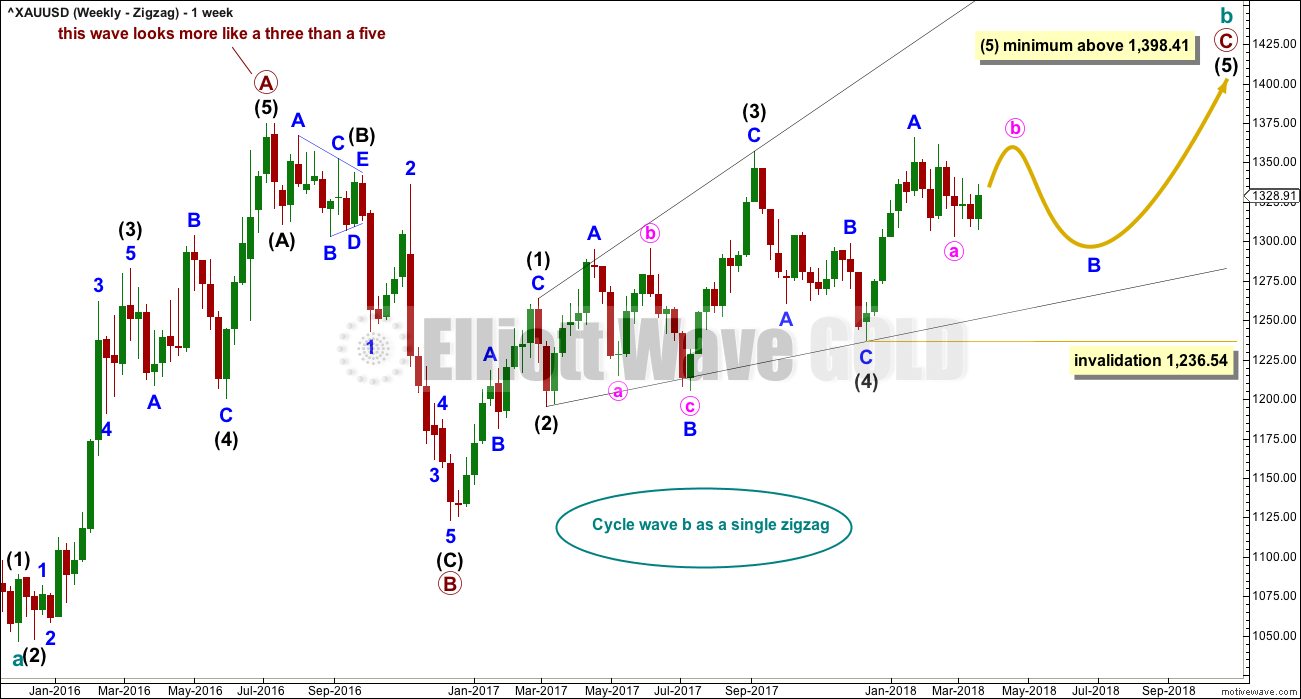
Cycle wave b may be a single zigzag. Zigzags subdivide 5-3-5. Primary wave C must subdivide as a five wave structure and may be either an impulse or an ending diagonal. Overlapping at this stage indicates an ending diagonal.
Within an ending diagonal, all sub-waves must subdivide as zigzags. Intermediate wave (4) must overlap into intermediate wave (1) price territory. This diagonal is expanding: intermediate wave (3) is longer than intermediate wave (1) and intermediate wave (4) is longer than intermediate wave (2). Intermediate wave (5) must be longer than intermediate wave (3), so it must end above 1,398.41 where it would reach equality in length with intermediate wave (3).
Within the final zigzag of intermediate wave (5), minor wave B may not move beyond the start of minor wave A below 1,236.54.
Within the diagonal of primary wave C, each sub-wave is extending in price and so may also do so in time. Within each zigzag, minor wave B may exhibit alternation in structure and may show an increased duration.
Within intermediate wave (1), minor wave B was a triangle lasting 11 days. Within intermediate wave (2), minor wave B was a zigzag lasting 2 days. Within intermediate wave (3), minor wave B was a regular flat lasting 60 days. Within intermediate wave (4), minor wave B was a regular contracting triangle lasting 40 days. Within intermediate wave (5), minor wave B may be expected to be an expanded flat, combination or running triangle to exhibit some alternation in structure. It may last as long as 40 to 60 days. So far it has lasted 40 days (refer to daily chart) and the structure is incomplete.
At this stage, it looks like minor wave B may most likely be a flat correction, or it may also still be a triangle. Both ideas are presented below.
This first weekly chart sees the upwards wave labelled primary wave A as a five wave structure. It must be acknowledged that this upwards wave looks better as a three than it does as a five. The fifth weekly chart below will consider the possibility that it was a three.
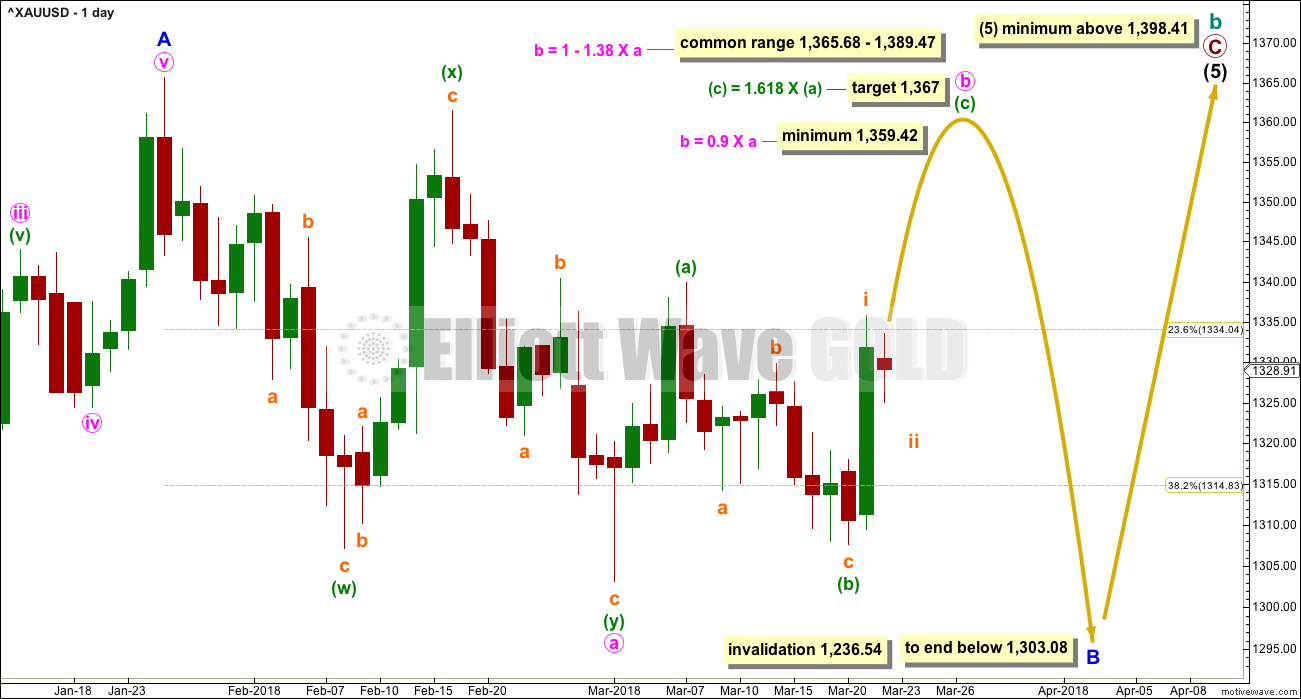
FIRST DAILY CHART – FLAT
Click chart to enlarge.
Minor wave B may be an incomplete flat correction, and within the flat minute wave a must subdivide as a three, which may have been a double zigzag.
Minute wave b must also subdivide as a three and must retrace a minimum 0.9 length of minute wave a. The target would see minute wave b end within the most common range for B waves within flats, and at an area of strong resistance.
Minuette wave (c) must subdivide as a five wave structure. It may only be either an impulse or an ending diagonal. An impulse is much more likely.
Subminuette wave ii is showing up on today’s daily chart. When it is complete, minuette wave (c) should look like a five wave structure, and within it both of subminuette waves ii and iv should show up on the daily chart to give the wave count the right look.
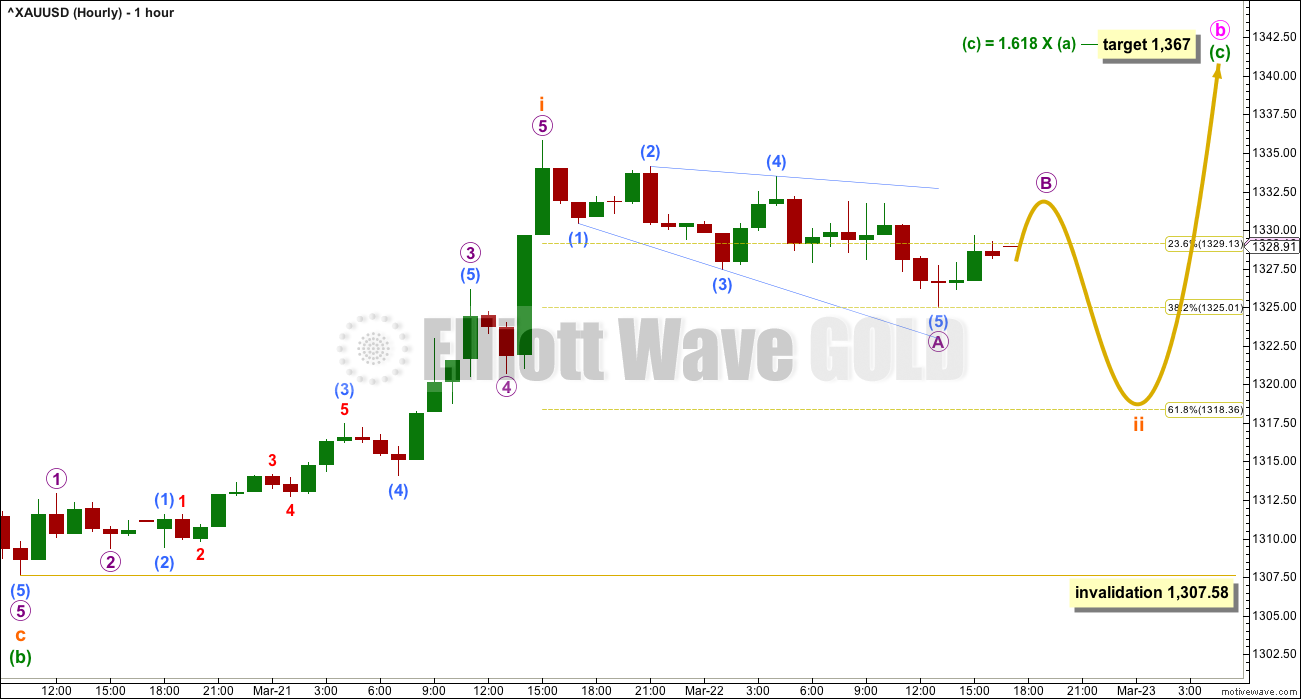
HOURLY CHART
Click chart to enlarge.
Minuette wave (c) may have begun with a strong first wave. It is possible to see a complete impulse upwards, which is labelled subminuette wave i.
Subminuette wave ii may correct to either the 0.382 or 0.618 Fibonacci ratios. Subminuette wave ii may not move beyond the start of subminuette wave i below 1,307.58.
At this stage, the first downwards movement of subminuette wave ii is labelled as a leading expanding diagonal for micro wave A. If this labelling of micro wave A as a five is correct, then micro wave B should not move beyond its start above 1,335.79.
It is also possible to see micro wave A complete as a three wave structure ending at the low labelled sub-micro wave (3). If micro wave A was a three wave structure, then micro wave B may make a new high above the start of micro wave A at 1,335.79. An invalidation point here is not added to the chart for this reason.
It looks like subminuette wave ii may continue further and may end closer to the 0.618 Fibonacci ratio at 1,318.
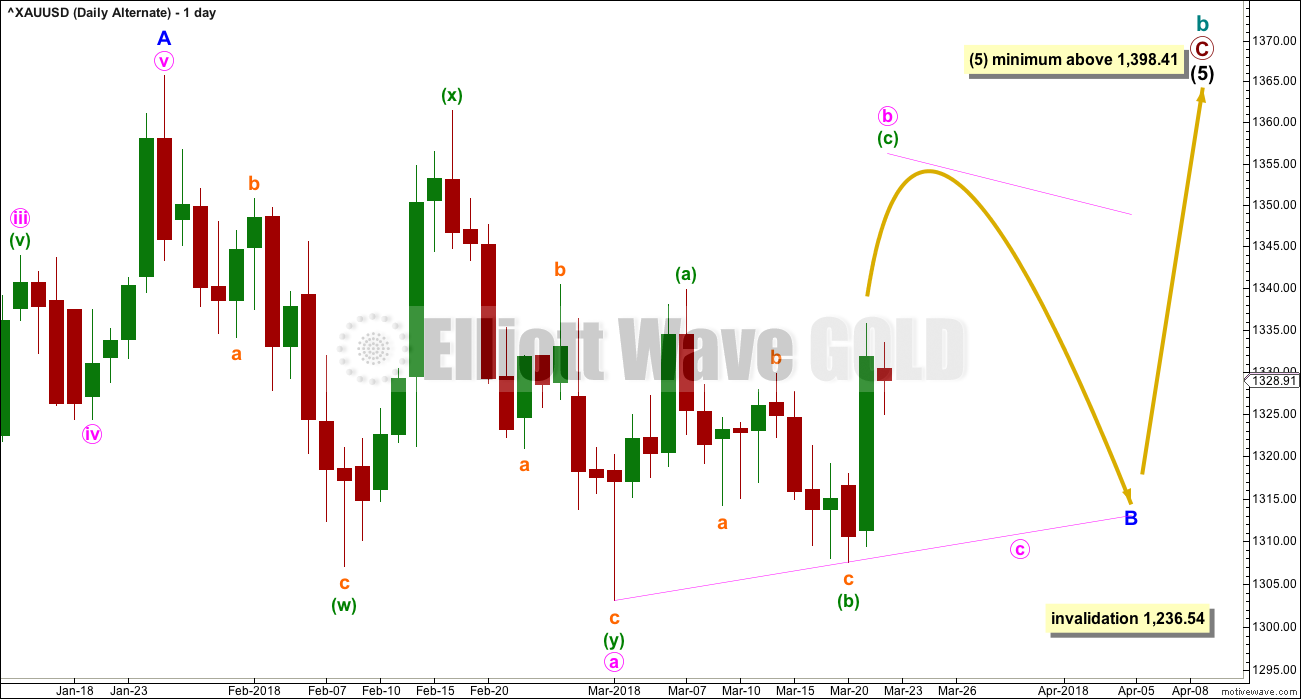
SECOND DAILY CHART – TRIANGLE
Click chart to enlarge.
This alternate daily chart is identical to the first daily chart up to the high labelled minor wave A. Thereafter, it looks at a different structure for minor wave B.
Minor wave B may be an incomplete triangle, and within it minute wave a may have been a double zigzag. All remaining triangle sub-waves must be simple A-B-C structures, and three of the four remaining sub-waves must be simple zigzags. One remaining sub-wave may be a flat correction.
Minute wave b may be unfolding upwards as a single zigzag, and within it minuette wave (b) may not move beyond the start of minuette wave (a) below 1,303.08.
This alternate wave count expects weeks of choppy overlapping movement in an ever decreasing range.
BEARISH ELLIOTT WAVE COUNT
FIFTH WEEKLY CHART
Click chart to enlarge.
There were five weekly charts published in the last historic analysis. This fifth weekly chart is the most immediately bearish wave count, so this is published as a bearish possibility.
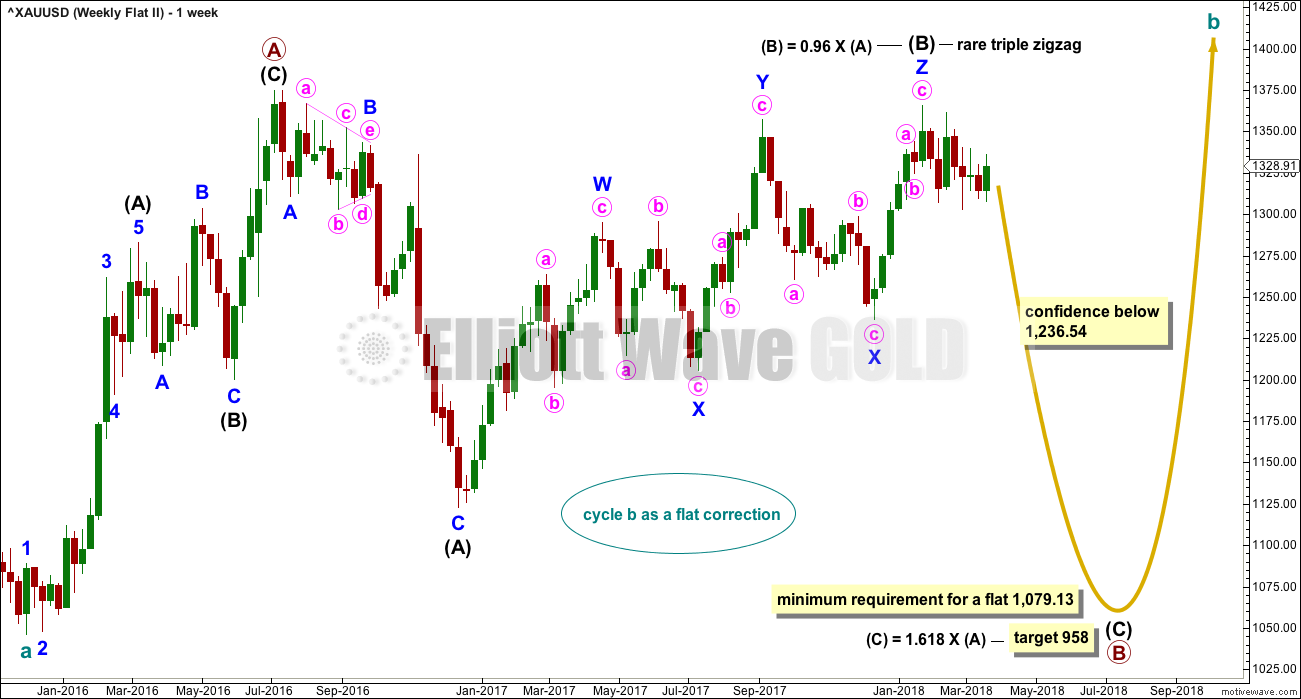
This fifth weekly chart sees cycle wave b as a flat correction, and within it intermediate wave (B) may be a complete triple zigzag. This would indicate a regular flat as intermediate wave (B) is less than 1.05 the length of intermediate wave (A).
If cycle wave b is a flat correction, then within it primary wave B must retrace a minimum 0.9 length of primary wave A at 1,079.13 or below. The most common length of B waves within flats is from 1 to 1.38 times the length of the A wave. The target calculated would see primary wave B end within this range.
I have only seen two triple zigzags before during my 10 years of daily Elliott wave analysis. If this wave count turns out to be correct, this would be the third. The rarity of this structure is identified on the chart.
FIFTH DAILY CHART
Click chart to enlarge.
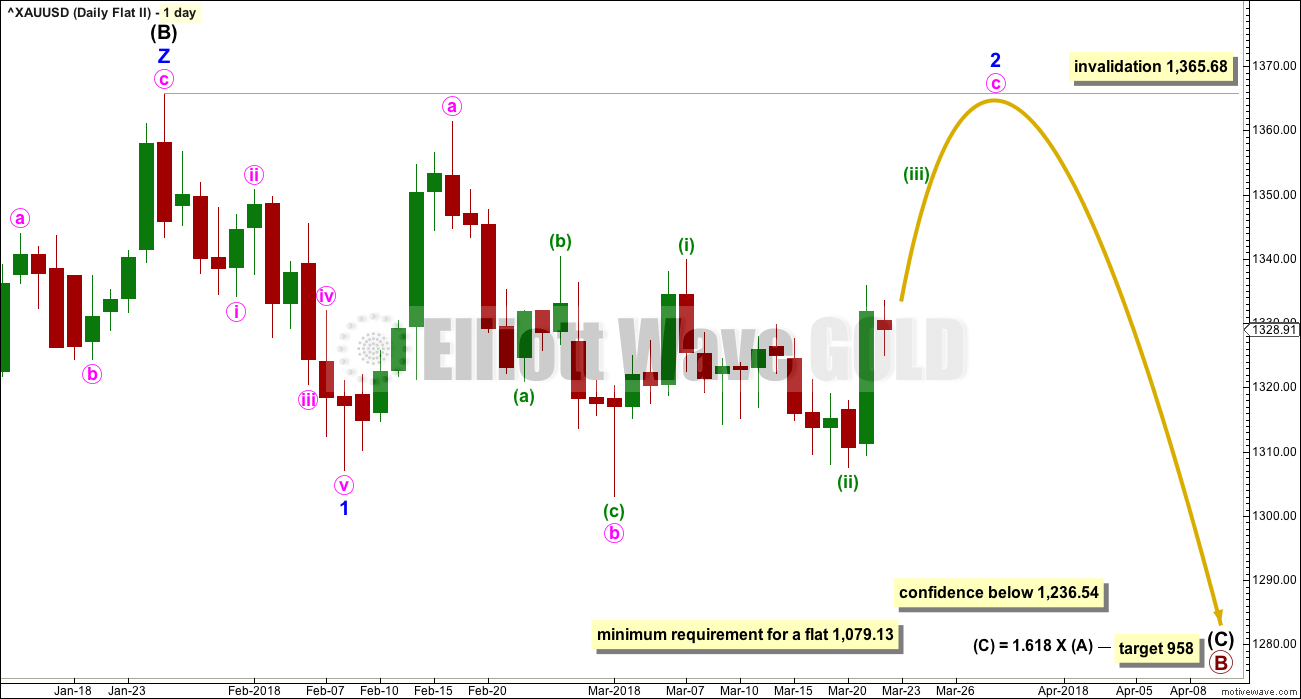
If a new wave down at intermediate degree is beginning, then the first wave of minor wave 1 must subdivide as a five, which may only be an impulse or a leading diagonal.
Minor wave 1 may have been a complete impulse over on the 8th of February. But this downwards wave does not look very good as a five. It can be made to fit at lower time frames, but this movement fits better as a zigzag. The probability of this wave count is reduced.
Minor wave 2 may be an incomplete expanded flat. Minute wave c would be likely to end at least slightly above the end of minute wave a at 1,361.46 to avoid a truncation and a very rare running flat. Minor wave 2 may not move beyond the start of minor wave 1 above 1,365.68.
TECHNICAL ANALYSIS
WEEKLY CHART
Click chart to enlarge. Chart courtesy of StockCharts.com.
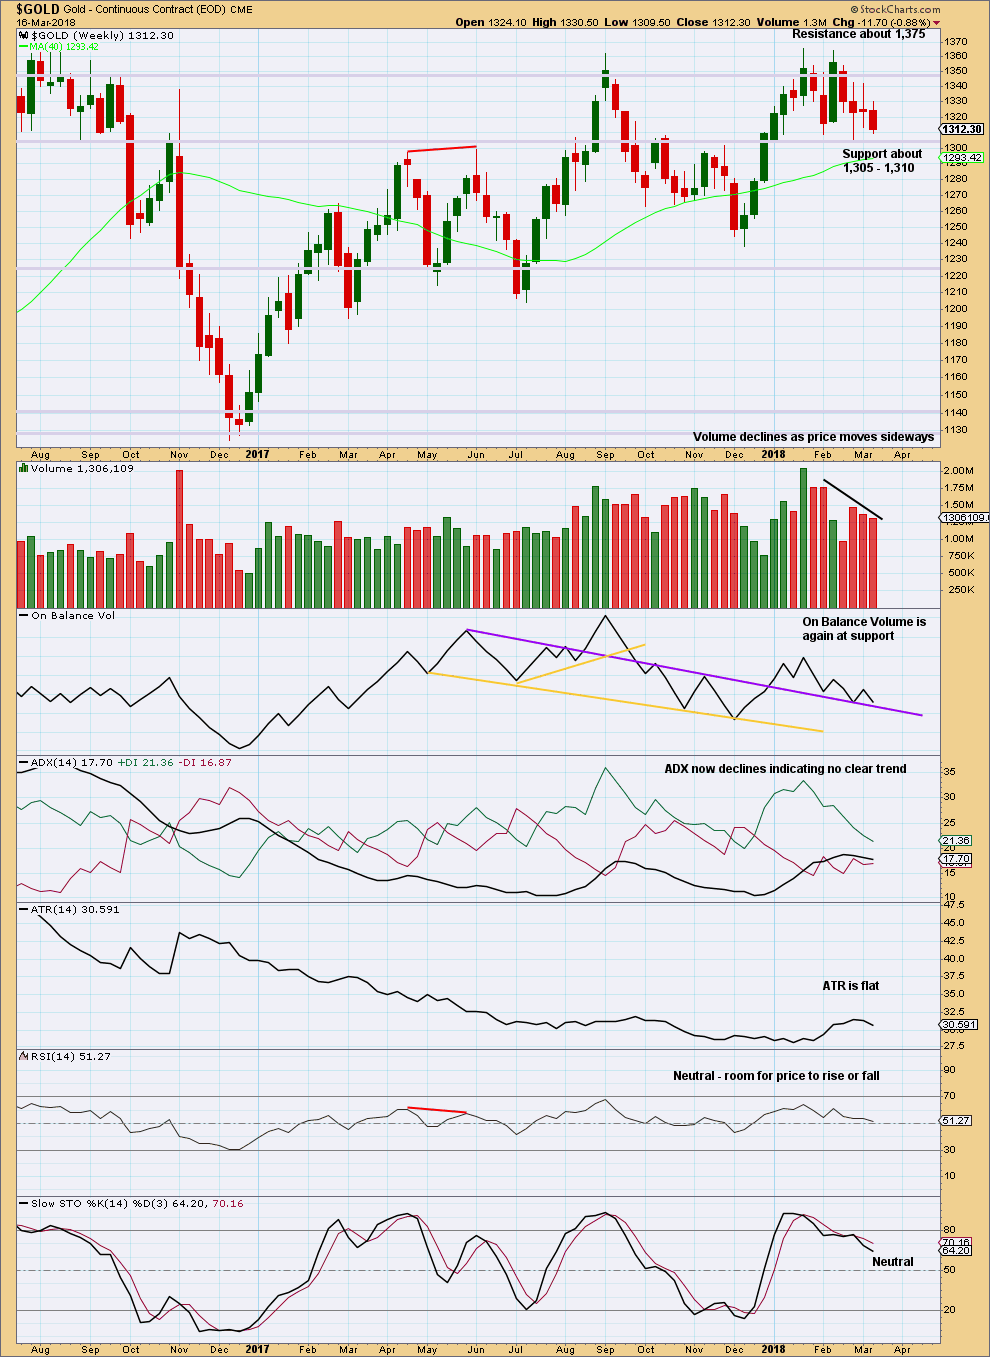
Price is again at support and On Balance Volume is almost at support. With volume continuing to decline, it looks reasonable to expect a turn back to an upwards swing about here.
Price is still range bound.
DAILY CHART
Click chart to enlarge. Chart courtesy of StockCharts.com.
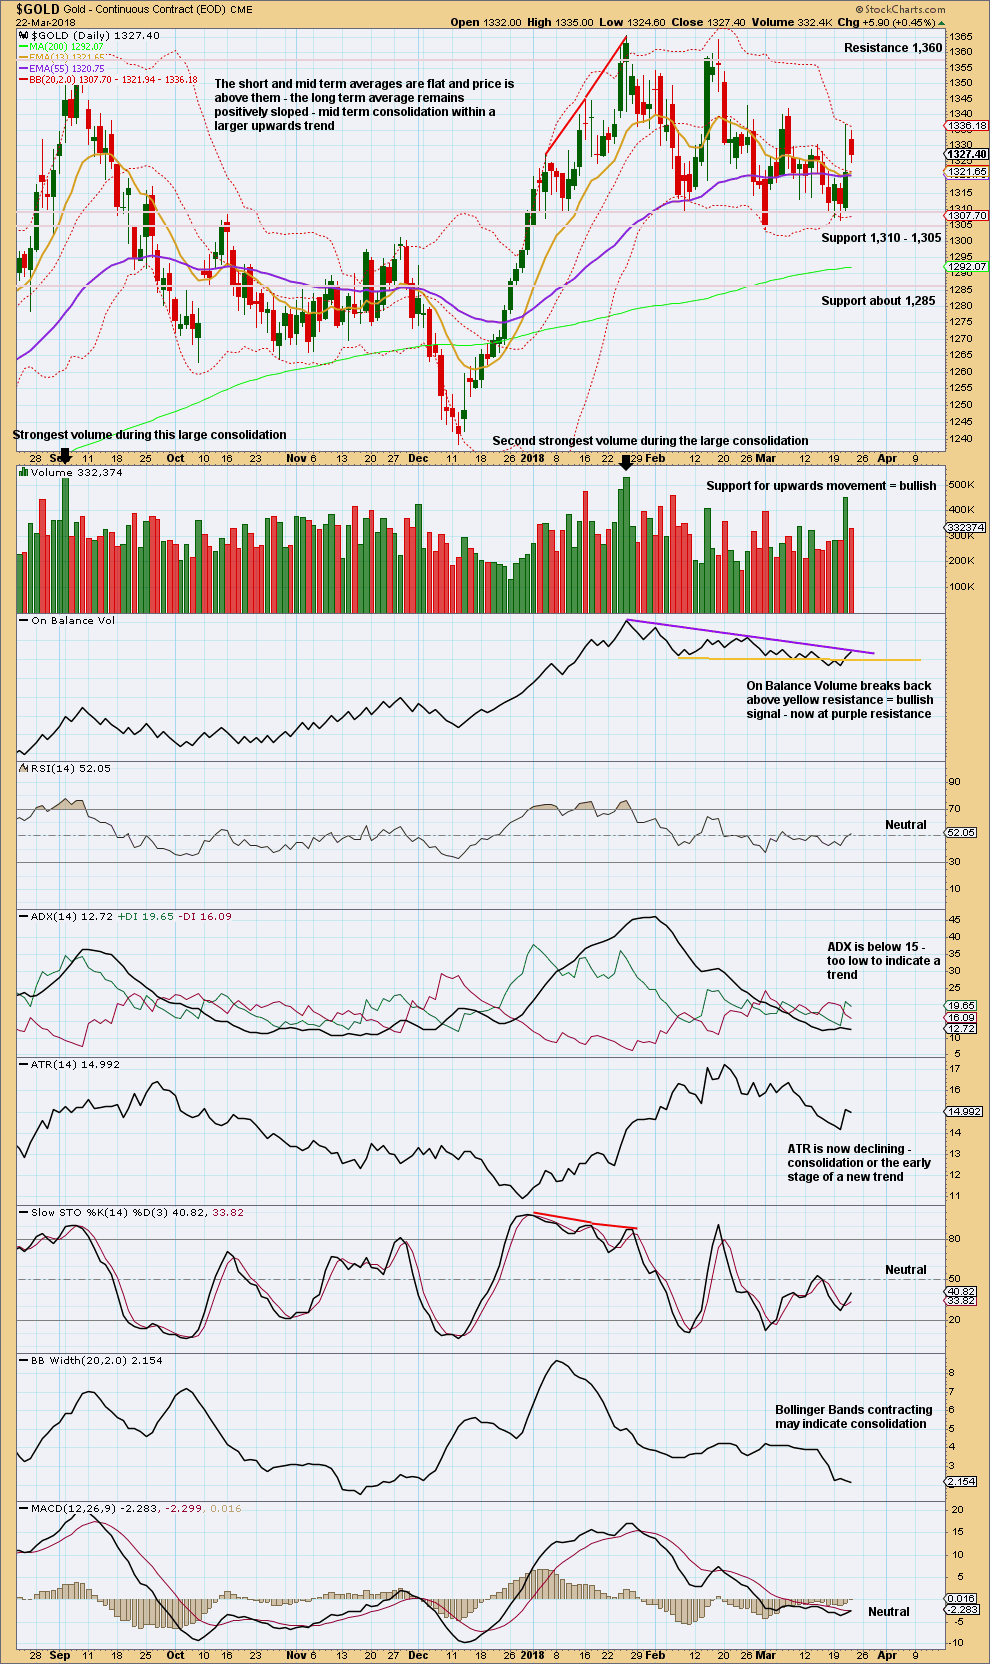
Looking at the bigger picture, Gold has been within a large consolidation since about January 2017 (this chart does not show all of this large consolidation), and during this consolidation it is two upwards days that have strongest volume and an upwards week that has strongest volume. Volume suggests an upwards breakout may be more likely than downwards.
Currently, Gold is within a smaller consolidation that began in early January 2018. This consolidation is delineated by support about 1,310 to 1,305 and resistance (final) about 1,375. It is an upwards day during this smaller consolidation that has strongest volume, suggesting an upwards breakout may be more likely here than downwards.
The last two bearish signals from On Balance Volume are now negated with a breach of the yellow line. Resistance at the purple line may assist to halt the rise in price here. If On Balance Volume breaks above the purple line, that would offer another bullish signal.
It looks reasonable now to expect an upwards swing to resistance to continue. Be aware though that it will probably not move in a straight line as that is not how price behaves within consolidations.
GDX WEEKLY CHART
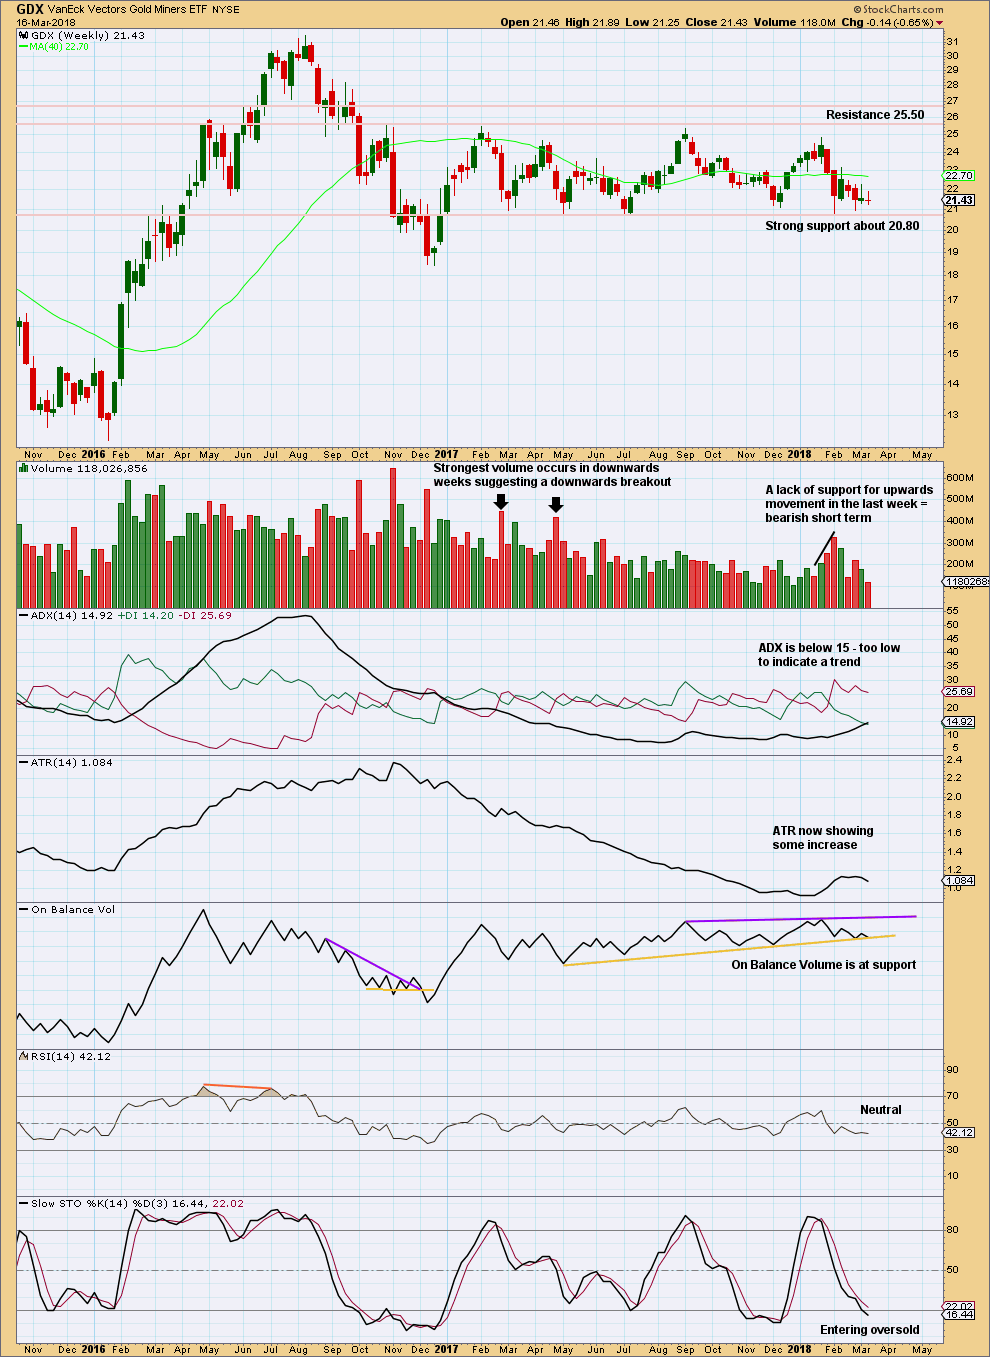
Click chart to enlarge. Chart courtesy of StockCharts.com.
Support about 20.80 has been tested about eight times and so far has held. The more often a support area is tested and holds, the more technical significance it has.
In the first instance, expect this area to continue to provide support. Only a strong downwards day, closing below support and preferably with some increase in volume, would constitute a downwards breakout from the consolidation that GDX has been in for a year now.
Resistance is about 25.50. Only a strong upwards day, closing above resistance and with support from volume, would constitute an upwards breakout.
With On Balance Volume again at support and price close to support, it is reasonable to expect a turn and an upwards swing about here. There is a little room though for a little more downwards movement.
GDX DAILY CHART
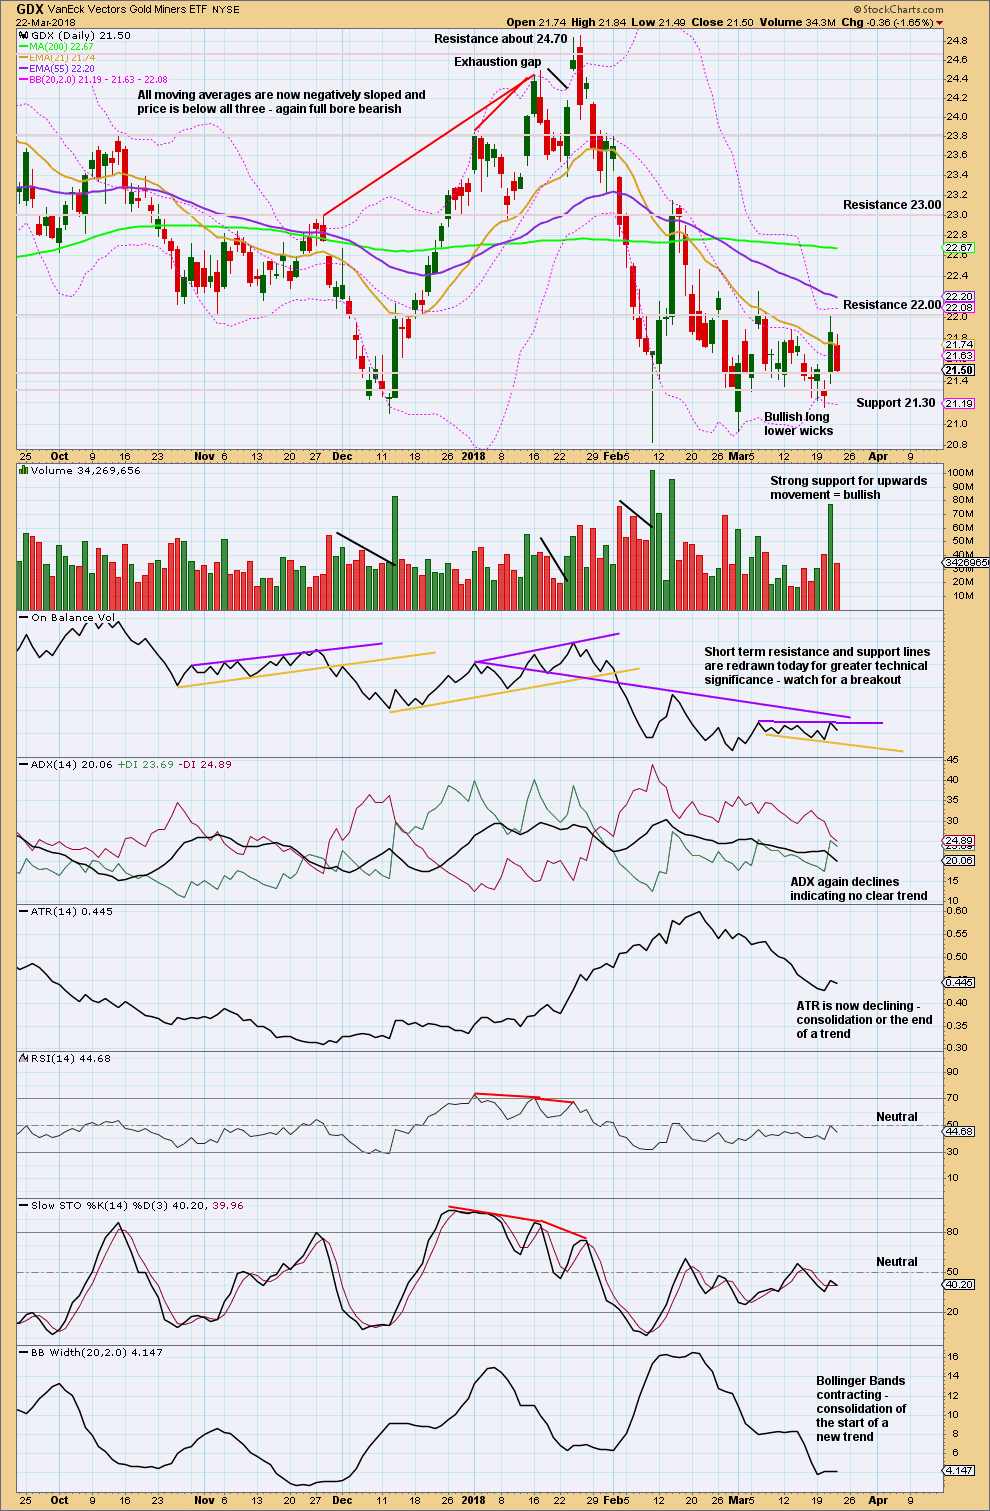
Click chart to enlarge. Chart courtesy of StockCharts.com.
A slightly long upper wick and a close about the low today is bearish for the short term. But overall the volume profile is bullish.
Published @ 06:43 p.m. EST.
Updated hourly chart:
While price remains within the channel, assume it’s going to keep going up.
As it makes new highs redraw the channel: first trend line from the high of submineutte wave i to the last high, then a copy on the low of subminuette ii.
Since sub 2 was flat isn’t it more likely sub4 will be sharp
I have subminuette ii a double zigzag.
So for alternation subminuette iv may most likely be a flat, combination or triangle. And it may be deep, about the 0.618 Fibonacci ratio of subminuette iii.
And it should show up on the daily chart. So last one to two days.
Yeah, the general idea will be for subminuette iv to be a sharper pullback, not so sideways looking. An expanded flat could do that nicely.
looks like the dollar’s moving up so for gold to continue up it will bucking the trend
Yeh, but not looking very third wavish
Sure wish Lara was around during us session
I’m here now
It’s not possible for me to be here during the NY session. NZ has its night while NY has its day.
Seems like sub 2 is over sooner than expected
Exactly.