
Last analysis in March expected upwards movement towards 97.97. Price has thus far continued to move higher, up to 95.02.
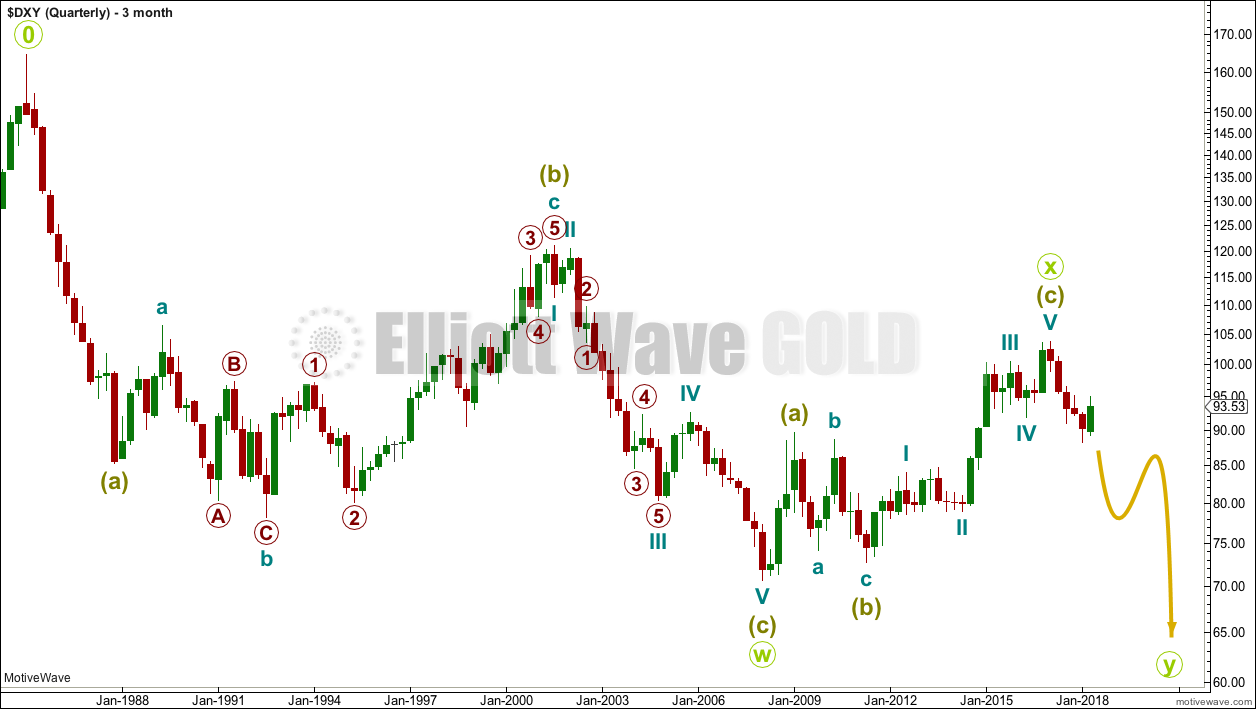
BEARISH ELLIOTT WAVE ANALYSIS
QUARTERLY CHART
Click chart to enlarge.
A huge double zigzag may be continuing lower.
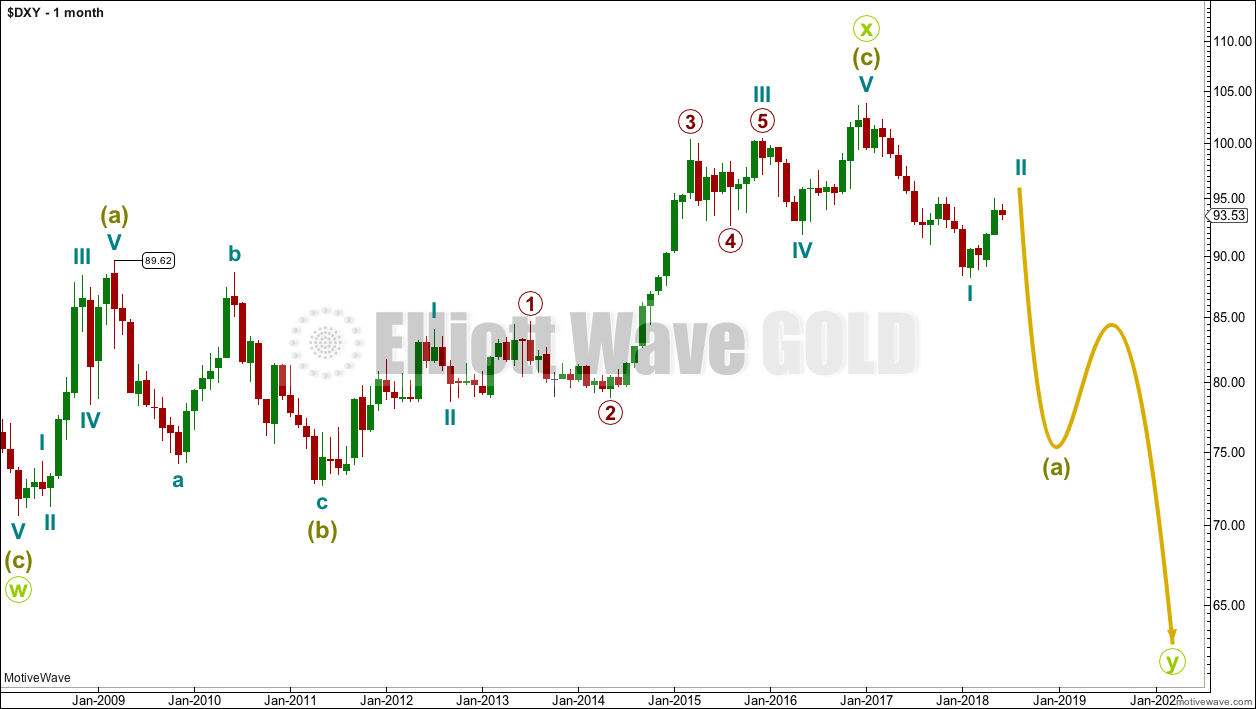
MONTHLY CHART
Click chart to enlarge.
Downwards movement from the high in January 2017 cannot be a fourth wave correction within an ongoing impulse higher because a new low below 89.62 would be back in first wave price territory.
That indicates the last big wave up may be a completed three, and for that reason this is my main wave count.
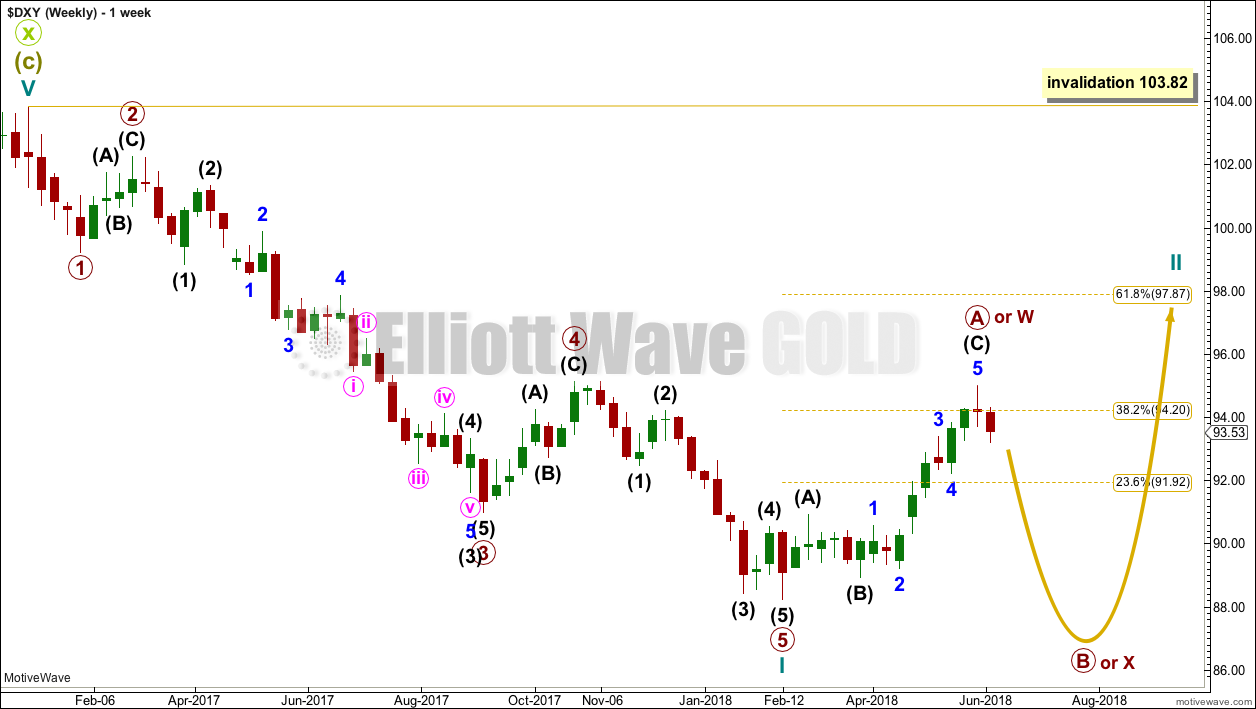
WEEKLY CHART
Click chart to enlarge.
A five down may be complete within the new trend.
A three up now looks complete. This may be primary wave A within a flat correction, or primary wave W within a double zigzag or double combination.
A flat correction would require primary wave B to retrace a minimum 0.9 length of primary wave A at 88.93. Within a flat, primary wave B may make a new extreme beyond the start of primary wave A at 88.25.
A double zigzag would expect a relatively brief and shallow correction for primary wave X.
A double combination would expect a relatively deep and possibly time consuming correction for primary wave X.
Cycle wave II may not move beyond the start of cycle wave I above 103.82.
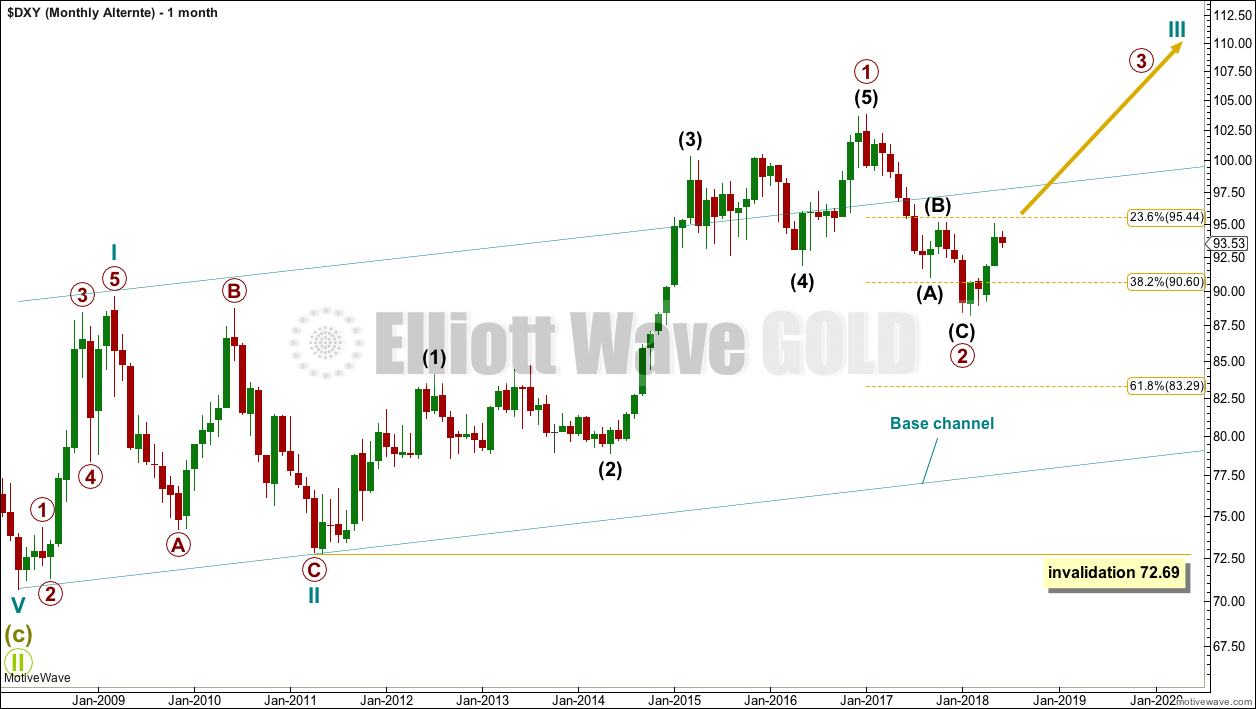
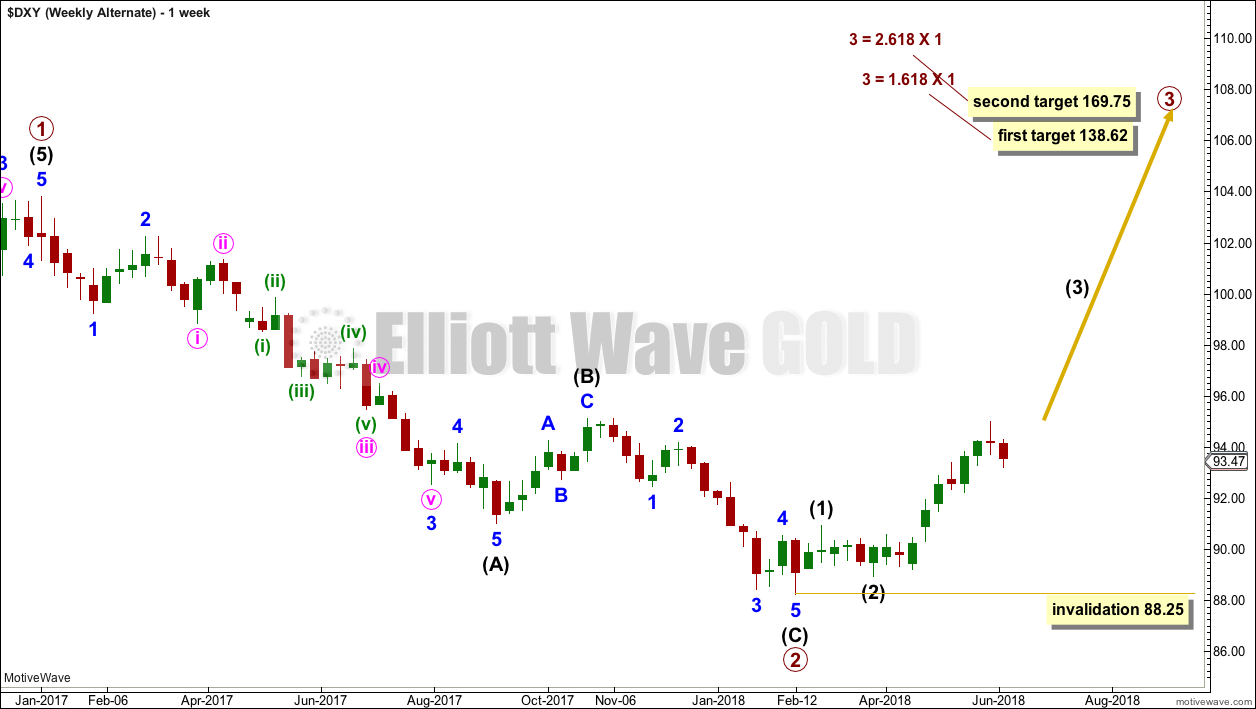
BULLISH ELLIOTT WAVE ANALYSIS
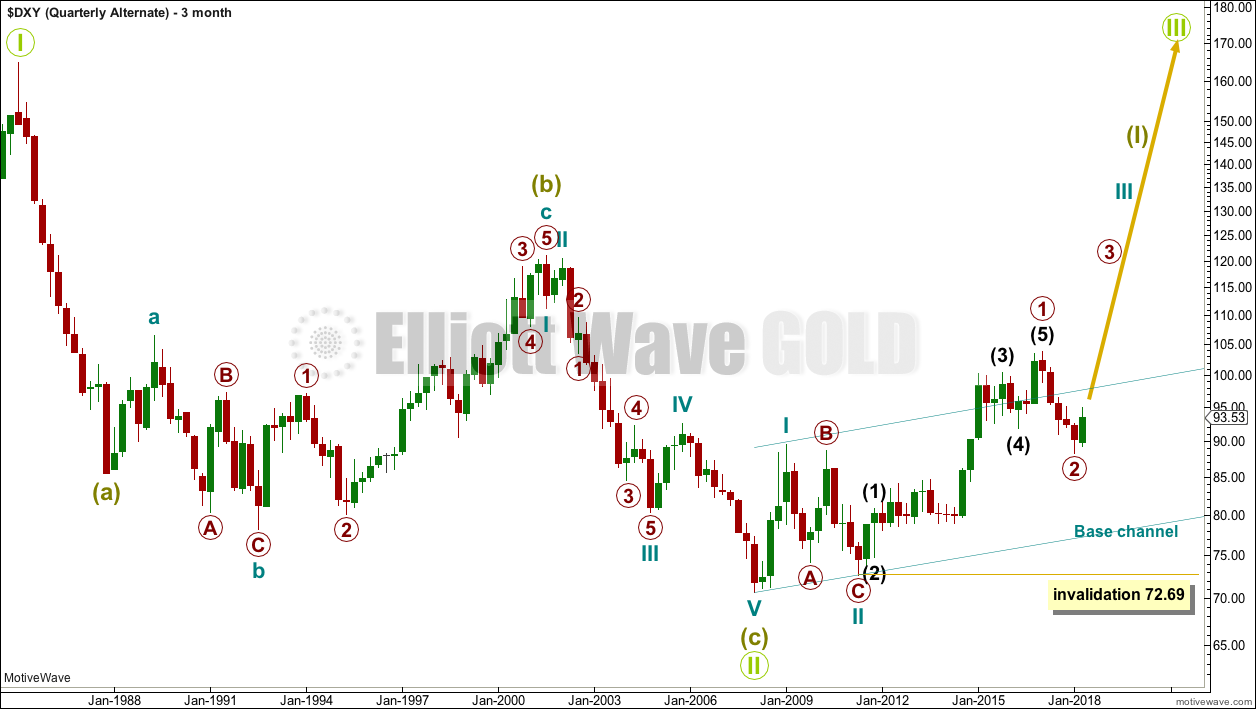
QUARTERLY CHART
Click chart to enlarge.
A single zigzag down to the last major low may still be complete.
A new upwards trend may continue. So far there may be two overlapping first and second waves. Primary wave 2 may not move beyond the start of primary wave 1 below 72.69.
Primary wave 2 should find strong support at the lower edge of the teal base channel if it gets down that low.
MONTHLY CHART
Click chart to enlarge.
Primary wave 2 may be a complete zigzag. However, this wave down can also be seen as a five and primary wave 2 may yet continue lower.
WEEKLY CHART
Click chart to enlarge.
This bullish wave count sees the last wave down as a completed zigzag. If this is correct, then within primary wave 3 no second wave correction may move beyond its start below 88.25.
TECHNICAL ANALYSIS
MONTHLY CHART
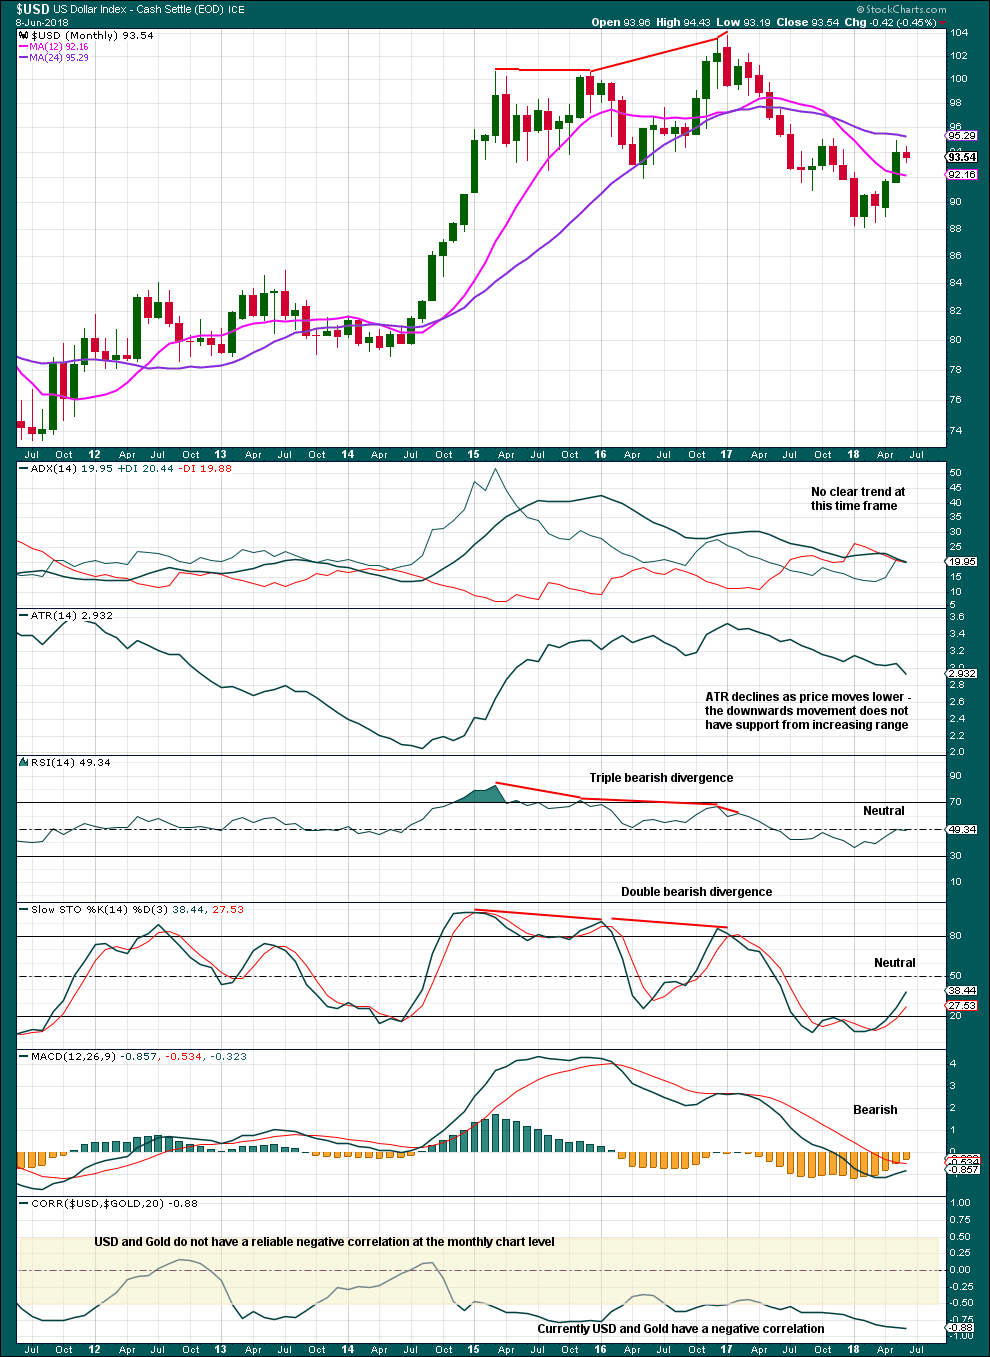
Click chart to enlarge. Chart courtesy of StockCharts.com.
DAILY CHART
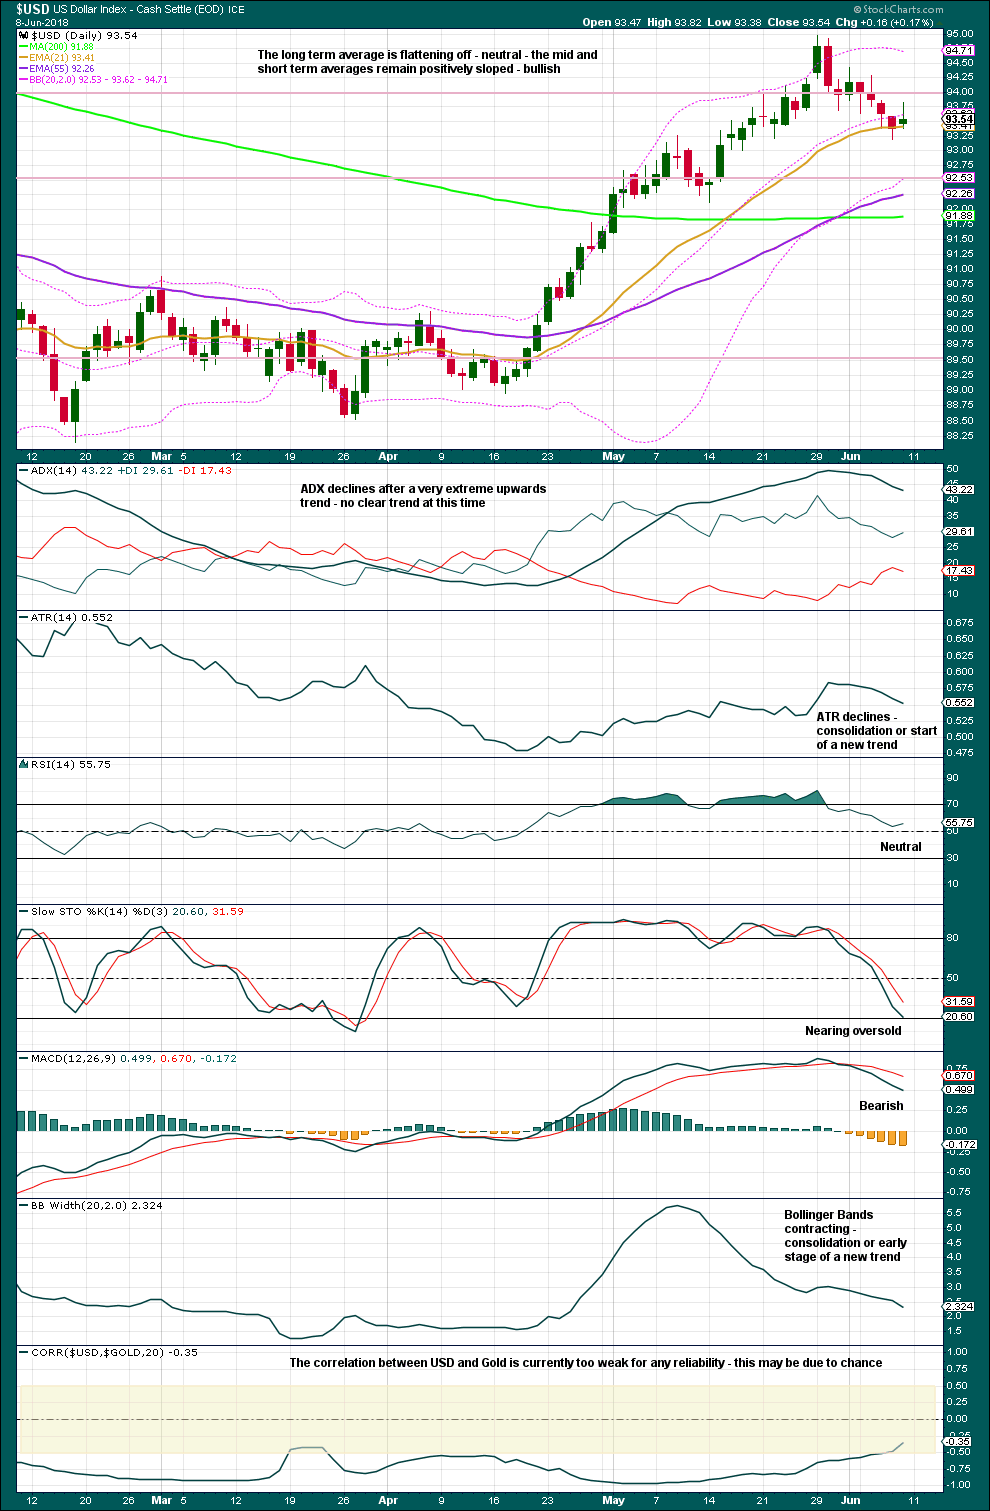
Click chart to enlarge. Chart courtesy of StockCharts.com.
This analysis is published @ 11:02 p.m. EST.