
Upwards movement was expected, although it was expected to be stronger than what transpired.
Summary: The trend is up. The target remains at 1,582. Confidence in targets may be had with price movement above 1,349.25. There is still some bearish indication from volume to warrant extreme caution with any long positions at this time, so for this reason an alternate wave count today is published. One risk management technique for positive long positions would be to move stops up to break even today. Always use a stop for all positions and do not invest more than 3% of equity on any one trade at this time.
New updates to this analysis are in bold.
Grand SuperCycle analysis is here.
WEEKLY ELLIOTT WAVE COUNT
Click chart to enlarge.
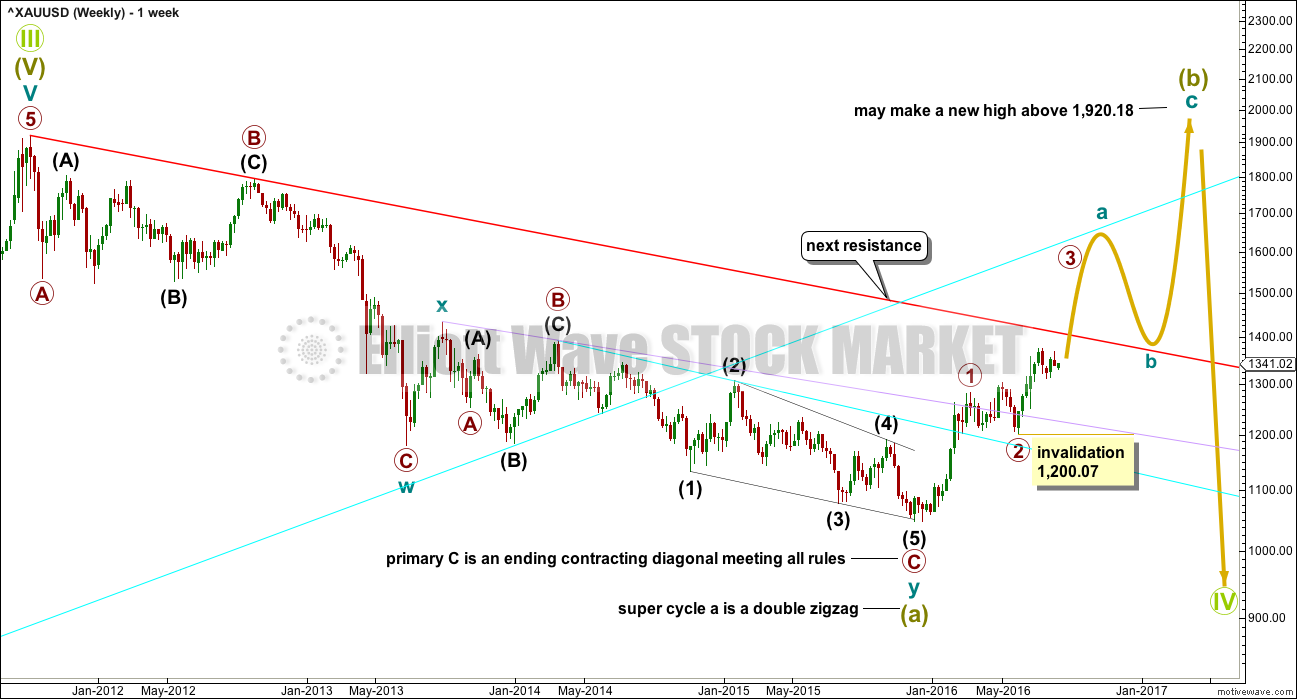
This downwards movement labelled super cycle wave (a) subdivides as a double zigzag from the all time high.
Within the first zigzag labelled cycle wave w, primary wave C is 10.13 short of 1.618 the length of primary wave C. It should be noted that primary wave B is a rare running flat because intermediate wave (C) failed to move beyond the end of intermediate wave (A). This truncation occurred before a very strong downwards movement, which is the kind of situation in which a running flat may appear.
Within the second zigzag labelled cycle wave y, there is no Fibonacci ratio between primary waves A and C. Primary wave C is an ending contracting diagonal which meets all Elliott wave rules.
Grand Super Cycle wave IV may not be a combination because the first wave subdivides as a multiple, and the maximum number of corrective structures within a multiple is three. To label multiples within multiples increases the maximum beyond three, violating the rule.
It may not be a zigzag because Super Cycle wave (a) subdivides as a three and not a five.
This leaves two groups of corrective structures: flats or triangles.
Within an expanded flat or running triangle, Super Cycle wave (b) may make a new high above the start of Super Cycle wave (a) at 1,920.18.
Within a flat, Super Cycle wave (b) must retrace a minimum 90% of Super Cycle wave (a) at 1,833.71.
Within a triangle, there is no minimum nor maximum requirement for Super Cycle wave (b). The only requirement for a B wave within a triangle is it must be a corrective structure.
Super Cycle wave (b) may be any one of 23 possible corrective structures. First, a move of this size should have a clear five up on the daily and weekly charts.
So far there is a five up on the weekly chart that is now labelled primary wave 1. This was followed by a shallow three down labelled primary wave 2, which should be followed by another five up that is for now labelled primary wave 3 but may also be labelled primary wave C.
Within primary wave 3 (or primary wave C), no second wave correction may move beyond the start of its first wave below 1,200.07.
When this next five up is complete, then an alternate wave count at the weekly chart level would be required. Cycle wave a is most likely to unfold as a five wave structure, but it may also be a three. When a 5-3-5 up is complete, then two wave counts at the weekly chart level would be required: one for cycle wave a as a continuing impulse and the other for cycle wave a as a completed zigzag.
The proportions of this wave count look good. Within both zigzags of cycle waves w and y, the C waves are longer in length and duration than the A waves. Cycle wave X is very brief and shallow, exactly as an X wave within a double zigzag should be. The only concern I have with this wave count would be the running flat of primary wave B within cycle wave w.
DAILY ELLIOTT WAVE COUNT

Click chart to enlarge.
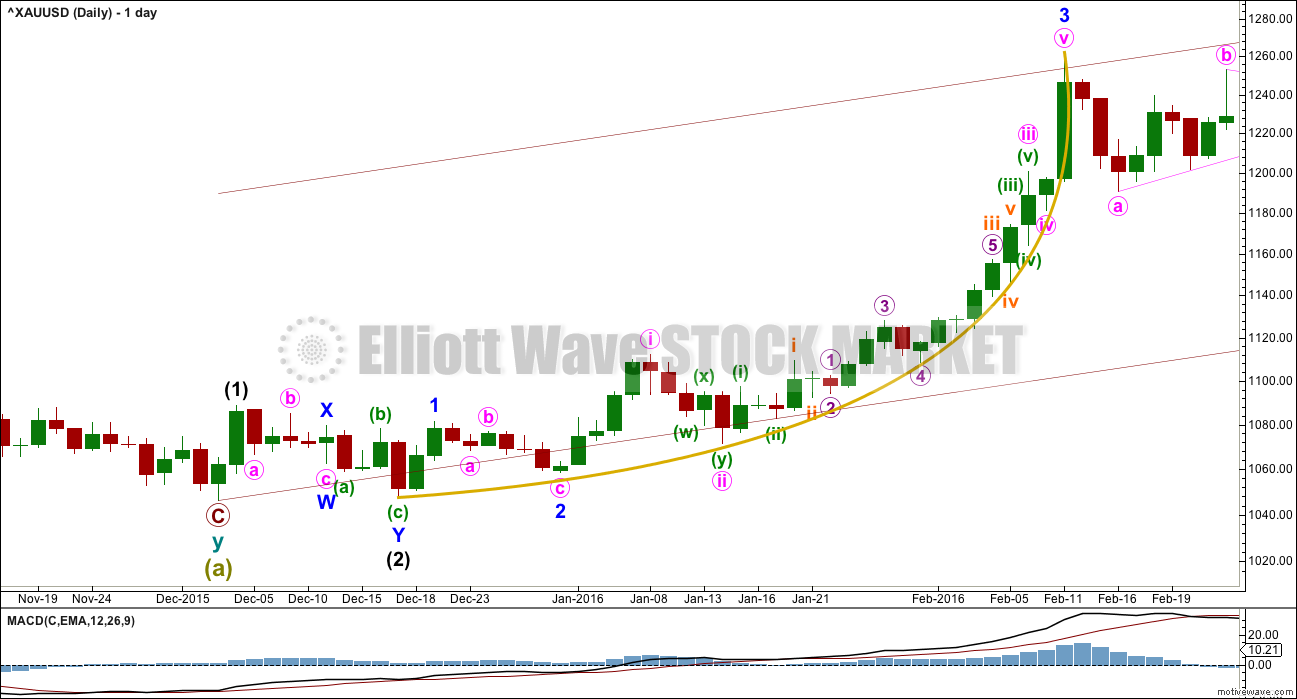
Primary wave 2 is a complete expanded flat correction. Price from the low labelled primary wave 2 has now moved too far upwards to be reasonably considered a continuation of primary wave 2. Primary wave 3 is very likely to have begun and would reach 1.618 the length of primary wave 1 at 1,582.
Primary wave 3 may only subdivide as an impulse.
So far intermediate waves (1) and (2) may be complete within primary wave 3. The middle of primary wave 3 may have begun and may also only subdivide as an impulse.
Within intermediate wave (3), the end of minor wave 1 is moved up to the last high. This fits on the hourly chart although it looks odd here on the daily chart. There was a small fourth wave correction up at the end of minor wave 1 and it subdivides on the hourly chart as an impulse. Minor wave 2 may be a complete zigzag, also subdividing as a zigzag on the hourly chart. If minor wave 2 is over, it would be 0.50 the depth of minor wave 1.
No second wave correction may move beyond the start of its first wave below 1,310.84 within minor wave 3.
At 1,437 intermediate wave (3) would reach 1.618 the length of intermediate wave (1). If price keeps going upwards through this first target, or if it gets there and the structure is incomplete, then the next target would be at 1,552 where intermediate wave (3) would reach 2.618 the length of intermediate wave (1).
The support line in cyan is adjusted today. Draw it from the start of intermediate wave (1) to the end of intermediate wave (2). Downwards corrections may bounce upwards from about this support line.
There may now be four overlapping first and second waves complete: primary, intermediate, minor and now minute. This wave count expects to see an increase in upwards momentum beginning this week.
HOURLY ELLIOTT WAVE COUNT
Click chart to enlarge.
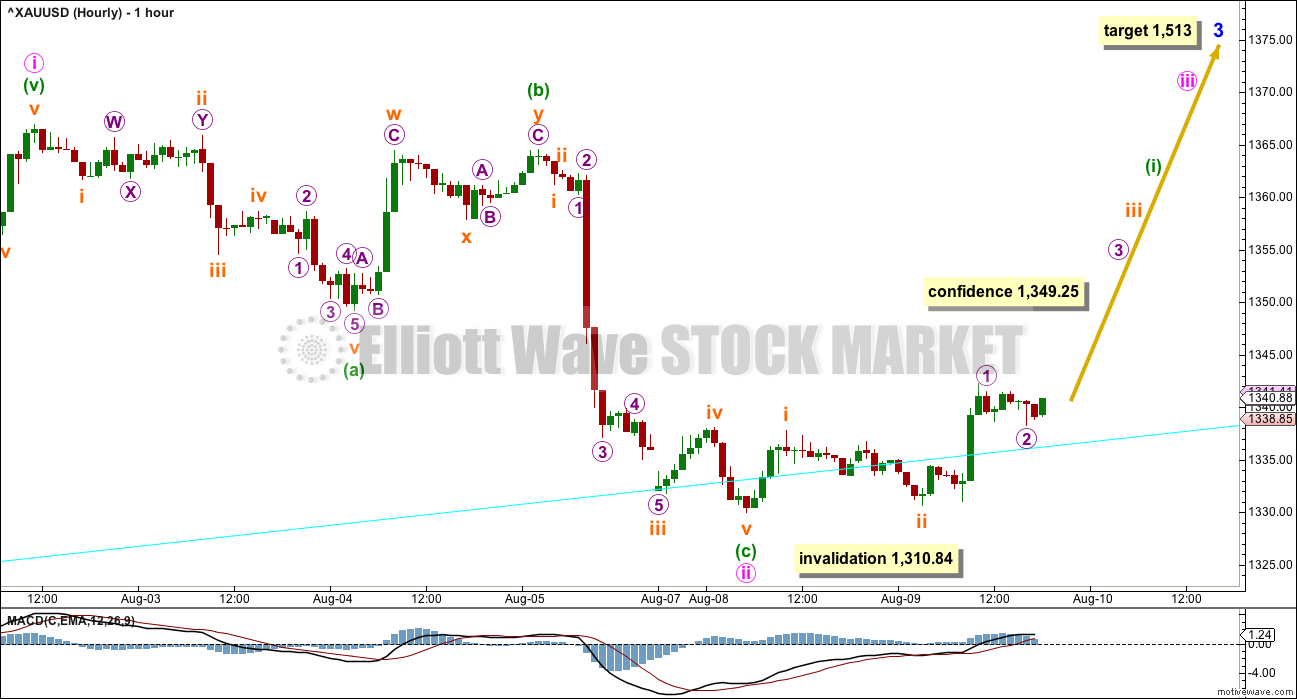
If the cyan support line copied over here from the daily chart is working, then minute wave ii should be over. Minute wave iii upwards should have begun.
At 1,513 minor wave 3 would reach 1.618 the length of minor wave 1.
Within minor wave 3, minute waves i and now ii may be complete. Minute wave ii is a deep 0.66 zigzag, ending close to the cyan support line. At 1,420 minute wave iii would reach 1.618 the length of minute wave i, and at 1,476 minute wave iii would reach 2.618 the length of minute wave i.
Within minute wave ii, 1,349.25 is the low labelled minuette wave (a). A new high above this point could not be a fourth wave correction within an impulse developing lower. A new high above 1,349.25 would confirm that the downwards wave labelled minute wave ii was a three and was over. At that stage, more confidence may be had in targets and the overall upwards direction expected from this wave count.
The invalidation point will remain at the start of minute wave i while price remains below this confirmation point. If minute wave ii continues lower, it may not move beyond the start of minute wave i below 1,310.84.
Within minute wave iii, so far two first and second waves may be complete, but only within minuette wave (i). When minuette wave (i) is complete, then another correction may unfold downwards and may show up on the daily chart as one or more red candlesticks or doji for minuette wave (ii). Minuette wave (ii) may not move beyond the start of minuette wave (i) below 1,330.01.
THIRD WAVE EXAMPLE – DAILY CHART
Click chart to enlarge.
In discussing the curved look to Gold’s impulses, particularly for its third waves, here is an example.
Within primary wave 1, the third wave of minor wave 3 had a strong curved look to it. The impulse begins more slowly and has deep and relatively time consuming second wave corrections: Minor wave 2 was 0.68 of minor wave 1, minute wave ii was 0.76 of minute wave i, minuette wave (ii) was 0.56 of minuette wave (i), and subminuette wave ii was 0.64 of subminuette wave i.
The curved look comes from the disproportion between second and fourth wave corrections within the impulse. Here, minute wave ii lasted 4 days and shows clearly on the daily chart yet minute wave iv was over within one day and does not show up with any red candlesticks or doji on the daily chart.
Momentum builds towards the middle of the impulse, continuing to build further during the fifth wave and ending in a blowoff top. This is typical of Gold and all commodities.
This tendency to blowoff tops and curved impulses is particularly prevalent for Gold’s third waves.
ALTERNATE WEEKLY ELLIOTT WAVE COUNT
Click chart to enlarge.
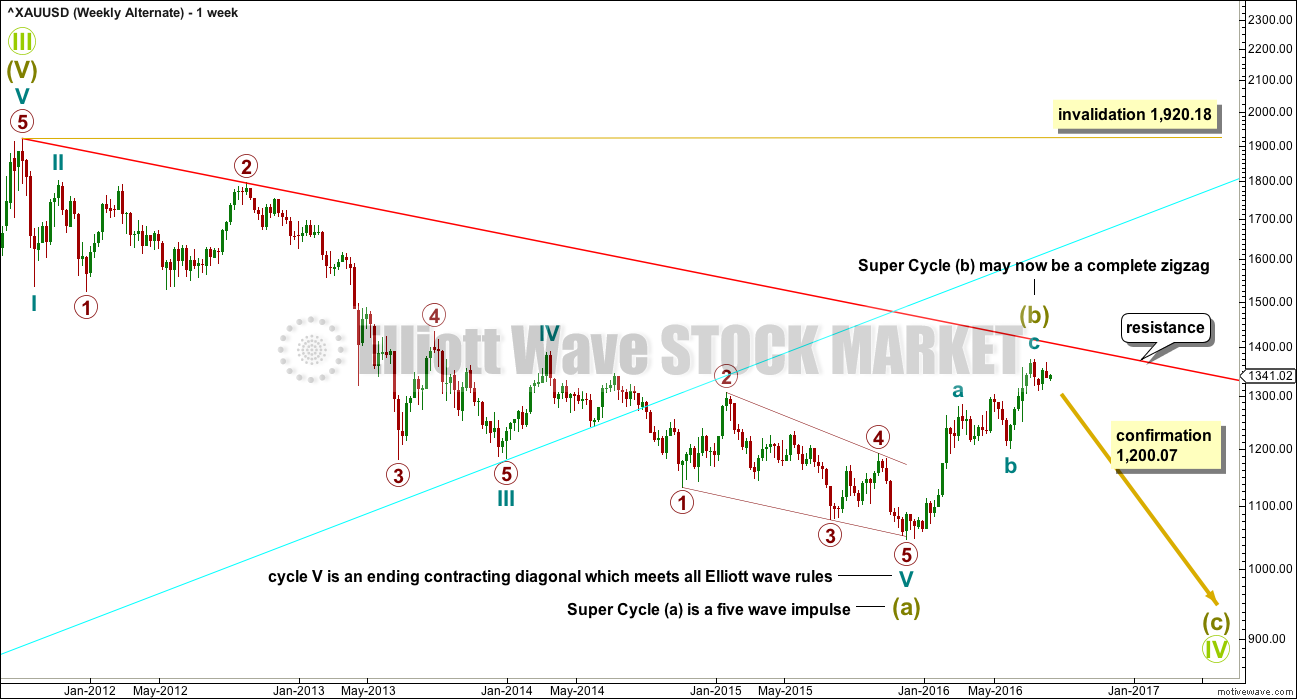
I have found a solution for Super Cycle wave (a) downwards as a five wave impulse, which meets all Elliott wave rules.
Ratios within Super Cycle wave (a) are: cycle wave III is just 5.19 short of 1.618 the length of cycle wave I, and cycle wave V has no Fibonacci ratio to either of cycle waves I or III.
Within Super Cycle wave (a), there is gross disproportion between cycle wave II and primary wave 2 one degree lower. Cycle wave II is very brief at six weeks and primary wave 2 is much longer in duration at 40 weeks. This gives this part of the wave count a very odd look. No rules are broken, so the wave count is technically valid.
Cycle wave III ends with a slight truncation for primary wave 5 by 1.96.
If Super Cycle wave (a) was a five wave impulse, then Super Cycle wave (b) may not move beyond its start above 1,920.18. Super Cycle wave (b) may be any one of more than 23 possible corrective structures. It may possibly now be a complete zigzag.
ALTERNATE DAILY ELLIOTT WAVE COUNT
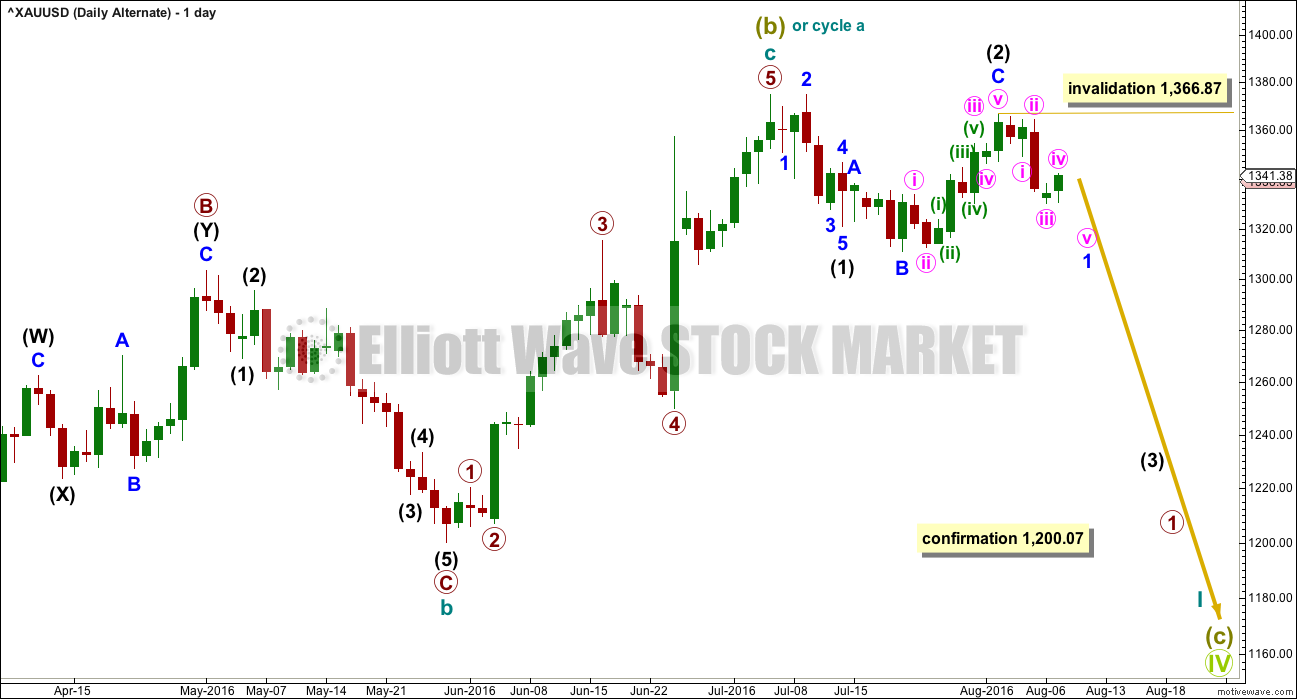
Click chart to enlarge.
If it is over, then Super Cycle wave (b) would have been remarkably brief for a Super Cycle degree wave. It is possible that it may continue further sideways though. The zigzag upwards may have been only cycle wave a of a larger more time consuming flat or triangle.
If this alternate wave count is confirmed with a new low below 1,200.07, then alternate ideas must be considered for Super Cycle wave (b). At this stage, those ideas would not diverge with this chart; they would expect some downwards movement from here.
If a zigzag upwards is complete for Super Cycle wave (b) (or cycle wave a within it), then downwards movement should continue from here.
So far downwards movement may be an impulse for intermediate wave (1), followed by an expanded flat for intermediate wave (2).
Within intermediate wave (3) down, minor wave 1 may be an incomplete impulse. When minor wave 1 is complete, then minor wave 2 may not move beyond the start of minor wave 1 above 1,366.87.
Within minor wave 1, minute wave iv may not move into minute wave i price territory above 1,349.25. This price point would be a very short term invalidation of this alternate idea. If it is passed, then the main wave count would increase in probability.
TECHNICAL ANALYSIS
WEEKLY CHART
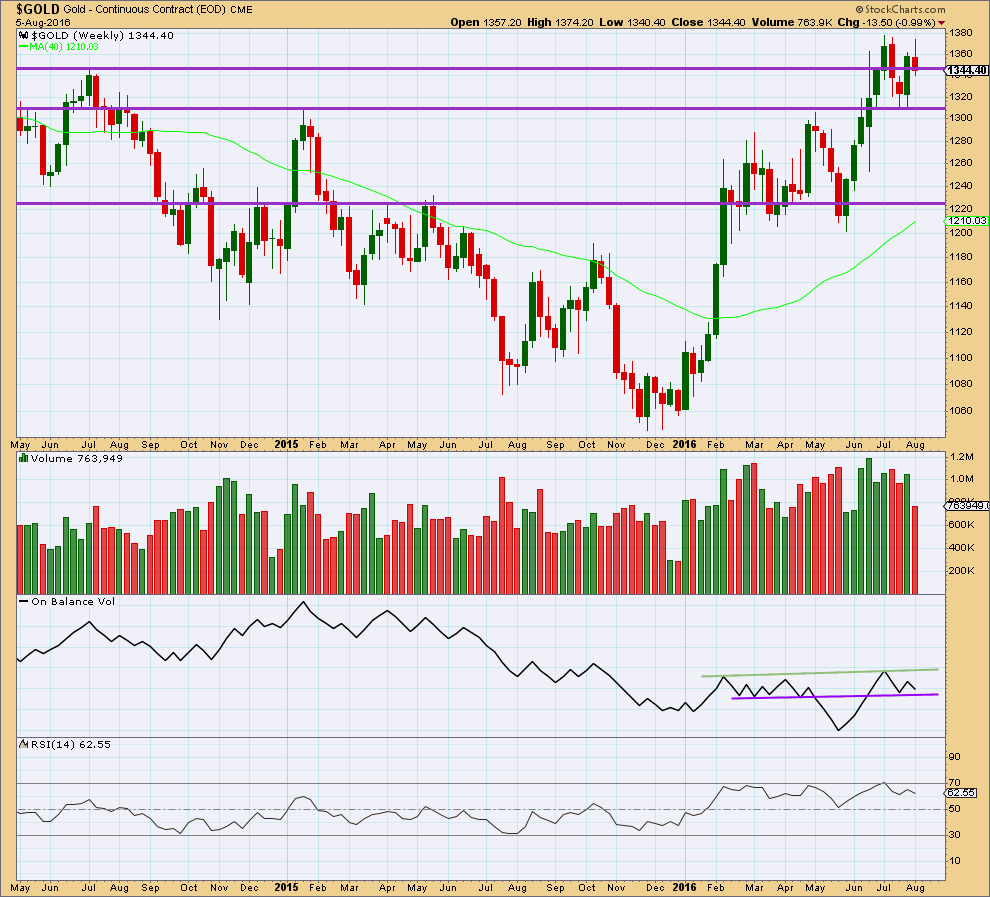
Click chart to enlarge.
The week before last completed a bullish engulfing candlestick pattern supported by stronger volume than the prior downwards week. Last week made a new high, then completed a red candlestick on lighter volume. Overall, the fall in price last week is not supported by volume at the weekly chart level. Last week looks to more likely be a corrective movement than a new trend.
On Balance Volume is still relatively bullish above the purple trend line, which is redrawn at the end of last week. A break below the purple line would be bearish. A break above the green line would be bullish.
RSI is not extreme. There is room for price to rise or fall.
DAILY CHART
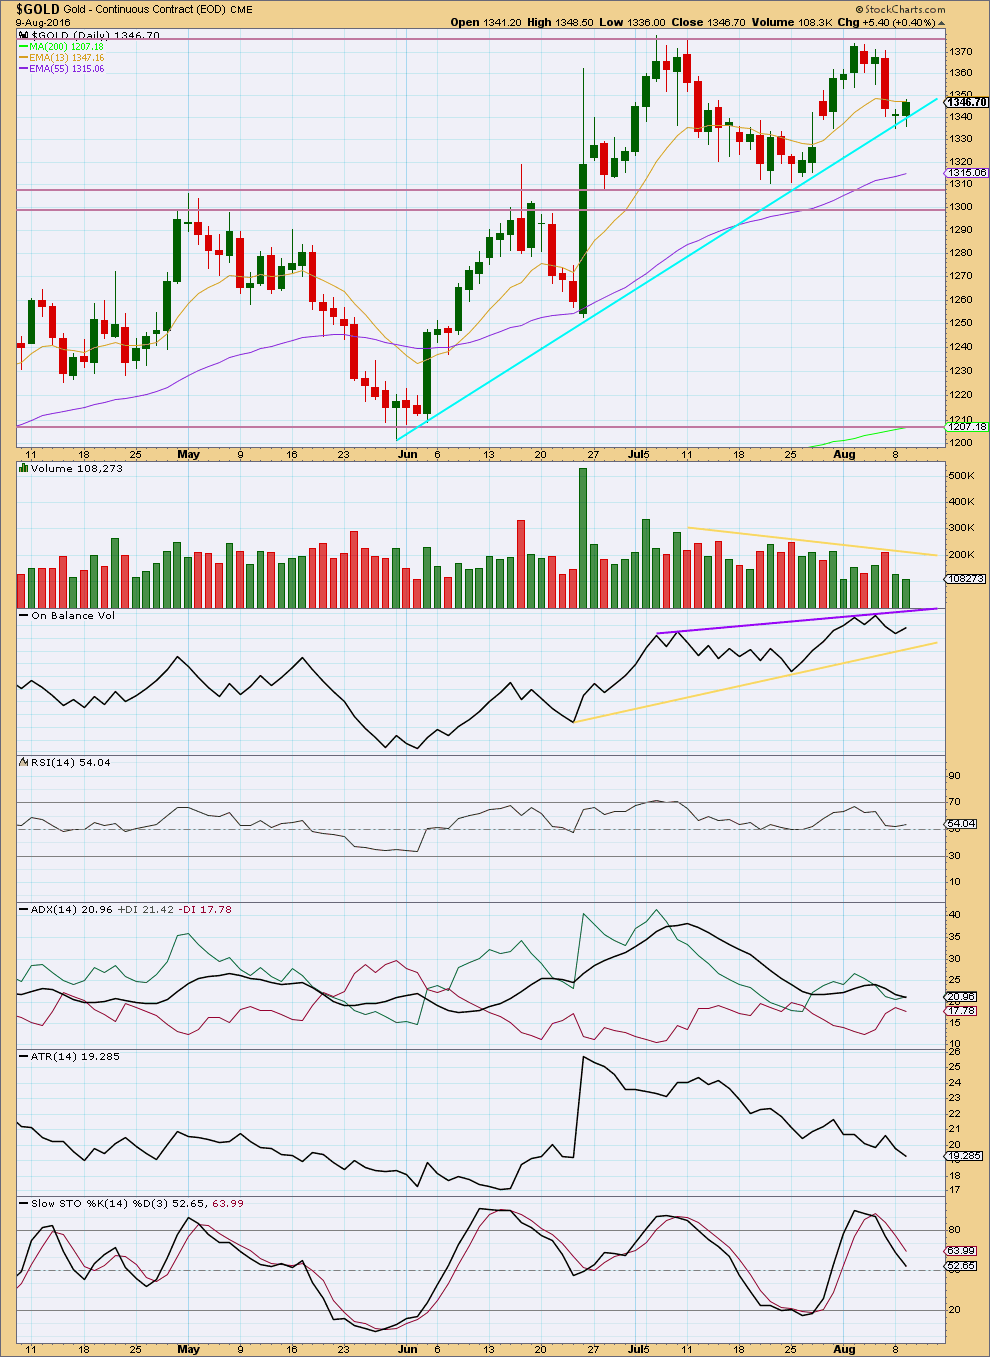
Click chart to enlarge.
From the last high on 2nd of August, volume increased as price fell. The fall in price was supported by volume.
Overall, price for the last two days has risen in a small range on declining volume. The volume profile short term is bearish. This is concerning for the main wave count and the reason today for publishing an alternate.
It looks like price is range bound between resistance about 1,375 and support about 1,305. ADX has been mostly declining since 12th of July and price has overall moved sideways within this range. ATR has also been declining during this period, This supports ADX in expecting the market is consolidating. Volume is declining as price moves sideways.
It is the upwards day of 8th of July, during this big consolidation, that has strongest volume suggesting an upwards breakout is more likely than downwards.
It should be expected during a consolidation that price will swing from support to resistance and back again. Stochastics may be used to indicate when one swing ends and the next begins. At this stage, Stochastics is returning from overbought and is now about neutral. A downwards swing may be expected to continue until Stochastics reaches oversold and price reaches support about 1,305 at the same time.
Price swings during a consolidation do not move in straight lines, and support or resistance may be overshot yet price returns back to within the consolidation. This is one reason why consolidations are so difficult to trade.
RSI is close to neutral. There is room for price to rise or fall.
Trend lines on On Balance Volume are redrawn today. A break above the purple line would be a bullish signal. A break below the yellow line would be a bearish signal.
This analysis is published @ 08:22 p.m. EST.
[Note: Analysis is public today for promotional purposes. Member comments and discussion will remain private.]
Preparing charts… writing up analysis… calculated a target for minuette (ii) at 1,340….
next thing I know price spikes down to 1,340, I have to redo the chart….
Oh well, at least now I can calculate a target for the middle of this third wave for everyone….
Bottom line is the correction looks to be over, I think we have the next low in place.
Buy the dips.
Always use stops!
Question to anyone who is familiar:
I’ve been trading GDX options quite successfully and purchasing them pretty much between the Bid/Ask each time. I get filled with no problem.
I have been observing and experimenting w/GDXJ Option purchasing (Buy to Open). I am finding w/GDXJ that when I place an order to Buy 1/2 way in between the spread, or offer .05/.10 towards the Ask price, I still can’t get a fill.
Does anyone know why I am finding this difference? Of course there is much more volume on GDX than GDXJ
Thank you.
The lower the volume, the harder it is to get filled.
Here is what I do: if I want to see what price my bid gets filled, I put in a very small order and see if it gets filled. For example, if I want to buy 50 options, I put in an order for 5 only and see what price it gets filled… then I know what price I can get it, and put in the rest of the order for 0.05 or 0.10 cents lower for the rest of my order… and if the price goes lower, I also lower my bid. Its a bit tricky, but its just trial and error really…
Thanks…Ari….I am thinking that because of the lower volume/open interest on GDXJ, I am better off w/the more a more straight forword play on the GDX and just buying a larger quantity of options.
I have interest in the GDXJ and individual junior miners at this time as they are currently the stocks gaining more than the Barricks of the world, etc.
Thanks, Ari. That’s interesting.
This is what I think is happening this morning.
The impulse labelled subminuette i has a very good fit, the third wave within it has a typically extended fifth wave.
The correction labelled subminuette ii is probably incomplete, it may end about the 0.618 Fibonacci ratio. It should find support about the cyan trend line.
My only query with this wave count is what degree should this last impulse be labelled, subminuette or minuette?
I think I may need to move this up one degree… this may be minuette (i) and now (ii) completing.
Lara,
agree..seems the best fit as legs pretty clean
clean legs? LOL 🙂
lol
In the bullish count, This has to be (a) of minuette 2 as it almost retraced 61.8% in a matter of an hour. (a) should be complete and in (b) now. The speed and depth is slightly concerning, but second waves are suppose to be sharp.
Am seeing the same. The speedy completion of (a) — if indeed it is complete — makes me wonder if minuette 2 will be rather brief.
Assuming the bullish count is correct. It sounds like Lara has a better bearish alternate to publish this PM
I do 🙂
I think the move is a incomplete zig zag so far.I think we could be in wave b atm, we’ll see.
Alan where r u 🙂
Any count from your side..??
James.
Not much has transpired. The price rise reached a high of 1357.37 at 9:00 am ET. This was just micro 3.
Now, it is dropping in micro 4.
After the drop is completed, I will do a small scalp to micro 5 and hence subminuette 3. I expect a rise of about $10. This is just a scalp only because there is another 4-5, in which the drop from subminuette 3 to subminuette 4 will bring us back to where we started off from, namely around the current low price.
Did a recount.
1357.37 was subminuette 3.
The low at 1342.73 at 1:02 pm ET was subminuette 4.
Price is now breaking out upwards in subminuette 5.
Currently we are in submicro 3 of micro 1. It’s still a long way to go for minuette 1 to complete, unless subminuette 5 is explosive.
My target for minuette 1 remains at 1368-1369.
This is such valuable information, Alan! Thank you very much! If you could continue to keep us posted with your counts, that would be wonderful!
I agree.
At 8:25AM, Minuette (i) likely was over.
Lara 3:09 am comment below.
“Minuette (ii) may arrive in another day or so, and it may again offer a leisurely entry to join the trend.”
It did make a slight higher high at 9:01 AM , which often happens
minuette (i) appears incomplete, has more subdivisions to complete.
Similar to what Alan posted above
https://goldtadise.com/?s=Gold
You all may want to scroll down to ‘Coghlan webinar (video format) including gold and silver – bullish for once!’
This Technician with use of trendlines/Supp/Resist reiterates several of Lara’s levels mentioned by her last few days/weeks. Coghlan also Bullish….Gold.
GDX could gap up in the AM with golds move up tonight
The GDX to Gold ratio still looks good, as long as this trend line holds
Thanks for sharing that, Dreamer. It’s nice to know different perspectives.
Lara as now gold moved over 1349.25 this move is bringing confidance on our main count.But how much weight you are giving to those scary alternates you posted today :(..
And do you think that minutte 1 is over here for hourly chart..?
Not much much weight now in alternates as gold just hit 1352.23 at 00:27 am $3 above Lara’s price confirmation of 1,349.25.
The target remains at 1,582. Confidence in targets may be had with price movement above 1,349.25.
At 1,513 minor wave 3 would reach 1.618 the length of minor wave 1.
Within minor wave 3, minute waves i and now ii may be complete. Minute wave ii is a deep 0.66 zigzag, ending close to the cyan support line. At 1,420 minute wave iii would reach 1.618 the length of minute wave i, and at 1,476 minute wave iii would reach 2.618 the length of minute wave i.
Within minute wave ii, 1,349.25 is the low labelled minuette wave (a). A new high above this point could not be a fourth wave correction within an impulse developing lower.
A new high above 1,349.25 would confirm that the downwards wave labelled minute wave ii was a three and was over. At that stage, more confidence may be had in targets and the overall upwards direction expected from this wave count.
Lara’s video says “Quite a lot of confidence in the main wave count and targets once gold above price confirmation point of $1,349.25 by even a penny.”
Thank you richard
I got that but what i meant to ask that minuette 1 is over or not..?
What Richard said 🙂
And no, I expect minuette (i) may not yet be over.
The invalidation point may now be moved up to the start of minuette (i) at 1,330.01.
Minuette (ii) may arrive in another day or so, and it may again offer a leisurely entry to join the trend.
If this wave count is correct of course. As always, I could be wrong. So manage risk. Use a stop in case the wave count is wrong.
IKR, scary alternates!
I’ll have a new one tomorrow, not as scary, but still quite bearish mid term.
I am calling that price confidence has now been confirmed.
Gold on pmbull just hit high of 1350.72 at 11:53 pm above Lara’s 1349.25 price confidence in targets. http://www.pmbull.com is usually right on or maybe 25 cents away from Lara’s gold count.
Concur. Barchart.com data shows above 1350 too. Although deferring to Lara’s feed for final tranquility of mind…
This should be the same as Lara’s data. Cash Gold from Barchart
Sounds good, thanks Richard!
Sorry Dreamer, thanks was owed to you for this graphic!
No worries Geoffrey
Exactly right 🙂 Thanks Dreamer!
I have a high so far at 1,354.82, so quite nicely confirmed
Gold futures is 1355 in my Thinkorswim platform. The ticker is /yg.
we have an O/L at 1349.25 validates main count?
Edit: not quite yet. I have a high so far at 1,348.96.
So almost… but no cigar
Looking very much as if overnight spot will take out 1350.00
Off to the races!
Did we surpass the confidence point on the hourly chart? I think price is close but just want to confirm what others have seen.
Came within 50 cents on my chart to taking it out.
I have a high so far of 1,348.96.
Almost there…. looking pretty good so far.
Just for curiosity sake and comparison can anyone post a current EWI elliott wave chart for gold?
No, please don’t do that as it’s copyrighted.
Unless…. someone picked up a chart of EWI’s wave count during one of their free weeks? Then it’s okay to share.
Alternately, someone could post a chart with a few labels to outline their overall wave count. The idea can’t be copyrighted. Just their charts can.
Very interesting the new count with super cycle a down as an impulse. Price expectation for that count now closely matches EWI which replaces super-cycle a with a primary A down and now sees the current upward move as an intermediate C of primary B at or near completion. Fascinating!
Dear Lara,
When there is a wave that almost meets every EW rules do you ever consider this wave count ?
Thank you.
Oh yes, that looks better than what I have on my hourly chart actually.
Why did I not see that? Probably too focussed today on weekly charts….
Lara,
Thank you for your work on alternative ideas.
You’re welcome 🙂
looks like your count is more accurate 😀
Where…gold passed 1350:)
Type, I was saying weeeee….lol
Typo!! 🙂